To address the high dimensionality of long stock time series and the limited descriptive capability of a single indicator, this paper proposes a multi-indicator stock-behavior clustering method based on a least-squares progressive iterative approximation (LSPIA)-B-spline control-coefficient representation. First, four financial indicators are constructed from the perspectives of periodic returns, risk exposure, and trading activity, and are standardized in a unified manner. Second, a common cubic B-spline basis is fitted to each stock's standardized multi-indicator series by LSPIA, yielding comparable, low-dimensional control-coefficient matrices without directly solving the least-squares normal equations. Rather than treating the coefficients as ordinary compressed features, we define a distance between the fitted series. On this basis, K-means is used to identify groups of stocks with similar market behavior. The clustering results are comprehensively evaluated using internal clustering indices, clustering stability, and economic-characteristic analysis. The proposed method provides an analytical framework for identifying stock-behavior structures that jointly considers temporal patterns, computational efficiency, and interpretability.
Citation: Siyu Shen, Lijuan Hu, Chengzhi Liu. Multi-indicator stock clustering based on LSPIA-B-spline control-coefficient representation[J]. AIMS Mathematics, 2026, 11(11): 35929-35956. doi: 10.3934/math.20261393
To address the high dimensionality of long stock time series and the limited descriptive capability of a single indicator, this paper proposes a multi-indicator stock-behavior clustering method based on a least-squares progressive iterative approximation (LSPIA)-B-spline control-coefficient representation. First, four financial indicators are constructed from the perspectives of periodic returns, risk exposure, and trading activity, and are standardized in a unified manner. Second, a common cubic B-spline basis is fitted to each stock's standardized multi-indicator series by LSPIA, yielding comparable, low-dimensional control-coefficient matrices without directly solving the least-squares normal equations. Rather than treating the coefficients as ordinary compressed features, we define a distance between the fitted series. On this basis, K-means is used to identify groups of stocks with similar market behavior. The clustering results are comprehensively evaluated using internal clustering indices, clustering stability, and economic-characteristic analysis. The proposed method provides an analytical framework for identifying stock-behavior structures that jointly considers temporal patterns, computational efficiency, and interpretability.

| [1] |
R. N. Mantegna, Hierarchical structure in financial markets, Eur. Phys. J. B, 11 (1999), 193-197. https://doi.org/10.1007/s100510050929 doi: 10.1007/s100510050929
|
| [2] |
L. J. Lao, Y. M. Shao, Dynamic clustering analysis of return series of industrial indexes in Chinese stock market (in Chinese), J. Finance Econ., 30 (2004), 76–83. |
| [3] |
T. W. Liao, Clustering of time series data-a survey, Pattern Recognit., 38 (2005), 1857-1874. https://doi.org/10.1016/j.patcog.2005.01.025 doi: 10.1016/j.patcog.2005.01.025
|
| [4] |
S. Aghabozorgi, A. S. Shirkhorshidi, T. Y. Wah, Time-series clustering-a decade review, Inf. Syst., 53 (2015), 16-38. https://doi.org/10.1016/j.is.2015.04.007 doi: 10.1016/j.is.2015.04.007
|
| [5] |
R. Cerqueti, P. D'Urso, L. De Giovanni, M. Giacalone, R. Mattera, Weighted score-driven fuzzy clustering of time series with a financial application, Expert Syst. Appl., 198 (2022), 116752. https://doi.org/10.1016/j.eswa.2022.116752 doi: 10.1016/j.eswa.2022.116752
|
| [6] |
J. V. Sáenz, F. M. Quiroga, A. F. Bariviera, Data vs. information: using clustering techniques to enhance stock returns forecasting, Int. Rev. Financ. Anal., 88 (2023), 102657. https://doi.org/10.1016/j.irfa.2023.102657 doi: 10.1016/j.irfa.2023.102657
|
| [7] |
M. Kahssay, S. Miah, A comparative analysis of stochastic models for stock price forecasting: the influence of historical data duration and volatility regimes, Quant. Finance Econ., 9 (2025), 602-630. https://doi.org/10.3934/QFE.2025021 doi: 10.3934/QFE.2025021
|
| [8] |
A. López-Oriona, J. A. Vilar, Quantile cross-spectral density: a novel and effective tool for clustering multivariate time series, Expert Syst. Appl., 185 (2021), 115677. https://doi.org/10.1016/j.eswa.2021.115677 doi: 10.1016/j.eswa.2021.115677
|
| [9] |
R. Mattera, G. Scepi, P. Kaur, Time series clustering for high-dimensional portfolio selection: a comparative study, Soft Comput., 29 (2025), 4219-4231. https://doi.org/10.1007/s00500-025-10656-2 doi: 10.1007/s00500-025-10656-2
|
| [10] |
P. D'Urso, L. A. García-Escudero, L. De Giovanni, V. Vitale, A. Mayo-Iscar, Robust fuzzy clustering of time series based on B-splines, Int. J. Approx. Reason., 136 (2021), 223-246. https://doi.org/10.1016/j.ijar.2021.06.010 doi: 10.1016/j.ijar.2021.06.010
|
| [11] |
G. H. Tang, L. Zhu, C. F. Liao, F. W. Jiang, Asset pricing research based on autoencoder machine learning: a financial big data analysis perspective of the Chinese stock market (in Chinese), J. Manag. Sci. China, 27 (2024), 82-97. https://doi.org/10.19920/j.cnki.jmsc.2024.09.006 doi: 10.19920/j.cnki.jmsc.2024.09.006
|
| [12] |
Q. M. Luan, J. Hamp, Automated regime classification in multidimensional time series data using sliced Wasserstein k-means clustering, Data Sci. Finance Econ., 5 (2025), 387-418. https://doi.org/10.3934/DSFE.2025016 doi: 10.3934/DSFE.2025016
|
| [13] |
C. De Boor, A practical guide to splines, New York: Springer, 1978. |
| [14] |
C. Y. Deng, H. W. Lin, Progressive and iterative approximation for least squares B-spline curve and surface fitting, Comput. Aided Des., 47 (2014), 32-44. https://doi.org/10.1016/j.cad.2013.08.012 doi: 10.1016/j.cad.2013.08.012
|
| [15] |
H. W. Lin, T. Maekawa, C. Y. Deng, Survey on geometric iterative methods and their applications, Comput. Aided Des., 95 (2018), 40-51. https://doi.org/10.1016/j.cad.2017.10.002 doi: 10.1016/j.cad.2017.10.002
|
| [16] |
D. Rios, B. Jüttler, LSPIA, (stochastic) gradient descent, and parameter correction, J. Comput. Appl. Math., 406 (2022), 113921. https://doi.org/10.1016/j.cam.2021.113921 doi: 10.1016/j.cam.2021.113921
|
| [17] |
S. Sajavičius, Hyperpower least squares progressive iterative approximation, J. Comput. Appl. Math., 422 (2023), 114888. https://doi.org/10.1016/j.cam.2022.114888 doi: 10.1016/j.cam.2022.114888
|
| [18] |
N. C. Wu, C. Z. Liu, Asynchronous progressive iterative approximation method for least squares fitting, Comput. Aided Geom. Des., 111 (2024), 102295. https://doi.org/10.1016/j.cagd.2024.102295 doi: 10.1016/j.cagd.2024.102295
|
| [19] |
N. C. Wu, C. Z. Liu, Randomized progressive iterative approximation for B-spline curve and surface fittings, Appl. Math. Comput., 473 (2024), 128669. https://doi.org/10.1016/j.amc.2024.128669 doi: 10.1016/j.amc.2024.128669
|
| [20] |
C. Z. Liu, N. C. Wu, J. C. Li, Efficient two-dimensional randomized progressive iterative approximation for large-scale B-spline fitting, CSIAM Trans. Appl. Math., 7 (2026), 556-575. https://doi.org/10.4208/csiam-am.SO-2025-0062 doi: 10.4208/csiam-am.SO-2025-0062
|
| [21] |
N. C. Wu, H. H. Cao, C. Z. Liu, Momentum-accelerated randomized geometric iterative methods for curve and surface approximation, Comput. Aided Des., 192 (2026), 104011. https://doi.org/10.1016/j.cad.2025.104011 doi: 10.1016/j.cad.2025.104011
|
| [22] |
J. M. Karpoff, The relation between price changes and trading volume: a survey, J. Financ. Quant. Anal., 22 (1987), 109-126. https://doi.org/10.2307/2330874 doi: 10.2307/2330874
|
| [23] |
H. W. Xing, W. Q. Liu, Turnover: liquidity or uncertainty, J. Shanghai Univ. Finance Econ., 20 (2018), 58-71. https://doi.org/10.16538/j.cnki.jsufe.2018.05.005 doi: 10.16538/j.cnki.jsufe.2018.05.005
|
| [24] |
T. G. Andersen, T. Bollerslev, F. X. Diebold, P. Labys, Modeling and forecasting realized volatility, Econometrica, 71 (2003), 579-625. https://doi.org/10.1111/1468-0262.00418 doi: 10.1111/1468-0262.00418
|
| [25] |
S. Lloyd, Least squares quantization in PCM, IEEE Trans. Inf. Theory, 28 (1982), 129-137. https://doi.org/10.1109/TIT.1982.1056489 doi: 10.1109/TIT.1982.1056489
|
| [26] |
P. J. Rousseeuw, Silhouettes: a graphical aid to the interpretation and validation of cluster analysis, J. Comput. Appl. Math., 20 (1987), 53-65. https://doi.org/10.1016/0377-0427(87)90125-7 doi: 10.1016/0377-0427(87)90125-7
|
| [27] |
T. Caliński, J. Harabasz, A dendrite method for cluster analysis, Commun. Stat., 3 (1974), 1-27. https://doi.org/10.1080/03610927408827101 doi: 10.1080/03610927408827101
|
| [28] |
D. L. Davies, D. W. Bouldin, A cluster separation measure, IEEE Trans. Pattern Anal. Mach. Intell., PAMI-1 (1979), 224-227. https://doi.org/10.1109/TPAMI.1979.4766909 doi: 10.1109/TPAMI.1979.4766909
|
| [29] |
L. Hubert, P. Arabie, Comparing partitions, J. Classif., 2 (1985), 193-218. https://doi.org/10.1007/BF01908075 doi: 10.1007/BF01908075
|
Figures(3) / Tables(12)

Siyu Shen, Lijuan Hu, Chengzhi Liu. Multi-indicator stock clustering based on LSPIA-B-spline control-coefficient representation[J]. AIMS Mathematics, 2026, 11(11): 35929-35956. doi: 10.3934/math.20261393

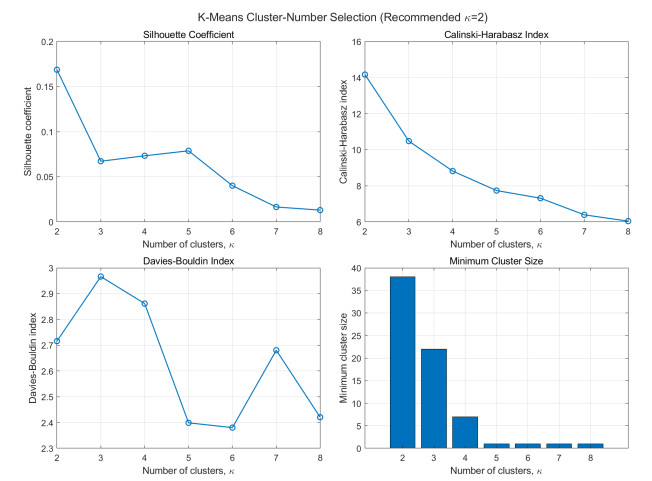
K-means evaluation results under different numbers of clusters
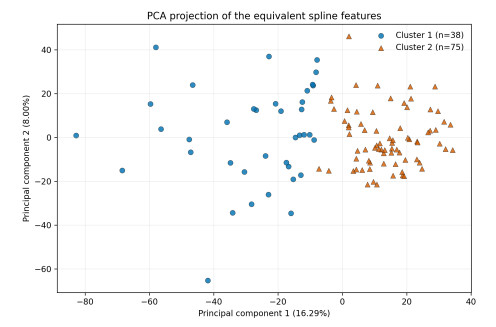
Two-dimensional PCA projection of the control-coefficient features and K-means clustering results
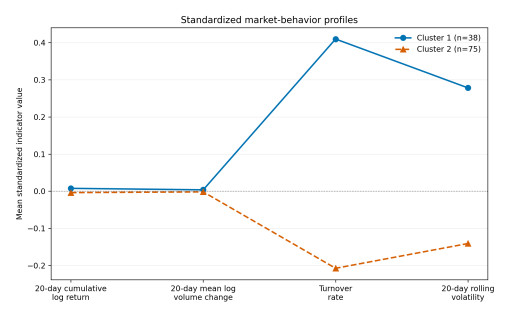
Standardized market-behavior characteristics of the stock clusters




 DownLoad: