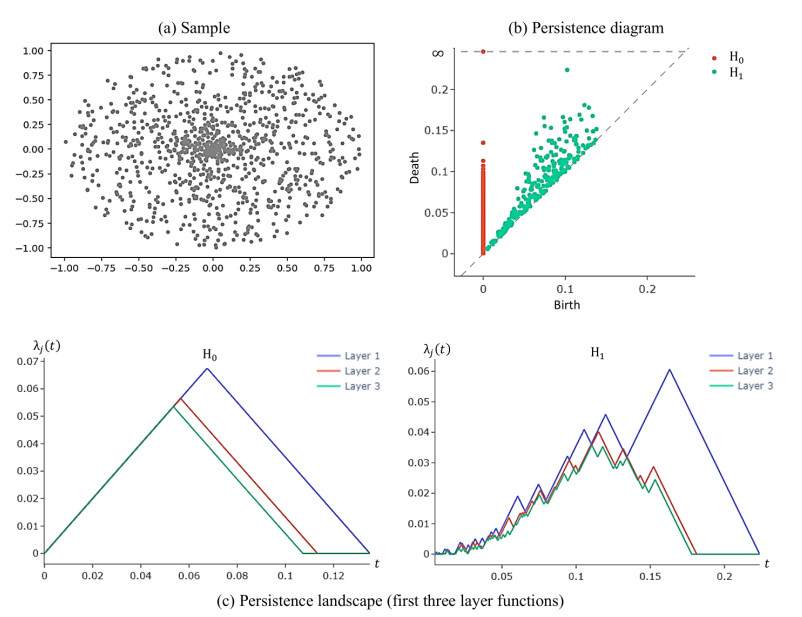
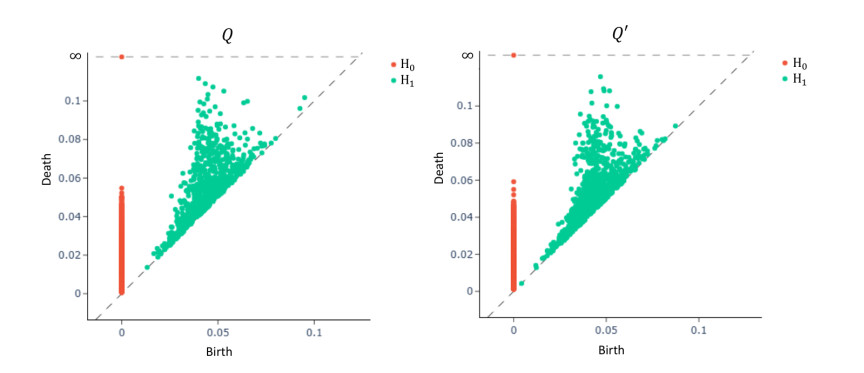
Topological data analysis is an approach to study the shape of a data set by means of topology. Its main object of study is the persistence diagram, which represents the topological features of the data set at different spatial resolutions. Multiple data sets can be compared by the similarity of their diagrams to understand their behaviors relative to each other. The bottleneck and Wasserstein distances are often used as a tool to indicate the similarity. In this paper, we introduce the cosine similarity as a new indicator for the similarity between persistence diagrams and investigate its properties. Furthermore, it leads to the new notion of orthogonality between persistence diagrams. It turns out that the orthogonality refers to perfect dissimilarity between persistence diagrams under the cosine similarity. Through data demonstration, the cosine similarity is shown to be more accurate than the standard distances to measure the similarity between persistence diagrams.
Citation: Azmeer Nordin, Mohd Salmi Md Noorani, Nurulkamal Masseran, Mohd Sabri Ismail, Nur Firyal Roslan. Cosine similarity and orthogonality of persistence diagrams[J]. AIMS Mathematics, 2025, 10(9): 21080-21103. doi: 10.3934/math.2025942
Topological data analysis is an approach to study the shape of a data set by means of topology. Its main object of study is the persistence diagram, which represents the topological features of the data set at different spatial resolutions. Multiple data sets can be compared by the similarity of their diagrams to understand their behaviors relative to each other. The bottleneck and Wasserstein distances are often used as a tool to indicate the similarity. In this paper, we introduce the cosine similarity as a new indicator for the similarity between persistence diagrams and investigate its properties. Furthermore, it leads to the new notion of orthogonality between persistence diagrams. It turns out that the orthogonality refers to perfect dissimilarity between persistence diagrams under the cosine similarity. Through data demonstration, the cosine similarity is shown to be more accurate than the standard distances to measure the similarity between persistence diagrams.

| [1] |
N. Otter, M. A. Porter, U. Tillmann, P. Grindrod, H. A. Harrington, A roadmap for the computation of persistent homology, EPJ Data Sci., 6 (2017), 17. https://doi.org/10.1140/epjds/s13688-017-0109-5 doi: 10.1140/epjds/s13688-017-0109-5

|
| [2] | L. Wasserman, Topological data analysis, Annu. Rev. Stat. Appl., 5 (2018), 501–532. https://doi.org/10.1146/annurev-statistics-031017-100045 |
| [3] |
F. Chazal, B. Michel, An introduction to topological data analysis: fundamental and practical aspects for data scientists, Front. Artif. Intell., 4 (2021), 667963. https://doi.org/10.3389/frai.2021.667963 doi: 10.3389/frai.2021.667963
|
| [4] |
F. Hensel, M. Moor, B. Rieck, A survey of topological machine learning methods, Front. Artif. Intell., 4 (2021), 681108. https://doi.org/10.3389/frai.2021.681108 doi: 10.3389/frai.2021.681108
|
| [5] |
Y. Skaf, R. Laubenbacher, Topological data analysis in biomedicine: A review, J. Biomed. Inform., 130 (2022), 104082. https://doi.org/10.1016/j.jbi.2022.104082 doi: 10.1016/j.jbi.2022.104082
|
| [6] |
M. Gidea, Y. Katz, Topological data analysis of financial time series: Landscapes of crashes, Physica A, 491 (2018), 820–834. https://doi.org/10.1016/j.physa.2017.09.028 doi: 10.1016/j.physa.2017.09.028
|
| [7] |
S. Arvanitis, M. Detsis, Mild explocivity, persistent homology and cryptocurrencies' bubbles: An empirical exercise, AIMS Mathematics, 9 (2024), 896–917. https://doi.org/10.3934/math.2024045 doi: 10.3934/math.2024045
|
| [8] | C. Y. Li, M. Ovsjanikov, F. Chazal, Persistence-based structural recognition, 2014 IEEE Conference on Computer Vision and Pattern Recognition, Columbus, USA, 2014, 2003–2010. https://doi.org/10.1109/CVPR.2014.257 |
| [9] | H. Edelsbrunner, J. L. Harer, Computational topology: An introduction, Providence: American Mathematical Society, 2010. https://doi.org/10.1090/mbk/069 |
| [10] |
N. F. S. Zulkepli, M. S. M. Noorani, F. A. Razak, M. Ismail, M. A. Alias, Haze detection using persistent homology, AIP Conf. Proc., 2111 (2019), 020012. https://doi.org/10.1063/1.5111219 doi: 10.1063/1.5111219
|
| [11] |
N. F. S. Zulkepli, M. S. M. Noorani, F. A. Razak, M. Ismail, M. A. Alias, Topological characterization of haze episodes using persistent homology, Aerosol Air Qual. Res., 19 (2019), 1614–1624. https://doi.org/10.4209/aaqr.2018.08.0315 doi: 10.4209/aaqr.2018.08.0315
|
| [12] | T. K. Dey, Y. S. Wang, Computational topology for data analysis, Cambridge: Cambridge University Press, 2022. https://doi.org/10.1017/9781009099950 |
| [13] |
H. Bando, S. Kaji, T. Yaguchi, Causal inference for empirical dynamical systems based on persistent homology, JSIAM Lett., 14 (2022), 69–72. https://doi.org/10.14495/jsiaml.14.69 doi: 10.14495/jsiaml.14.69
|
| [14] |
N. F. S. Zulkepli, M. S. M. Noorani, F. A. Razak, M. Ismail, M. A. Alias, Hybridization of hierarchical clustering with persistent homology in assessing haze episodes between air quality monitoring stations, J. Environ. Manage., 306 (2022), 114434. https://doi.org/10.1016/j.jenvman.2022.114434 doi: 10.1016/j.jenvman.2022.114434
|
| [15] |
S. Agami, Comparison of persistence diagrams, Commun. Stat.-Simul. C., 52 (2023), 1948–1961. https://doi.org/10.1080/03610918.2021.1894335 doi: 10.1080/03610918.2021.1894335
|
| [16] | B. Di Fabio, M. Ferri, Comparing persistence diagrams through complex vectors, In: Image analysis and processing-ICIAP 2015, Cham: Springer, 2015,294–305. https://doi.org/10.1007/978-3-319-23231-7_27 |
| [17] |
J. P. Wang, Y. H. Dong, Measurement of text similarity: A survey, Information, 11 (2020), 421. https://doi.org/10.3390/info11090421 doi: 10.3390/info11090421
|
| [18] | P.-N. Tan, M. Steinbach, V. Kumar, Introduction to data mining, 2 Eds., London: Pearson, 2019. |
| [19] | P. Bubenik, Statistical topological data analysis using persistence landscapes, J. Mach. Learn. Res., 16 (2015), 77–102. |
| [20] | P. Bubenik, The persistence landscape and some of its properties, In: Topological data analysis, Cham: Springer, 2020, 97–117. https://doi.org/10.1007/978-3-030-43408-3_4 |
| [21] |
S. M. S. S. Musa, M. S. Md Noorani, F. A. Razak, M. Ismail, M. A. Alias, S. I. Hussain, An early warning system for flood detection using critical slowing down, Int. J. Environ. Res. Public Health, 17 (2020), 6131. https://doi.org/10.3390/ijerph17176131 doi: 10.3390/ijerph17176131
|
| [22] |
S. M. S. S. Musa, M. S. Md Noorani, F. A. Razak, M. Ismail, M. A. Alias, S. I. Hussain, Using persistent homology as preprocessing of early warning signals for critical transition in flood, Sci. Rep., 11 (2021), 7234. https://doi.org/10.1038/s41598-021-86739-5 doi: 10.1038/s41598-021-86739-5
|
| [23] |
M. S. Ismail, M. S. Md Noorani, M. Ismail, F. A. Razak, M. A. Alias, Early warning signals of financial crises using persistent homology, Physica A, 586 (2022), 126459. https://doi.org/10.1016/j.physa.2021.126459 doi: 10.1016/j.physa.2021.126459
|
| [24] |
M. S. Ismail, M. S. Md Noorani, M. Ismail, F. A. Razak, Early warning signals of financial crises using persistent homology and critical slowing down: evidence from different correlation tests, Front. Appl. Math. Stat., 8 (2022), 940133. https://doi.org/10.3389/fams.2022.940133 doi: 10.3389/fams.2022.940133
|
| [25] |
M. E. Aktas, E. Akbas, A. El Fatmaoui, Persistence homology of networks: methods and applications, Appl. Netw. Sci., 4 (2019), 61. https://doi.org/10.1007/s41109-019-0179-3 doi: 10.1007/s41109-019-0179-3
|
| [26] |
N. Ravishanker, R. J. Chen, An introduction to persistent homology for time series, WIRES Comput. Stat., 13 (2021), e1548. https://doi.org/10.1002/wics.1548 doi: 10.1002/wics.1548
|
| [27] | A. Hatcher, Algebraic topology, Cambridge: Cambridge University Press, 2002. |
| [28] |
L. Betthauser, P. Bubenik, P. B. Edwards, Graded persistence diagrams and persistence landscapes, Discrete Comput. Geom., 67 (2022), 203–230. https://doi.org/10.1007/s00454-021-00316-1 doi: 10.1007/s00454-021-00316-1
|
| [29] | E. F. Beckenbach, R. Bellman, Inequalities, Berlin: Springer, 1961. https://doi.org/10.1007/978-3-642-64971-4 |
| [30] | G. Tauzin, U. Lupo, L. Tunstall, J. B. Pérez, M. Caorsi, A. Medina-Mardones, A. Dassatti, K. Hess, giotto-tda: A topological data analysis toolkit for machine learning and data exploration, J. Mach. Learn. Res., 22 (2021), 1–6. |
| [31] | F. Chazal, B. T. Fasy, F. Lecci, A. Rinaldo, L. Wasserman, Stochastic convergence of persistence landscapes and silhouettes, In: Proceedings of the thirtieth annual symposium on computational geometry, New York: Association for Computing Machinery, 2014,474–483. https://doi.org/10.1145/2582112.2582128 |
| [32] |
N. Atienza, R. Gonzalez-Díaz, M. Soriano-Trigueros, On the stability of persistent entropy and new summary functions for topological data analysis, Pattern Recogn., 107 (2020), 107509. https://doi.org/10.1016/j.patcog.2020.107509 doi: 10.1016/j.patcog.2020.107509
|
| [33] | J. Reininghaus, S. Huber, U. Bauer, R. Kwitt, A stable multi-scale kernel for topological machine learning, 2015 IEEE Conference on Computer Vision and Pattern Recognition (CVPR), Boston, USA, 2015, 4741–4748. https://doi.org/10.1109/CVPR.2015.7299106 |
| [34] | H. Adams, T. Emerson, M. Kirby, R. Neville, C. Peterson, P. Shipman, et al., Persistence images: A stable vector representation of persistent homology, J. Mach. Learn. Res., 18 (2017), 1–35. |
| [35] | K. C. Chan, U. Islambekov, A. Luchinsky, R. Sanders, A computationally efficient framework for vector representation of persistence diagrams, J. Mach. Learn. Res., 23 (2022), 1–33. |
| [36] |
Y.-M. Chung, S. Day, Topological fidelity and image thresholding: A persistent homology approach, J. Math. Imaging Vis., 60 (2018), 1167–1179. https://doi.org/10.1007/s10851-018-0802-4 doi: 10.1007/s10851-018-0802-4
|
| [37] |
Y.-M. Chung, A. Lawson, Persistence curves: A canonical framework for summarizing persistence diagrams, Adv. Comput. Math., 48 (2022), 6. https://doi.org/10.1007/s10444-021-09893-4 doi: 10.1007/s10444-021-09893-4
|
Figures(6) / Tables(6)

Azmeer Nordin, Mohd Salmi Md Noorani, Nurulkamal Masseran, Mohd Sabri Ismail, Nur Firyal Roslan. Cosine similarity and orthogonality of persistence diagrams[J]. AIMS Mathematics, 2025, 10(9): 21080-21103. doi: 10.3934/math.2025942


 DownLoad: