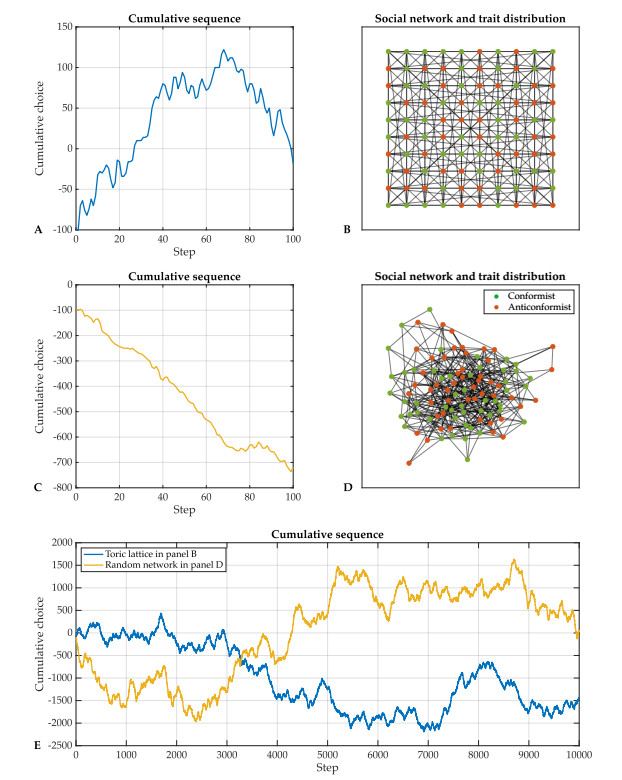
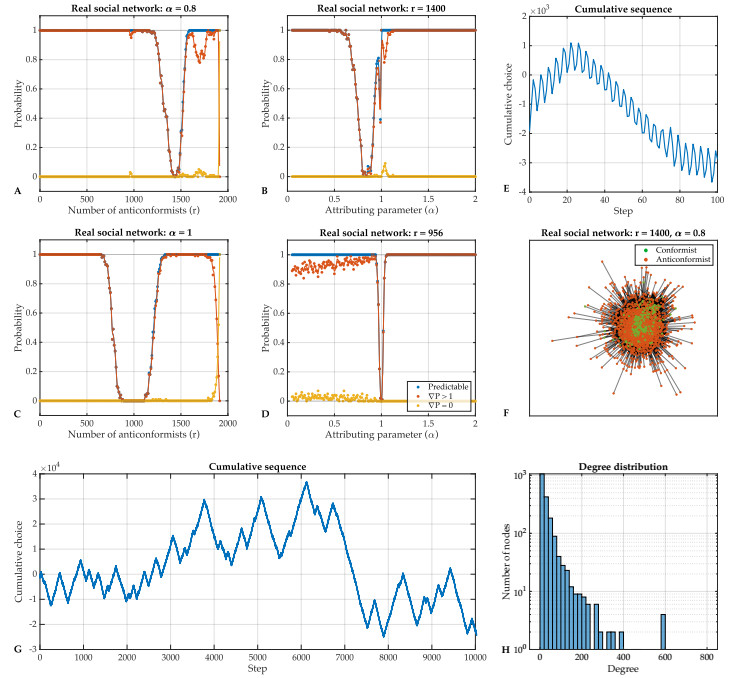
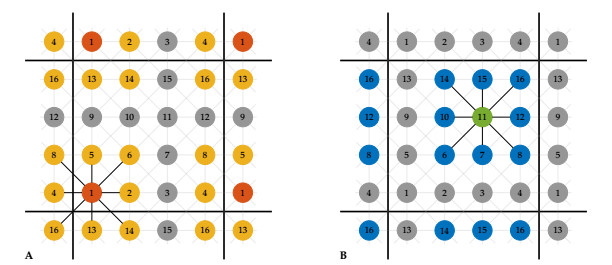
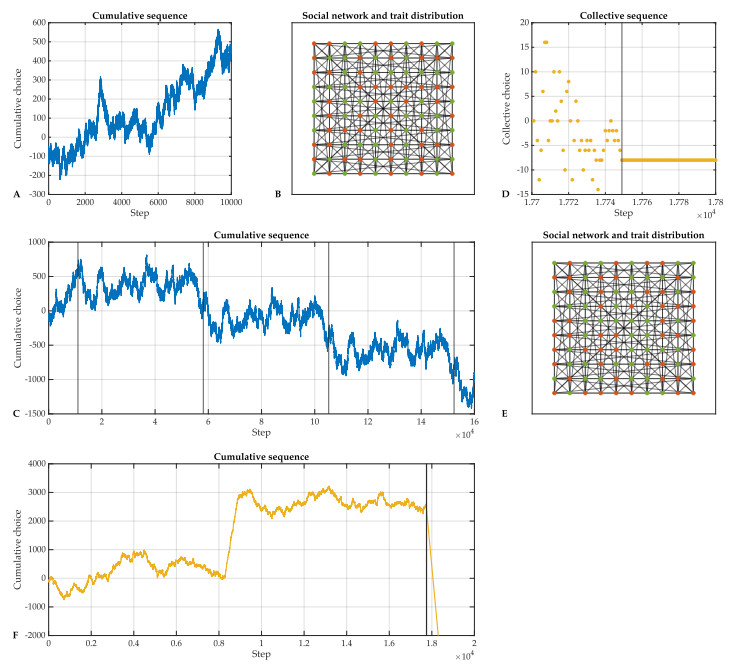
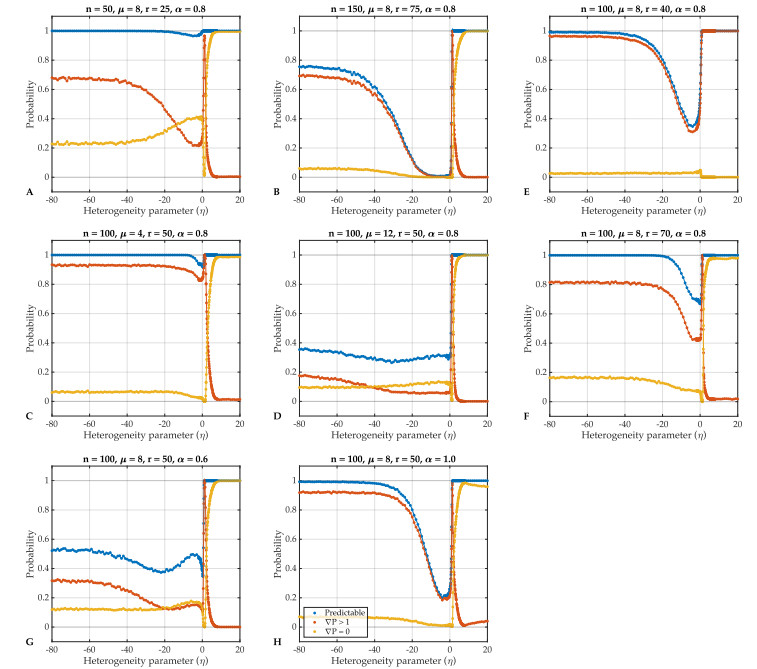
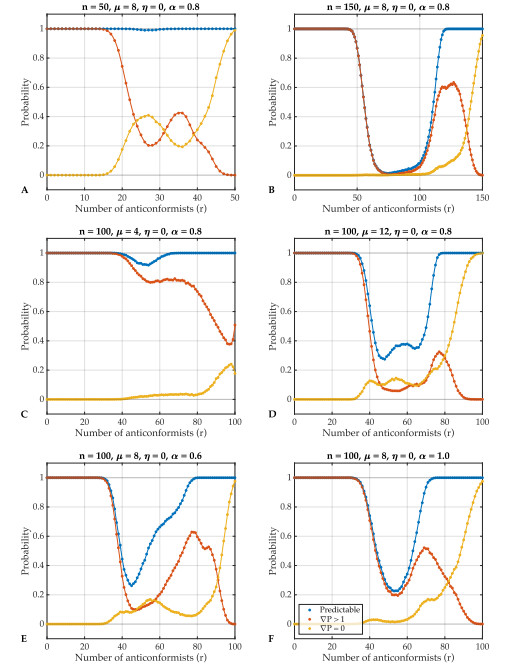
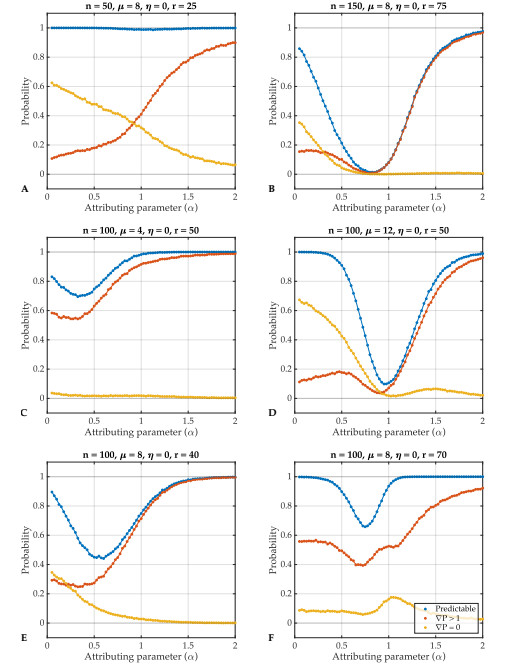
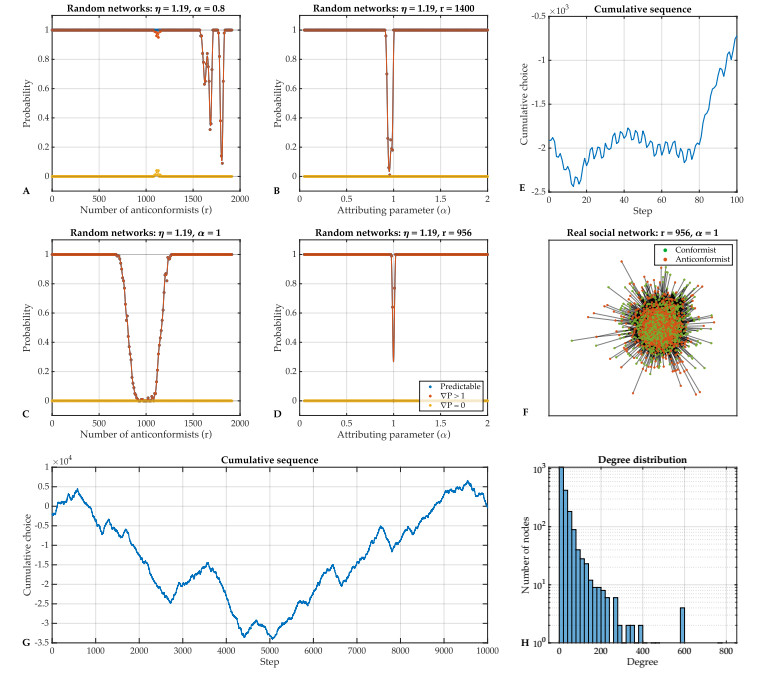
1.
Introduction
Studying the dynamics of individual-level social interactions and the collective outcomes has stimulated the development of various mathematical models in different fields. The discrete choice models explain and forecast an individual's choice from a set of alternatives [2], for example, which college to attend [9] and which vehicle to purchase [25]. The voter model [13] and its generalization [4] are simple stochastic processes describing opinion formation or decision making, which are also applicable to study phase transition in statistical physics and to model the dynamics of language death [1]. Evolution game theory provides a framework to study how individual-level interactions and behaviors evolve over time [7]. It is natural to define these models describing individual-level social interactions on networks. Recent research has shown that the network topology plays an important role in shaping the collective outcomes. For example, how network topology shapes the transmission of individuals' behavior [14,19], and how contact network topology shapes the transmission of infectious diseases [12,22].
Various generalizations of the models have also hinted at the importance of individuals' traits (e.g., physical and mental characteristics) in shaping the dynamics of social interactions and the collective outcomes. The discrete choice model has been generalized to include factors reflecting the inclination of an individual to conform to the choice of others [3] and interaction of individuals from different peer groups [6] for studying their effects on the collective outcomes. The voter model has been generalized to study the effects of conformity and anticonformity on polarization in opinion dynamics [15]. In social physics and social psychology, understanding opinion formation has stimulated models studying how individuals make decisions under pressures from others [16,20,24] and models analyzing how proportions of individuals with different traits affect the equilibrium behavior in interactive decision making [5,10]. Recent research also generalizes the evolution game theory models to study how individuals' lifespans shape the dynamics of social interaction [8,27].
Indeed, an individual in a community receives information when making a decision. The information includes suggestions, preferences and decisions of trusted individuals and indices, such as stock prices reflecting collective decisions of a community. Direct social interactions happen with the information from trusted individuals, and indirect social interactions occur with the information reflecting collective decisions. Individuals buying or selling stocks based on recommendations of trusted individuals is an example of direct social interaction. In contrast, people trading their shares determines stock prices, and individuals exchanging stocks based on the prices is an example of indirect social interaction. How an individual processes the received information and makes a decision depends on the individual's traits. For example, there are individuals choosing to listen to music recommended by their friends, and there also exist individuals who want to be distinctive and reject popular music, which is defined by collective choices of a community. However, this seemingly deterministic process is mainly modeled with randomness, for example, the voter model which includes selecting individuals at random.
In this work, we introduce a deterministic voter model with trait-attributed individuals, which, to the best of our knowledge, is new. This deterministic model allows us to study how the network topology and individuals' traits shape the dynamics of collective decision making without randomness. Specifically, we develop two stochastic processes to generate networks of individuals with two traits: Being a conformist and being an anticonformist. The individuals in a trait-attributed network make binary choices based on deterministic trait-dependent rules. The model is a discrete-time and produces time series called cumulative sequences, which reflect collective decisions of communities over time. The cumulative sequence can represent, for example, stock prices, the community's position on the left-right political spectrum or the popularity of mainstream music. A rigorous mathematical proof shows that based on the deterministic rules, every cumulative sequence eventually becomes periodic. We study the effects of network topology and trait distribution on the first passage time for a cumulative sequence showing periodicity. Lastly, we discuss the potential of this model being a framework for studying individuals with different traits in a social network directly and indirectly interacting in decision making.
2.
Materials and methods
2.1. Model assumptions and basic definitions
We consider a community of n individuals. We assume that each individual makes a sequence of choices from the binary state space Ω={−1,1} and that individuals' sequences of choices have the same length of t+1 steps. So, the model is discrete-time, and we use "sequence" and "time series" interchangeably. We use an integer 1≤i≤n to represent an individual in the community and denote the sequence of choices made by individual i as C(i,⋅)=[c(i,0),c(i,1),…,c(i,t)]. The element c(i,k) in the sequence, being either −1 or 1, is the choice of individual i at step k. The choices of all individuals in the community at step k also form a sequence C(⋅,k)=[c(1,k),c(2,k),…,c(n,k)], which we call the choice pattern of the community at step k. In particular, the choice pattern at step zero C(⋅,0) is the initial choices of the community. The time series of choice patterns C=[C(⋅,0),C(⋅,1),…,C(⋅,t)] is the community's sequence of choice patterns.
We say that two individuals in a community are related if they influence each other in decision making. We assume that influence in decision making is mutual, that there is no self influence and that influence is indifferent with the same strength. With respect to these assumptions, we model a community of individuals and how they are related in decision making by a social network N, which is undirected and without loops or multiple edges. Each node in a social network represents an individual, so we use "node" and "individual" interchangeably. An edge connecting two nodes in a social network indicates a pair of related individuals. Two related individuals are neighbors of each other on a social network.
Every individual in a community has a trait of either being a conformist or being an anticonformist in decision making. The trait affects how an individual makes choices. In a community of n individuals, the function f:{1,2,…,n}→{conformist, anticonformist} assigning a trait to each individual defines a trait distribution. We assume that every individual makes a choice simultaneously at every step and that an individual's choice at step k is determined by the choices of the individual's neighbors at step k−1. We list explicit rules for an individual to make a choice at each step in Table 1.
Note that the rules are deterministic. So, with a given social network representing how a community of individuals influence each other in decision making, the distribution of traits on the social network and the initial choices of the community, each individual's sequence of choices is determined. Consider a community of n individuals. The collective choice of the community at step k is the sum of choices over all individuals at step k and denoted by s(k)=∑nl=1c(l,k). The time series s=[s(0),s(1),s(2),…,s(t)] is the collective sequence of the community's choices. Analogously, the cumulative choice of the community at step k is the cumulative sum of choices over all individuals at step k and denoted by S(k)=∑kl=0s(l), and the time series S=[S(0),S(1),S(2),…,S(t)] is the cumulative sequence of the community's choices.
2.2. Toric lattices and random networks
We use two simple classes of network topologies as models for the influence relations of a community of individuals. We choose these simple network topologies because they allow better understanding of how individuals with different traits are distributed in the network.
The first class is lattices with no boundary. We use this class of network topologies for visualizing trait distributions. A toric lattice of size m is constructed, such that there exists a node at every integer coordinate (x,y) in the plane for integers 0≤x,y≤m−1 and no node at other coordinates, so the toric lattice has m2 nodes. Each node in a toric lattice is only related to the eight surrounding nodes, and to make the lattice boundaryless, the nodes on a boundary of a lattice are related to some nodes on the opposite boundary as in the example displayed in Supplementary Figure 1. See supplementary material for more detail.
The degree of a node in a network is the number of edges incident to it. We are interested in the mean value and the standard deviation of the degrees of nodes in a network, and we call the two quantities the mean degree and the degree deviation of the network, respectively. Without ambiguity, we denote the mean degree of a social network by μ and the network's degree deviation by σ. The mean degree of a social network, proportional to the network density [11], reflects the level of connectedness of individuals in a community, and the degree deviation of a social network is known to represent network heterogeneity [23].
We develop a generalized Erdös-Rényi model to generate random networks as another class of network topologies. The generalized Erdös-Rényi model can generate random networks with a certain number of nodes, a specific mean degree and a degree deviation regulated by a parameter. The model allows us to study the effects of network size (number of nodes), network density (mean degree) and network heterogeneity (degree deviation) on the collective and cumulative sequences of a community's choices with control. To generate a random network with n nodes and mean degree μ, we add nμ/2 edges successively to pairs of nodes in the network as follows. Let η be the heterogeneity parameter regulating the degree deviation of a network, and d(i) be the degree of the node representing individual i, which we call node i for short. To select the two end nodes of an edge to be added, we assign each node a weight which determines the probability of the node being selected. To select the first end node, we assign a weight w(i)=(1+d(i))η to node i when d(i)<n−1 and w(i)=0 to the node when d(i)≥n−1 to avoid multiple edges, then the probability of node i being selected as the first end node is p(i)=w(i)/∑nl=1w(l). Suppose that node i is selected as the first end node. To select the second end node, we assign node i a weight v(i)=0 to avoid loops and v(j)=0 to node j when node j is a neighbor of node i or d(j)≥n−1 to avoid multiple edges; otherwise, we assign node j a weight v(j)=(1+d(j))η. Similarly, the probability of node j being selected as the second end node is q(j)=v(j)/∑nl=1v(l).
Note that, when η=0, each possible edge of the network to be generated has the same probability to be added, so the model generates Erdös-Rényi random networks with n nodes and nμ/2 edges. When η<0, nodes with a high degree are less likely to be selected as an end node, so the generated networks are more regular with low degree deviation. When η>0, nodes with a high degree are more likely to be selected as an end node, so the generated networks are more centralized or star-like with high degree deviation. In Supplementary Figure 2, we show the relations between the heterogeneity parameter and degree deviations of generated random networks, as the heterogeneity parameter regulates the degree deviations of the generated networks.
2.3. Trait distribution
Let N be a social network representing a community of individuals and their relations in decision making. We attribute the traits of being a conformist and being an anticonformist to the nodes in N and call the resulting network a trait-attributed network or simply an attributed network denoted by N′. We characterize trait distributions with two quantities: the number of anticonformists r in a community and a parameter measuring the extent of mixing for individuals with different traits which is defined as the average number of conformist neighbors over all anticonformists. We call the second quantity of an attributed network the mixing parameter and denote it by χ.
We develop the following stochastic process to attribute traits to nodes of a social network so that the mixing parameter can vary in a wide range. Consider a network N with n nodes. To attribute r anticonformists and n−r conformists to the nodes of N, we initially attribute all nodes in N as conformists and then successively select r nodes to be anticonformists with an attributing parameter α regulating the mixing parameter χ. To select r anticonformists, we assign each node in the network weights, which determine the probability of the node being selected. To select the k-th anticonformist, we assign a weight u(i,k)=0 when node i is an anticonformist and a weight u(i,k)=αm if node i has m anticonformist neighbors, then the probability for node i to be selected as the k-th anticonformist is p(i,k)=u(i,k)/∑nl=1u(l,k).
Note that if the attributing parameter α=1, then the anticonformists are uniformly selected at random. If α>1, the anticonformists are clustered and the mixing parameter is low. For 0<α<1, the mixing parameter is high and the anticonformists are scattered. See Supplementary Figure 3 for examples of attributed toric lattices with scattered and clustered anticonformists. In Supplementary Figure 3, we also show the relations between the attributing parameter α and the mixing parameter χ, as both parameters concern the distribution of individuals with different traits in a network.
2.4. First passage time and predictability of cumulative sequences
In the supplementary material, we show that every collective sequence of choices eventually enters a unique period by a rigorous mathematical proof. Hence, every cumulative sequence eventually shows a unique repeated pattern. The eventual period and the repeated pattern are determined by the topology and the trait distribution of the attributed network and initial choices of the community.
Without ambiguity, we call both the unique period of the collective sequence and the repeated pattern of the corresponding cumulative sequence the eventual period of the sequences. We denote the eventual period of a cumulative sequence by P, and the length of an eventual period P is the number of steps that it spans, which is denoted by L(P). The change in the cumulative sequence over the period P is the period gain denoted by ΔP. More specifically, the period gain is the difference between the values of the cumulative sequence at the beginning step and the ending step of one complete eventual period. We define the gradient of the eventual period by ∇P=|ΔP|/L(P), which we use to describe the asymptotic behavior of cumulative sequences. We call the subsequence of a cumulative sequence before its first eventual period the pre-period subsequence and denote the pre-period subsequence by Q. The length of a pre-period subsequence Q, denoted by L(Q), is the number of steps that the subsequence Q spans. See supplementary material for examples and more detail about eventual periods and pre-period subsequences.
We study the first passage time for the cumulative (collective) sequence of a community's choices showing periodicity. Specifically, the first passage time F of a cumulative (collective) sequence is defined to be F=L(Q)+L(P)+τ. Here, τ indicates the small amount of time required to recognize the completion of the first eventual period. We study the probability for the first passage time being no greater than t+1 steps. We say that the cumulative (collective) sequence of a community's choices is predictable if its first passage time F≤t+1, otherwise the cumulative (collective) sequence is unpredictable. For experiments in this paper, we set t=10000 and τ=50 unless otherwise stated. To efficiently determine if a cumulative (collective) sequence is predictable without recording and comparing choice patterns, we develop a heuristic method. The heuristic method can determine predictability with an average accuracy over 99.4%. See supplementary material for more detail about the heuristic method and its accuracy.
In addition, we are interested in the following two classes of predictable cumulative sequences. We say that a predictable cumulative sequence is escalating if its eventual period has a gradient ∇P>1, and that a predictable cumulative sequence is oscillating if its eventual period has a gradient ∇P=0.
2.5. Summary of parameters and experiments
There are three factors regulating the deterministic process: The network topology, the trait distribution and the initial choices of a community of individuals. With the three factors pre-specified, the model generates a unique cumulative sequence of the community's choices. In Table 2, we summarize the parameters controlling the three factors and their values used in experiments for examining the effects of the three factors on the probability of cumulative sequences being predictable.
Each parameter has a default value in the experiments: n=100, μ=8, η=0, r=50%n, α=0.8 and initial choices being −1 for all individuals. In experiments analyzing the effects of the number of nodes, n takes 100 data points from 2 to 200 in increments of 2. In experiments studying the effects of the mean degree, μ takes 101 data points from 0 to 50 in increments of 0.5. In experiments examining the effects of the heterogeneity parameter, η takes 101 data points from −80 to 20 in increments of 1 and 101 data points from −2 to 8 in increments of 0.1. In experiments analyzing the effects of the number of anticonformists, r takes 101 data points from 0%n to 100%n in increments of 1%n and we round r to the smaller integer if r is not an integer. In experiments studying the effects of the attributing parameter, α takes 79 data points from 0.05 to 2 in increments of 0.025. For each data point in these experiments, we generate 10000 random networks with other parameters taking default values and compute the proportion of predictable cumulative sequences, which we call the probability of predictable sequences. Furthermore, we also compute the proportions of escalating (∇P>1) and oscillating (∇P=0) predictable cumulative sequences and call the proportions the probability of escalating sequences and the probability of oscillating sequences, respectively.
In experiments analyzing the effects of initial choices, we randomly generate initial choices, such that each individual has a probability of 0.5 to choose −1 or 1. We vary the network topology parameters and the trait distribution parameters independently in their ranges and use the data points for the parameters as described above. We generate 100 attributed random networks for each data point, and for each random network, we generate cumulative sequences with 100 random initial choices. For each attributed random network, we compute the proportion of initial choices that produce cumulative sequences with the same predictability as the majority of cumulative sequences produced by the 100 initial choices. We scale the ranges for each parameter listed in Table 2 to the same range of [0,1] linearly for comparison.
In addition, we use a Twitch user-user network of gamers who stream in Portuguese (PT) as a real social network topology for our study [17,21]. The network has 1912 nodes, with a mean degree of 32.74 and a degree deviation of 55.85. We attribute traits of being a conformist and being an anticonformist to the nodes of the real social network and study the effects of the trait distribution on the probability of cumulative sequences being predictable. In the experiments, the number of anticonformists takes 192 data points varying from 0%n to 100%n and the attributing parameter takes 192 data points varying from 0.05 to 2. For each data point, we generate 100 trait distributions and compute the proportion of predictable cumulative sequences as the probability of cumulative sequences being predictable.
3.
Results
3.1. Cumulative sequences
We study the cumulative sequence of a community's choices. The cumulative sequences can be considered as indices reflecting the changes of a community's collective decisions or opinions in a matter over time, for example, stock prices or a community moving left or right on the political spectrum.
We display the cumulative sequences of a trait-attributed toric lattice and a trait-attributed random network in Figure 1. We observe that the future movements of the cumulative sequences cannot be predicted with the subsequences from past steps, and the cumulative sequences resemble random walks. Specifically, the 10000-step long cumulative sequences in panel E of Figure 1 cannot be predicted from the 100-step long subsequences in panel A and panel C.
As discussed in Section 2.4, if we do not terminate the process, every cumulative sequence will enter its unique eventual period. So, a cumulative sequence consists of two parts: The pre-period subsequence which can have a length of zero and the eventual period. See Supplementary Figure 4 for an example of pre-periods subsequences and eventual periods. The observed unpredictable cumulative sequences in the first t=10000 steps can be part of the pre-period subsequence, part of the eventual period or a mixture of the pre-period subsequence and the beginning of the eventual period.
In the rest of the section, we focus on the first passage time for a cumulative sequence showing periodicity. We analyze the effects of network topology and the trait distribution on the first passage time. Specifically, we study the probability of a cumulative sequence being predictable in the first t=10000 steps of the process by simulations. Furthermore, we compute the probabilities of a predictable cumulative sequence being escalating and oscillating. Here, the escalating and oscillating predictable cumulative sequences can be interpreted if we consider the cumulative sequences as the changes of communities' positions on the left-right political spectrum. The escalating predictable cumulative sequences with ∇P>1 indicate the communities are fast extremizing, and the oscillating predictable cumulative sequences with ∇P=0 suggest the communities have constant internal conflicts without any movement. The unpredictable cumulative sequences, however, show movements without extremizing or constant internal conflicts. These can be observed more clearly with homogeneous attributed networks displayed in Supplementary Figure 5. See supplementary material for more detail.
Figure 1 shows the first 100 steps of the cumulative sequence of choices (panel A) of the community represented by the attributed toric lattice of size m=10 generated with r=50 and α=0.7 (panel B), and the first 100 steps of the cumulative sequence of choices (panel C) of the community represented by the attributed random network generated with n=100, μ=8, η=0, r=50 and α=0.9 (panel D). The first 10000 steps of the cumulative sequences (panel E) are displayed in panels A and C. The initial choices for both attributed networks are −1 for all individuals. To summarize, future movements of a cumulative sequence can not be predicted with subsequences from past steps. Loosely speaking, the process produces "chaotic" results.
3.2. The effects of network topology
The relation between the number of individuals in a community and the probability of predictable sequences displayed in panel A of Figure 2 shows that smaller communities have a higher probability of predictable sequences and that the probability decreases as the number of individuals increases. This suggests that smaller communities are more likely to extremize or internally conflict in collective decision making. Larger communities are less likely to extremize or internally conflict, even though all individuals are non-rational conformists and anticonformists and making no independent choices. Furthermore, smaller communities with more anticonformists are prone to internal conflicts, while smaller communities with more conformists are more likely to extremize; see Supplementary Figure 6.
The relation between the mean degree and the probability of predictable sequences displayed in panel B of Figure 2 indicates that the probability of predictable cumulative sequences is high for communities with either a low or a high mean degree (density), and is low for communities with a medium mean degree. According to the rules listed in Table 1, an individual who is not related to any other individual in decision making chooses the initial choice at every step. Communities with a low mean degree have many such isolated individuals, implying that they have one-step attractors and that the predictable cumulative sequences are more likely to be escalating. When the mean degree in the network is high, according to the mean field theory, the effect of all other individuals on one single node can be given by an average quantity, so that the cumulative sequence can soon enter its eventual period. Supplementary Figure 7 suggests that high-density communities with more anticonformists are prone to internal conflicts, while high-density communities with more conformists are more likely to extremize. Moreover, high-density communities with scattered anticonformists are more probable to internal conflict. These results suggest a possible explanation of more frequent conflicts and extremization as more individuals are being connected by various internet social media and influencing each other in decision making.
The heterogeneity parameter regulates the degree deviation of generated networks; see Supplementary Figure 2 for relations between the two quantities. When η=−80, the generated network is regular (every node in the network has the same degree and σ=0) with a near-one probability, and when η=8, the generated network is centralized or star-like; see panel E and F in Figure 2 for examples of regular and star-like networks. Regular networks have high probabilities of predictable sequences, which depends on other parameters; see panel C in Figure 2 and Supplementary Figure 8. Specifically, the probability of predictable sequences are relatively low for regular networks with more individuals (n=150), a higher density (μ=12) or more scattered anticonformists (α=0.6). Moreover, the predictable cumulative sequences are more likely to be escalating for regular networks unless more than 80% of the individuals are anticonformists; see panel C in Figure 3. Star-like networks have near-one probabilities of predictable sequences regardless of other parameters; see panel D in Figure 3 and Supplementary Figure 8. If a star-like network has more anticonformists, then the predictable cumulative sequences are escalating, and if a star-like network has more conformists, then the predictable cumulative sequences are oscillating; see panel E in Figure 3. These results indicate that communities of only non-rational conformists and anticonformists with star-like network topologies are prone to extremizing or internal conflicts in collective decision making, and the random networks generated with η slightly below zero having the lowest probabilities of predictable sequences. These results hint the benefit of network (e.g., internet) decentralization.
Figure 2 shows the relations between the probabilities of predictable, escalating and oscillating sequences and the number of individuals (nodes) n (panel A), the mean degree μ (panel B) and the heterogeneity parameter η from −80 to 20 (panel C) and from −2 to 8 (panel D); each data point is computed with 10000 random networks and their corresponding cumulative sequences with initial choices −1 for all individuals; smooth fitted curves are added for visualization. A regular random network generated with n=100, μ=8, η=−80, r=50 and α=0.8 is displayed in panel E. A star-like random network generated with n=100, μ=8, η=8, r=50 and α=0.8 is displayed in panel F. To summarize, small networks, networks with extreme mean degrees (density), regular and centralized networks are more likely to have predictable cumulative sequences.
Figure 3 shows the relations between the probabilities of predictable, escalating and oscillating sequences and the number of anticonformists r for networks with n=100, μ=8, η=0 and α=0.8 (panel A), regular networks with η=−80 (panel C) and star-like networks with η=8 (panel E), and the relations between the probabilities and the attributing parameter α for networks with n=100, μ=8, η=0 and r=50 (panel B), for regular networks with η=−80 (panel D) and star-like networks with η=8 (panel F). Each data point is computed with 10000 random networks and their corresponding cumulative sequences with initial choices −1 for all individuals. Smooth fitted curves are added for visualization. To summarize, the effects of trait distribution parameters on the cumulative sequences depend on network topologies, and networks with extreme number of anticonformists and networks with clustered conformists and anticonformists are more likely to have predictable cumulative sequences.
3.3. The effects of trait distribution
Figure 3 and Supplementary Figure 9 show that communities with fewer than 20% of the individuals being anticonformists have near-one probabilities of predictable sequences, and the cumulative sequences are escalating. Communities with more than 80% of the individuals being anticonformists also have near-one probabilities of predictable sequences, and in most of the settings, more predictable cumulative sequences are oscillating when more than 90% of the individuals are anticonformists.
The attributing parameter controls how conformists and anticonformists mix on a social network. The relations between the attributing parameter and the mixing parameter are displayed in Supplementary Figure 3, where panels A and B show examples of attributed networks with excessively scattered and clustered individuals with different traits. Figure 3 and Supplementary Figure 10 show that communities with excessively clustered or scattered conformists and anticonformists have high probabilities of predictable sequences, and the predictable cumulative sequences of communities with excessively clustered conformists and anticonformists are more likely to escalate than to oscillate in all studied parameter settings except when the network topology is star-like. Star-like networks have constant mixing parameters as the attributing parameters varies as displayed in panel E of Supplementary Figure 3, and the predictable cumulative sequences being oscillating for any attributing parameter displayed in panel F of Figure 3 is due to the number of anticonformists.
These results suggest that communities with even proportions of conformists and anticonformists are less likely to extremize or internally conflict. In addition to the proportions of individuals with different traits, how conformists and anticonformists are mixed in the social network and interact also plays an important role in determining the probability of escalating and oscillating sequences. If a community has even proportions of conformists and anticonformists, but they are excessively clustered, then the community is also prone to extremizing.
3.4. The effects of initial choices
Initial choices do not affect the predictability of cumulative sequences generated by an attributed network by much. Figure 4 shows the proportions of random initial choices that generate cumulative sequences with the same predictability as the majority of cumulative sequences produced by different initial choices on a trait-attributed network. Panel A in Figure 4 shows how the the proportions change with respect to the three network topology parameters, and panel B shows how the proportions change with respect to the two trait distribution parameters. On average, over 85% initial choices generate cumulative sequences that have the same predictability as the majority of cumulative sequences generate with an attributed network and different initial choices. However, the cumulative sequences are sensitive to initial choices. The cumulative sequences generated with different initial choices displayed in panels C and D of Figure 4 show different trajectories, though we can observe that the two sets of cumulative sequences have distinguishable characteristics determined by the trait-attributed networks.
Figure 4 shows the average proportions of initial choices that generate cumulative sequences of majority predictability for varying network topology parameters (panel A) and trait distribution parameters (panel B). Each data point represents the mean proportion of 100 random initial choices over 100 random networks, and the error bars show 95% confidence interval of the mean. Five cumulative sequences of the same predictability produced by five random initial choices are displayed in panel C. Three unpredictable and two predictable cumulative sequences produced by five random initial choices are displayed in panel D. Complete eventual periods are displayed between vertical lines, and pre-period subsequences are before the first vertical line. The two sets of cumulative sequences are produced by two attributed networks generated with n=100, μ=8, η=0, r=50 and α=1. To summarize, most of the cumulative sequences generated with the same trait-attributed network and different initial choices have the same predictability.
3.5. Real social network
For the real social network with n=1912 individuals, if we set the attributing parameter in its default value (α=0.8), then the probability of predictable sequences has the lowest value when the number of anticonformists is around r=1400; see panel A of Figure 5. This is different from random networks, where the probability of predictable sequences has the lowest value around r=50%n; see panel A of Figure 3. In Supplementary Figure 12, we show the relations between the trait distribution parameters and the probability of predictable sequences with Watts-Strogatz small-world networks [26] instead of the random networks. If the attributing parameter is set to be α=0.8, the probability of predictable sequences has the lowest value when r>50%n for Watts-Strogatz small-world networks; see panel D of Supplementary Figure 12. Here, the results for Watts-Strogatz small-world networks are more similar to the real social network, compared with random networks.
If we set the number of anticonformists to be at default value r=50%n, then the probability of predictable sequences has the lowest value when α=1, i.e., when the anticonformists are uniformly distributed in the network. See panels C and D of Figure 5. In both cases (r=1400 and r=50%n=956), the predictable cumulative sequences generated by the real social network are almost all escalating. We visualize an attributed network in the first case (r=1400) in panel F and its degree distribution in panel H of Figure 5. The cumulative sequence of the attributed network in the first case (r=1400) are displayed in panels E and G. With 1400 anticonformists, the community's unpredictable collective decisions are driven by small constant internal conflicts. See supplementary material for more detail.
Figure 5 shows the relations between the probability of predictable, escalating and oscillating sequences and the number of anticonformists r with α=0.8 (panel A), the attributing parameter α with r=1400 (panel B), the number of anticonformists r with α=1 (panel C) and the attributing parameter α with r=956 (panel D); each data point is computed with 100 attributions on the real social network with initial choices −1 for all individuals; smooth fitted curves are added for visualization. The trait-attributed real social network generated with r=1400 and α=0.8 is displayed in panel F, and its degree distribution is displayed in panel H. The first 100 steps and the first 10000 steps of the cumulative sequence of the attributed real social network is displayed in panel E and G, respectively.
4.
Conclusions
We have developed stochastic processes to generate networks of individuals with two different traits: Being a conformist and being an anticonformist. The stochastic processes have parameters that control the size, density and heterogeneity of the network topology and the number and distribution of anticonformists in the network. We have further introduced a deterministic voter model for the generated trait-attributed networks to model a community of individuals with different traits interactively making decisions. We have used the cumulative sequence to reflect the collective decisions made by the community over time. We have provided a rigorous mathematical proof to show that under the trait-dependent rules of the deterministic voter model (Table 1), every trait-attributed network and a set of initial choices generate a cumulative sequence that eventually becomes periodic. The future movements of a cumulative sequence that does not show periodicity can not be predicted by subsequences from past steps, while the future movements of cumulative sequence that shows periodicity is predictable. The predictable cumulative sequences either escalate to an extreme or are constantly oscillating, which can be interpreted as collective decisions of extremizing or internally conflicting communities. We have studied the effects of network topology and trait distribution on the first passage time for a cumulative sequence showing periodicity. Furthermore, we have analyzed the conditions for a predictable cumulative sequence to be escalating and oscillating. We have found that smaller communities, high-density communities, communities with centralized structures, communities with uneven proportions of individuals with different traits and communities with excessively clustered anticonformists and conformists are more likely to extremize or have internal conflicts.
The introduced deterministic voter model can also be considered as a cellular automaton on a graph as discussed in [18], where only the cells in our model have two different types (traits). Our model, being deterministic, allows us to study the factors that drive fluctuations in collective decision making without randomness. We have used simple network topologies so that we can better understand how trait distribution affect the dynamics of collective decision making. It is known that simple network topology limits the dynamics of collective decision making [14,19]. The fact that we observe unpredictable cumulative sequences with trait-attributed toric lattices shows the importance of individuals' traits in shaping the dynamics of collective decision making. To keep the model as simple as possible, we have made other unrealistic assumptions. Social influence should have directions and varied strength, and there would also be some self-influence in reality. We can introduce the traits of being an influencer and being a fan to the model. We have assumed that if there are equal numbers of neighbors who chose −1 and 1 in the previous step, the individual would keep the preceding choice. In reality, individuals with traits of being conservative incline to keep the preceding choice, while progressive individuals may want to try a different choice. We have only focused on direct social interactions and only used the information of neighbors' choices, but not indirect interactions with individuals making decisions with respect to the indices reflecting collective decisions of a community. For example, we can introduce individuals making decisions for utility maximization. People do not make decisions at the same time, and we have only used the information from the last step. In reality, individuals can make decisions based on history information. There could also be honest and dishonest individuals who would release false information to the neighbors. These possibilities show the potential of our model as a framework for analyzing how individuals of different traits directly and indirectly interact in decision making.
We used discrete-time models, which have limitations such as being incapable of capturing collective decision-making associated with a continuum of options. In addition, the values of parameters that we chose were limited. Networks mainly have 100 individuals, and the random network generator can not generate all possible networks. We defined the predictable cumulative sequences with ∇P>1 to be escalating, which can be adjusted for different standards. Cumulative sequences eventually show repeated patterns, but in reality, people move, connections form and break, and the network topology changes over time. Moreover, individuals change personalities over time and have different traits for different matters, and the trait distribution will not be unchanged either. Therefore, the cumulative sequence of a large ever-changing community can keep being unpredictable and never show repeated patterns.
Implementation
Code and data for simulations and analyses conducted in this paper are available at https://github.com/pliumath/social-interaction.
Acknowledgments
P. L. was partially supported by the National Science Foundation DMS/NIGMS award #2054347 to Prof. M. Vázquez and by UC Davis Open Access Fund. We would like to thank Jingzhou Na for helpful discussion and anonymous reviewers for constructive comments.
Conflict of interest
The authors declare no conflicts of interest.
Supplementary material
Toric lattices and random networks
The toric lattices are boundaryless. A node on a boundary of a lattice is related to some nodes on the opposite boundary. Specifically, for the toric lattice of size m, the node at (x,y) is related to the eight surrounding nodes: the eastern node at ((x+1) mod m,y), the northern node at (x,(y+1) mod m), the western node at ((x−1) mod m,y), the southern node at (x,(y−1) mod m), the northeastern node at ((x+1) mod m,(y+1) mod m), the northwestern node at ((x−1) mod m,(y+1) mod m), the southwestern node at ((x−1) mod m,(y−1) mod m) and the southeastern node at ((x+1) mod m,(y−1) mod m). See Supplementary Figure 1 for an example.
In Supplementary Figure 1, the 8 neighbors of individual 1 displayed in red are individuals 2, 4, 5, 6, 8, 13, 14, and 16 displayed in yellow (panel A). The 8 neighbors of individual 11 displayed in green are individuals 6, 7, 8, 10, 12, 14, 15, and 16 displayed in blue (panel B).
The model generating random networks has three parameters: The number of nodes n, the mean degree μ and the heterogeneity parameter η regulating the degree deviation σ. In Supplementary Figure 2, we show the relations between the heterogeneity parameter and the degree deviation. We generate random networks of 100 nodes with mean degree μ=4, μ=8 and μ=12 and η ranging from −100 to 100. Each data point in Supplementary Figure 2 represents the average degree deviation over 1000 random networks generated with corresponding parameters, and the variance for each data point is smaller than 0.1.
Supplementary Figure 2 shows the relations between average degree deviations of random networks of 100 nodes generated with mean degree μ=4, μ=8 and μ=12, and the heterogeneity parameter η ranging from −100 to 100 in increments of 2 (panel A), from −10 to 10 in increments of 0.2 (panel B), from −5 to 5 in increments of 0.1 (panel C) and from −2 to 2 in increments of 0.04 (panel D). Each data point represents the average degree deviation of 1000 random networks generated with corresponding parameters. The variance for each data point is smaller than 0.1.
Trait distribution
The process attributing traits to a network topology with the attributing parameter α, which regulates the mixing parameter χ, defined to be the average number of conformist neighbors over all anticonformists. Supplementary Figure 3 shows the relations between the attributing parameter and the mixing parameter of random networks. Panel A shows an attributed toric lattice of size 10 generated with half of the nodes being anticonformists (r=50) and the attributing parameter α=0.001. The attributed toric lattice has scattered anticonformists with the mixing parameter χ=5.52, which means, on average, an anticonformist has 5.52 conformist neighbors. Panel B shows an attributed toric lattice of size 10 generated with half of the nodes being anticonformists (r=50) and the attributing parameter α=10. The attributed toric lattice has clustered anticonformists with the mixing parameter χ=1.44. Panel C displays the relations between the attributing parameter and the mixing parameter for random networks generated with different numbers of individuals n=50, n=100 and n=150. Each data point represents an attributed random network generated with other parameters set to μ=8, η=0, r=50%n and the initial choices being −1 for all individuals. The relations are linear in general. For n=100, we have a fitted curve y=−1.13x+5.25 with R2=0.91; for n=50, we have a fitted curve y=−1.03x+5.19 with R2=0.84; for n=150, we have a fitted curve y=−1.16x+5.27 with R2=0.94. Panel D displays the relations between the attributing parameter and the mixing parameter for random networks generated with different mean degrees μ=4, μ=8 and μ=12. Each data point represents an attributed random network generated with other parameters set to n=100, η=0, r=50 and the initial choices being −1 for all individuals. For μ=8, we have a fitted curve y=−1.13x+5.25 with R2=0.91; for μ=4, we have a fitted curve y=−0.67x+2.75 with R2=0.88; for μ=12, we have a fitted curve y=−1.48x+7.64 with R2=0.92. Panel E displays the relations between the attributing parameter and the mixing parameter for random networks generated with different heterogeneity parameters η=−80, η=0 and η=8. Each data point represents an attributed random network generated with other parameters set to n=100, μ=8, r=50 and the initial choices being −1 for all individuals. For η=0, we have a fitted curve y=−1.13x+5.25 with R2=0.91; for η=−80, we have a fitted curve y=−1.33x+5.53 with R2=0.93; for η=8, we have a fitted curve y=−0.03x+4.12 with R2=0.17. Panel F displays the relations between the attributing parameter and the mixing parameter for random networks generated with different numbers of anticonformists r=30, r=50 and r=70. Each data point represents an attributed random network generated with other parameters set to n=100, μ=8, η=0 and the initial choices being −1 for all individuals. For r=50, we have a fitted curve y=−1.13x+5.25 with R2=0.91; for r=30, we have a fitted curve y=−0.89x+6.61 with R2=0.72; for r=70, we have a fitted curve y=−1.04x+3.55 with R2=0.94.
In Supplementary Figure 3, attributed toric lattices generated with scattered anticonformists and clustered anticonformists are displayed in panel A and B, respectively. The rest of the figure shows the relations between the attributing parameter and the mixing parameter of random networks generated with different numbers of individuals (panel C), different mean degrees (panel D), different heterogeneity parameters (panel E) and different number of anticonformists (panel F). Each data point represents a random network generated with corresponding parameters. For each set of parameters, 10000 random networks (data points) are generated. Grey data points represent random networks with predictable cumulative sequences, and colored data points represent random networks with unpredictable cumulative sequences. In particular, the purple data points represent the networks with unpredictable cumulative sequences that are determined to be predictable by the heuristic method.
First passage time and predictability of cumulative sequences
We argue that every collective sequence of choices eventually enters a unique period. For a community of n individuals, there are 2n unique choice patterns. Note that the deterministic process defined in Section 2.1 is memoryless in the sense that the choice pattern at step k only depends on the choice pattern at step k−1. Moreover, each choice pattern determines a unique succeeding choice pattern. If the deterministic process has more than 2n steps, then the sequence of choice patterns must have identical elements C(⋅,k)=C(⋅,l) due to the pigeon hole principle. Since the process is deterministic, identical subsequences of choice patterns follow C(⋅,k) and C(⋅,l), and periodicity appears in the sequence of choice patterns, hence in the collective sequence of the community's choices. Thus, given the network topology, the trait distribution and initial choices for a community of individuals, the collective sequence eventually enters a unique period determined by the three factors.
Recall that the length L(P) of the eventual period P and the length L(Q) of the pre-period subsequence Q of a cumulative sequence are defined to be the numbers of steps that P and Q span, respectively. The period gain ΔP of the eventual period is the change in cumulative sequence over the period P. The gradient of the eventual period is defined to be ∇P=|ΔP|/L(P). In Supplementary Figure 4, we show the eventual periods and the pre-period subsequences of cumulative sequences of choices of two communities. Panel A shows the first 10000 steps of the cumulative sequence of choices of the community represented by the attributed toric lattice displayed in panel B. The attributed toric lattice has size m=10, and the trait distribution is generated with r=50 and α=0.37. The initial choices of the community are −1 for all individuals. In panel A, the first 10000 steps of the cumulative sequence do not contain a complete eventual period, so the cumulative sequence is unpredictable. Actually, the pre-period subsequence Q displayed in panel C before the first vertical line has length L(Q)=11010. If we extend the length of the process to t=160000, we see three complete eventual periods of the cumulative sequence displayed in panel C. The eventual period P showed in panel C has length L(P)=47115, period gain ΔP=−474 and gradient ∇P=0.01. Similarly, The attributed toric lattice displayed in panel E has size m=10, and the trait distribution is generated with r=50 and α=0.7. The initial choices of the community are −1 for all individuals. Panel D and panel F show the pre-period subsequence Q of length L(Q)=17749, and the eventual period P has length L(P)=1, period gain ΔP=−8 and gradient ∇P=8.
In Supplementary Figure 4, the first three panels show the first 10000 steps of the cumulative sequence (panel A) of the attributed network generated with m=10, r=50 and α=0.37 (panel B) and the first 160000 steps of the cumulative sequence (panel C). The last three panels show the 100 steps of collective sequence (panel D) near the appearance of the first eventual period for the attributed network generated with m=10, r=50 and α=0.7 (panel E) and the first 20000 steps of the cumulative sequence (panel F). The complete eventual periods are displayed between vertical lines, and the pre-period subsequences are before the first vertical line in panels C and F. The green nodes represent conformists and the red nodes represent anticonformists in panels B and D.
To efficiently determine if a collective sequence s=[s(0),s(1),…,s(t)] is predictable without recording and comparing choice patterns, we develop the heuristic method as follows. We extract the subsequence s′=[s(t+1−τ),…,s(t−1),s(t)] consisting of the last τ elements in s and search for subsequences of s with τ consecutive elements that are identical to s′. If s′ is the only subsequence, then the heuristic method determines the collective sequence and the corresponding cumulative sequence to be unpredictable. If there are more than one subsequences in s that are identical to s′, then the heuristic method determines the collective sequence and the corresponding cumulative sequence to be predictable.
We argue that the heuristic method faithfully determines every predictable collective sequence. Let s be a predictable collective sequence and s′ be the subsequence of s consisting of the last τ elements. By definition, there exists at least one complete eventual period in the first t+1−τ steps of s. If there exists one eventual period in the first t+1−τ steps, then what follows must be in the eventual period. Hence, s′ must be in the eventual period, and there exists at least one subsequence in the first t+1−τ steps that is identical to s′. Therefore, the heuristic method faithfully determines s to be predictable. If s is unpredictable, that is, there exists no eventual period in the first t+1−τ steps, then there may still be subsequences in the first t+1−τ steps that are identical to s′. This is because different choice patterns may have the same sum of choices. So, the heuristic method may incorrectly determine s to be predictable and underestimate the probability of cumulative sequences being unpredictable.
In Supplementary Figure 3, we show the unpredictable collective sequences that are incorrectly determined by the heuristic method as predictable ones with purple data points. In panel C, there are 75 data points with incorrect predictability for n=100, 70 for n=50 and 65 for n=150. In panel D, there are 124 data points with incorrect predictability for μ=4 and 21 for μ=12. In panel E, there are 8 data points with incorrect predictability for η=−80 and 0 for η=8. In panel F, there are 136 data points with incorrect predictability for r=30 and 22 for r=70. On average, 0.58% of the unpredictable collective sequences are incorrectly determined to be predictable by the heuristic method.
Homogeneous attributed networks
Random networks of all conformists and toric lattices with homogeneously clustered conformists and anticonformists generate predictable cumulative sequences escalating to an extreme with ∇P>1. In contrast, random networks of all anticonformists and toric lattices with homogeneously mixed conformists and anticonformists generate predictable cumulative sequences oscillating with ∇P=0.
We can deduce the cumulative sequences for the four homogeneous attributed networks displayed in Supplementary Figure 5. The toric lattice of size m=10 displayed in panel B is attributed with r=50, and the conformists and anticonformists are homogeneously separated into two clusters. Each anticonformist in the interior of the cluster has 8 anticonformist neighbors, and each anticonformist on the boundary of the cluster has 5 anticonformist neighbors and 3 conformist neighbors. The cluster of conformists also have the same patterns. When the initial choices are −1 for all individuals, the two clusters cannot affect each other, so all anticonformists will change at every step, and all conformists will keep choosing −1 at every step. Therefore, the attributed network generates an escalating cumulative sequence displayed in panel A with ∇P=50, as the collective sequence consists of alternating 0 and −100. The toric lattice of size m=10 displayed in panel D is attributed with r=50, and the individuals with different traits are homogeneously mixed, such that every anticonformist has 6 conformist neighbors and 2 anticonformist neighbors, and symmetrically, every conformist has 6 anticonformist neighbors and 2 conformist neighbors. Suppose that the initial choices are −1 for all individuals. At step 1, the anticonformists will choose 1, and the conformists will keep −1; at step 2, the anticonformists will keep 1, and the conformists will choose 1; at step 3, the anticonformists will choose −1, and the conformists will keep 1; at step 4, the anticonformists will keep −1, and the conformists will choose −1, which is the same choice pattern as the initial choices. Thus, the attributed network generates an oscillating cumulative sequence displayed in panel C with ∇P=0. The connected random network displayed in panel F has 100 conformist individuals. When the initial choices are −1 for all individuals, all conformists will keep choosing −1 at every step, and the attributed network generates an escalating cumulative sequence displayed in panel E with ∇P=100. The connected random network displayed in panel H has 100 anticonformist individuals. When the initial choices are −1 for all individuals, all anticonformists will change their choices at every step, and the attributed network generates an oscillating cumulative sequence displayed in panel G with ∇P=0.
Supplementary Figure 5 shows the escalating cumulative sequence (panel A) of the toric lattice with homogeneously clustered conformists and anticonformists (panel B), the oscillating cumulative sequence (panel C) of the toric lattice with homogeneously mixed conformists and anticonformists (panel D), the escalating cumulative sequence (panel E) of the random network of all conformists (panel F), and the oscillating cumulative sequence (panel G) of the random network of all anticonformists (panel H). The initial choices for the four networks are −1 for all individuals.
Results in alternative settings
We investigate the effects of the three network topology parameters and the two trait distribution parameters on the probability of predictable, escalating and oscillating sequences in different settings. See Supplementary Figures 6–10. The number of individuals has a default value n=100. In investigating effects of the other four parameters, we set n=50 and n=150. The mean degree has a default value μ=8. In investigating effects of the other four parameters, we set μ=4 and μ=12. The heterogeneity parameter has a default value η=0. In investigating effects of the other four parameters, we set η=−80 and η=8. The number of anticonformists has a default value of r=50%n. In investigating effects of the other four parameters, we set r=40%n and r=70%n. The attributing parameter has a default value of α=0.8. In investigating effects of the other four parameters, we set α=0.6 and α=1.
We also generated random networks with parameters n=1912, μ=32.74 and η=1.19 that resembles the parameters of the real social network. We choose η=1.19, so that the generated random networks have degree deviation near σ=55.85. In Supplementary Figure 11, we display the relations and an attributed real social network with r=956 and α=1 and its cumulative sequence.
In addition, we analyze how the network topology parameters and the trait distribution parameters affect the cumulative sequences for Watts-Strogatz small-world networks. The Watts-Strogatz model has a parameter β regulating the topology of generated networks instead of the parameter η in our random graph model. We take values for the parameter β from the interval (0,1] and set the default value for β to be β=0.15. Supplementary Figure 12 shows the relations between the parameters and the probabilities of predictable, escalating and oscillating sequences. In panel A, the number of individuals n takes value in the interval [22,200] instead of [2,200] because Watts-Strogatz small-world networks with a small number of nodes can have loops. The results are in general similar to the random networks. With the parameter β set art β=0.15, we observe that probability of predictable sequences has the lowest value when r>50%n; see panel D of Supplementary Figure 12. This is different from the random network, whose probability of predictable sequences has the lowest value around r=50%n.
Supplementary Figure 6 shows the relations between the probability of predictable, escalating and oscillating sequences and the number of individuals n for random networks with μ=4 (panel A) and μ=12 (panel B), networks with η=−80 (panel C) and η=8 (panel D), networks with r=40 (panel E) and r=70 (panel F) and networks with α=0.6 (panel G) and α=1 (panel H). Each data point is computed with 10000 random networks and their corresponding cumulative sequences with initial choices −1 for all individuals. Smooth fitted curves are added for visualization.
Supplementary Figure 7 shows the relations between the probability of predictable, escalating and oscillating sequences and the mean degree μ for random networks with n=50 (panel A) and n=150 (panel B), networks with η=−80 (panel C) and η=8 (panel D), networks with r=40 (panel E) and r=70 (panel F) and networks with α=0.6 (panel G) and α=1 (panel H). Each data point is computed with 10000 random networks and their corresponding cumulative sequences with initial choices −1 for all individuals. Smooth fitted curves are added for visualization.
Supplementary Figure 8 shows the relations between the probability of predictable, escalating and oscillating sequences and the heterogeneity parameter η for random networks with n=50 (panel A) and n=150 (panel B), networks with μ=4 (panel C) and μ=12 (panel D), networks with r=40 (panel E) and r=70 (panel F) and networks with α=0.6 (panel G) and α=1 (panel H). Each data point is computed with 10000 random networks and their corresponding cumulative sequences with initial choices −1 for all individuals. Smooth fitted curves are added for visualization.
Supplementary Figure 9 shows the relations between the probability of predictable, escalating and oscillating sequences and the attributing parameter α for random networks with n=50 (panel A) and n=150 (panel B), networks with μ=4 (panel C) and μ=12 (panel D) and networks with r=40 (panel E) and r=70 (panel F). Each data point is computed with 10000 random networks and their corresponding cumulative sequences with initial choices −1 for all individuals. Smooth fitted curves are added for visualization.
Supplementary Figure 10 shows the relations between the probability of predictable, escalating and oscillating sequences and the number of anticonformists r for random networks with n=50 (panel A) and n=150 (panel B), networks with μ=4 (panel C) and μ=12 (panel D) and networks with α=0.6 (panel E) and α=1 (panel F). Each data point is computed with 10000 random networks and their corresponding cumulative sequences with initial choices −1 for all individuals. Smooth fitted curves are added for visualization.
Supplementary Figure 11 shows the relations between the probability of predictable, escalating and oscillating sequences and the number of anticonformists r with α=0.8 (panel A), the attributing parameter α with r=1400 (panel B), the number of anticonformists r with α=1 (panel C) and the attributing parameter α with r=956 (panel D) for random networks with η=1.19; each data point is computed with 100 attributions on the real social network with initial choices −1 for all individuals; smooth fitted curves are added for visualization. The trait-attributed real social network generated with r=50%n=956 and α=1 is displayed in panel F, and its degree distribution is displayed in panel H. The first 100 steps and the first 10000 steps of the cumulative sequence of the attributed real social network is displayed in panel E and G, respectively.
Supplementary Figure 12 shows the relations between the probabilities of predictable, escalating and oscillating sequences and the number of individuals (nodes) n (panel A), the mean degree μ (panel B), the Watts-Strogatz parameter β (panel C), the number of anticonformists r (panel C) and the attributing parameter α (panel E) with all other parameters set at default values; each data point is computed with 10000 Watts-Strogatz small-world networks and their corresponding cumulative sequences with initial choices −1 for all individuals; smooth fitted curves are added for visualization. A Watts-Strogatz small-world network generated with n=100, μ=8, β=0.15, r=50, and α=0.8 is displayed in panel F.