Citation: M. Weremeichik Jeremy. An Obstructed Cave Passage in the Cobleskill Plateau: A Gravimetric Study[J]. AIMS Geosciences, 2015, 1(1): 80-98. doi: 10.3934/geosci.2015.1.80
[1] | Zhu Junfeng, O’Dell Gary A., Laudermilk Ellis L., Bogosian Gregg, Currens James C., Webb Steven E., Bogosian Pam . Locating a Sealed Cave in Kentucky Using Electrical Resistivity Surveys. AIMS Geosciences, 2016, 3(1): 32-44. doi: 10.3934/geosci.2016.1.32 |
[2] | Ray Kenny . Stable isotope ratios and speleothem chronology from a high-elevation alpine cave, southern San Juan Mountains, Colorado (USA): Evidence for substantial deglaciation as early as 13.5 ka. AIMS Geosciences, 2019, 5(1): 41-65. doi: 10.3934/geosci.2019.1.41 |
[3] | Wu Yang, Ning Yu, Mingxing Yang, Jun Yan, Min Zhang, ShiQiang Yang . Sustainable development of geological resources: the Characteristics of Red Karst Landscape and Tourism Development in Tongren, Guizhou. AIMS Geosciences, 2024, 10(1): 141-171. doi: 10.3934/geosci.2024009 |
[4] | Nora Tilly, Daniel Kelterbaum . Investigating the Surface and Subsurface in Karstic Regions – Terrestrial Laser Scanning versus Low-Altitude Airborne Imaging and the Combination with Geophysical Prospecting. AIMS Geosciences, 2017, 3(3): 352-374. doi: 10.3934/geosci.2017.3.352 |
[5] | Christopher Talbot, Nico Augustin . Submarine Salt Karst Terrains. AIMS Geosciences, 2016, 2(2): 182-200. doi: 10.3934/geosci.2016.2.182 |
[6] | Qi Liu, Le He, Jing Zeng, Yetang Wang . Unprecedented occurrence of snow disasters over the Qinghai-Tibetan Plateau since 1980. AIMS Geosciences, 2021, 7(4): 574-581. doi: 10.3934/geosci.2021033 |
[7] | Eve-Agnès Fiorentino, Sheldon Warden, Maksim Bano, Pascal Sailhac, Thomas Perrier . One-off geophysical detection of chlorinated DNAPL during remediation of an industrial site: a case study. AIMS Geosciences, 2021, 7(1): 1-21. doi: 10.3934/geosci.2021001 |
[8] | Dell’Aversana Paolo, Bernasconi Giancarlo, Chiappa Fabio . A Global Integration Platform for Optimizing Cooperative Modeling and Simultaneous Joint Inversion of Multi-domain Geophysical Data. AIMS Geosciences, 2016, 2(1): 1-31. doi: 10.3934/geosci.2016.1.1 |
[9] | Shishay Kidanu, Aleksandra Varnavina, Neil Anderson, Evgeniy Torgashov . Pseudo-3D electrical resistivity tomography imaging of subsurface structure of a sinkhole—A case study in Greene County, Missouri. AIMS Geosciences, 2020, 6(1): 54-70. doi: 10.3934/geosci.2020005 |
[10] | Paolo Dell'Aversana . Reservoir geophysical monitoring supported by artificial general intelligence and Q-Learning for oil production optimization. AIMS Geosciences, 2024, 10(3): 641-661. doi: 10.3934/geosci.2024033 |
The purpose of this paper is to delineate the location of a cave passage which is suspected to connect the downstream Howe Caverns system to the upstream McFails Cave system. These two cave systems are located in the Cobleskill Plateau which is part of the greater Helderberg Plateau in upstate New York. The mapping of the passage which is suspected to connect the two cave systems must be performed from the land surface as the passage in question, at present, is not traversable by humans due to a blockage at both the upstream and downstream extent of the passage. The study utilized gravimetric surveys in order to locate the cave passage from the surface.
The karst features found in the vicinity of Cobleskill, New York include but are not limited to; caves, sink-holes, disappearing streams, springs, and artesian springs. Many published works exist which investigate different aspects of the caves located in the Cobleskill Plateau e.g. [1,2,3,4,5,6] and references therein. It is the purpose of this research to determine the location and existence of an abandoned trunk passage. Since this passage is not traversable at present from the upstream or downstream direction; mapping of the cave was conducted from the surface using gravimetric detection to model the subsurface. The abandoned trunk passage is suspected to exist within the Rondout Formation, the Manlius Formation, and the Coeymans Formation because the upstream and downstream continuation of the passage (i.e. McFails Cave and Howe Caverns, respectively) are constrained within these units. The major cave and karst-forming lithologies of the Helderberg Plateau are the Silurian-Devonian carbonates of the Helderberg Group (Figure 1).
The Southeast Passage of McFails Cave (Figure 2) and the West Passage of Howe Caverns (Figure 3) are potentially the upstream and downstream continuations of an abandoned trunk passage; obstructed on both sides by fill [7]. The Southeast Passage of McFails Cave sumps in clay choke at an approximate depth of 70 m below the surface. The West Passage of Howe Caverns is located 47.55 m below the surface and is also obstructed by a clay choke. It was demonstrated by Mylroie [3] how this larger system may have evolved and become segmented throughout geologic time. The exact age of the two caverns and the trunk passage is unknown. However, Lauritzen and Mylroie [8] suggest that the caves must, at least, predate the Wisconsinan glaciation due to the existence of glacially transported sediment within the caves and U/Th stalagmite dates from regional caves. The cave of interest which was sampled by Lauritzen and Mylroie [8] examined Barrack Zourie Cave, one of the various caves within the Cobleskill Plateau, and determined four dates from analyzing speleothems. The ages from the samples cluster around 161-158 ka, except for one, a suspected overgrowth that was dated 61 ka [8]. It is feasible that the age of the speleothems found for Barrack Zourie Cave may be similar to the caves under investigation in this study—see Dumont [4] for more detail regarding Barrack Zourie Cave. The aforementioned cave and the two of interest in this study formed within the same stratigraphic units, which strengthens the possibility that geological processes which were acting upon Barrack Zourie Cave could also have been acting upon McFails Cave and Howe Caverns. It has been proposed by Rubin [9] that caves developed progressively from east to west within the Cobleskill Plateau; therefore, it is possible that the three caves are similar in age. For more detail regarding the sample locations and methods of U/Th dating see Lauritzen and Mylroie [8].
Prior to multiple advance and retreat phases of the Pleistocene glaciers, this larger system would most likely have been traversable throughout its entirety. The concept that the two aforementioned caves could have once been, and may still be, connected was formally proposed by Palmer [2]. The possibility of a passage connecting McFails Cave and Howe Caverns has also been mentioned in multiple publications by other researchers working in the area e.g. [2,3,4,7,9,10,11,12] (Figure 4). It is believed that the abandoned trunk passage would most likely be classified as a strike-orientedpassage. This inference is supported by Palmer et al. [7] p. 158; “this passage appears to have once been the downstream continuation of the strike-oriented passage in McFails Cave, whose terminus now lies about 3 km to the northwest.” In Rubin [9] p. 973, Howe Caverns was described as “…a beheaded relict portion of McFails NW-SE passage…” Dye tracing has confirmed that water flows downstream through the abandon strike-oriented trunk passage, once believed to be connected to the southeast passage of McFails Cave, before resurfacing as the River Styx in Howe Caverns [7].
Topographic map is from USGS [25]. A-A′ represents the endpoints of the Barnerville Road gravity traverse, while B-B′ represents the endpoints of the Myers Road gravity traverse. Arrows with broken lines are an approximate representation of the abandoned trunk passage which is thought to connect McFails Cave and Howe Caverns.
It has been proposed that in some areas of the Schoharie Valley region, an excess of 30 m of glacial till lies between the bedrock surface and the ground surface [7]. According to Palmer et al. [7] the 30 m between the bedrock and ground surface is thought to be comprised of material such as glacial till, glacial lake deposits [5], and drumlins. The known depths to which the soils described below persist in the region is approximately 1.5 m but it is possible that they could extend to roughly 2 m below the ground surface [13,14].
The nature of the material deposited during the deglaciation of the region consists of thin sand, sand and gravel deposits, or thicker gravel units that have a large content of silt and fine sand [15]. While the descriptions provided by Bugliosi et al. [15] are informative, the Web Soil Survey [14] provides more detailed soil surveys for the Cobleskill region. Upon using the Web Soil Survey’s AOI Interactive Map it was determined that the soils in existence beneath the two gravity survey traverses (i.e. A-A' and B-B') are comprised of Mohawk and Honeoye silt loam and Mohawk and Lima silt loam, respectively [14]. Descriptions of the parent material from which the three soils are derived and glacial features which the soils are commonly associated with are as follows:
(1) [The parent material from which the Mohawk soils are derived is a] loamy till that is generally calcareous, derived mainly from soft shale. [The Mohawk is commonly associated with] drumlinoid ridges, till plains, and hills. (2) [The parent material which the Honeoye soils are derived is a] loamy till derived from limestone, dolomite, and calcareous shale, and from a lesser amounts of sandstone and siltstone. [The Honeoye is commonly associated with] drumlins and till plains. (3) [The parent material which the Lima soils are derived is a] loamy till derived mainly from limestones and calcareous shale. [The Lima is commonly associated with] drumlins and till plains. [14]
Over the course of this study, the field techniques necessary to explore the abandoned trunk passage changed considerably. The problem in its simplest form was; “how do you see something underground without going underground?” The gravity method was implemented after some preliminary work using GPR was unsuccessful. The lack of success using GPR may have been in-part due to the abundance of clay in the soils and glacial tills of the study area. Though, in most rocks and soils the maximum depth of penetration for GPR methods is on the order of 15-30 m. The depth of the passage of interest in Howe Caverns is 47.55 m and the depth of the passage in McFails Cave is approximately 70 m. Both passages reside at depths greater than the detection capability of GPR method. Therefore, use of a Worden Gravity Meter, also known as a gravimeter, from the State University of New York at Oneonta, was then employed to identify the cave passage. The model of Worden Gravity Meter used in this study was a prospector (standard) model with an accuracy of 0.01 milligal with a repeatability between 0.03 and 0.07 milligal [16,17]. As mentioned by Whitelaw et al. [18] the choice to use such a gravimeter, given its lack of accuracy when compared to that of newer gravimeters, may be questioned for use with detailed gravity surveys. To avoid such uncertainties, interpretations of the gravity data were only considered for anomalies greater than 0.1 milligal.
The locations of the two gravity surveys, A-A' and B-B', are presented in Figure 4. The A-A' traverse included 19 stations which extends for a distance of 108 m parallel to Barnerville Road. Figure 5 shows the topography along the Barnerville Road (A-A′) traverse.
The B-B' traverse contained 16 stations which covers a horizontal distance of 90 m parallel to Myers Road. Figure 6 shows the topography along the Myers Road (B-B′) traverse.
Every station included in this research was spaced 6 m apart. A 6 m spacing was utilized to provide optimal coverage of the area; as the average width of the passage in question is approximately 3 to 6 m. The time required to collect the gravity readings was different for each traverse. For the Barnerville Road (A-A′) traverse, the total time needed to collect the data spanned 202 minutes. For the Myers Road (B-B′) traverse, the total time needed to collect the data was 157 minutes.
As mentioned in Crawford et al. [19], microgravity surveys are typically conducted by measuring the gravity at stations which are arranged in a grid pattern. A traverse pattern was opted for in this study as it reduces the time necessary to complete surveys and it has been demonstrated by Crawford et al. [20] as being an effective technique for the assessment of linear subsurface features in karst terrain. The aforementioned locations were chosen to conduct the traverses as they were easily accessible and believed to cross the passage under investigation based on geomorphological analysis of the local topography conducted by the author. Works such as: Mylroie [3], Milunich and Palmer [21], Palmer et al. [7]…etc., aided in the analysis of the geomorphological conditions. The position of each gravity station was surveyed using a theodolite transit, stadia rod, distance measuring wheel, and a Garmin Rino 110 GPS navigator.
It is important to note that gravimeter readings vary with time. Variance in the readings is known as drift which was found for each survey by having multiple base station readings recorded at different times during the survey process [19]. Base station measurements were recorded once for every two or three intermediary station readings recorded to determine the change in gravity with time (i.e. drift). Aside from the corrections for drift (including tidal corrections), each of the gravity readings recorded were also corrected for the latitude between each of the stations in a single traverse, the elevation difference between stations (i.e. free-air effect), and the presence of additional mass beneath higher elevations using a rock density of 2.37 g/cm3 (i.e. Bouguer effect) [21].
All gravity corrections and reductions of data are shown in Tables 1 and 2.
Stations from South to North | Elevation from Base Station | Distance from Base Station | Drift Corrected Readings | Latitude Correction | Free-air Correction | Bouguer Correction | Final Gravity |
(cm) | (m) | (mGal)* | (mGal) | (mGal) | (mGal) | (mGal) | |
Station 18 | 30.20 | -36 | 173.59 | -0.03 | -0.09 | 0.03 | 173.68 |
Station 17 | 30.32 | -30 | 173.50 | -0.02 | -0.09 | 0.03 | 173.58 |
Station 16 | 30.14 | -24 | 173.03 | -0.02 | -0.09 | 0.03 | 173.11 |
Station 15 | 29.69 | -18 | 172.91 | -0.02 | -0.09 | 0.03 | 172.98 |
Station 14 | 29.49 | -12 | 172.53 | -0.01 | -0.09 | 0.03 | 172.59 |
Station 13 | 29.63 | -6 | 172.35 | -0.01 | -0.09 | 0.03 | 172.41 |
Base Station | 0 | 0 | 170.77 | 0.00 | 0.00 | 0.00 | 170.77 |
Station 1 | 28.98 | 6 | 170.62 | 0.01 | -0.09 | 0.03 | 170.67 |
Station 2 | 28.58 | 12 | 170.32 | 0.01 | -0.09 | 0.03 | 170.36 |
Station 3 | 28.42 | 18 | 170.51 | 0.01 | -0.09 | 0.03 | 170.56 |
Station 4 | 28.25 | 24 | 170.78 | 0.02 | -0.09 | 0.03 | 170.81 |
Station 5 | 28.13 | 30 | 170.73 | 0.03 | -0.09 | 0.03 | 170.76 |
Station 6 | 28.25 | 36 | 170.71 | 0.03 | -0.09 | 0.03 | 170.74 |
Station 7 | 28.43 | 42 | 170.68 | 0.03 | -0.09 | 0.03 | 170.70 |
Station 8 | 28.50 | 48 | 170.68 | 0.04 | -0.09 | 0.03 | 170.69 |
Station 9 | 28.91 | 54 | 171.16 | 0.04 | -0.09 | 0.03 | 171.17 |
Station 10 | 29.55 | 60 | 171.25 | 0.05 | -0.09 | 0.03 | 171.27 |
Station 11 | 30.53 | 66 | 171.29 | 0.05 | -0.09 | 0.03 | 171.30 |
Station 12 | 31.58 | 72 | 171.74 | 0.06 | -0.10 | 0.04 | 171.74 |
s.e.† | - | - | 0.25 | 0.01 | 0.00 | 0.00 | 0.26 |
* Raw gravity readings were measured using a Worden Gravimeter with an accuracy of 0.01 mGal | |||||||
† s.e. = the standard error to one standard deviation |
Stations from South to North | Elevation from Base Station | Distance from Base Station | Drift Corrected Readings | Latitude Correction | Free-air Correction | Bouguer Correction | Final Gravity |
(cm) | (m) | (mGal)* | (mGal) | (mGal) | (mGal) | (mGal) | |
Base Station | 0 | 0 | 165.38 | 0 | 0 | 0.00 | 165.38 |
Station 1 | 9.14 | 6 | 165.14 | 0.00 | -0.03 | 0.01 | 165.16 |
Station 2 | 29.69 | 12 | 165.31 | 0.00 | -0.09 | 0.03 | 165.37 |
Station 3 | 51.82 | 18 | 165.17 | 0.00 | -0.16 | 0.06 | 165.27 |
Station 4 | 83.73 | 24 | 164.97 | 0.00 | -0.26 | 0.09 | 165.13 |
Station 5 | 103.72 | 30 | 164.74 | 0.00 | -0.32 | 0.12 | 164.94 |
Station 6 | 108.91 | 36 | 164.74 | 0.01 | -0.34 | 0.12 | 164.95 |
Station 7 | 115.85 | 42 | 164.80 | 0.01 | -0.36 | 0.13 | 165.02 |
Station 8 | 135.45 | 48 | 164.84 | 0.01 | -0.42 | 0.15 | 165.09 |
Station 9 | 152.25 | 54 | 164.65 | 0.02 | -0.47 | 0.17 | 164.93 |
Station 10 | 160.57 | 60 | 164.70 | 0.01 | -0.50 | 0.18 | 165.00 |
Station 11 | 163.53 | 66 | 164.29 | 0.02 | -0.50 | 0.19 | 164.59 |
Station 12 | 169.29 | 72 | 164.07 | 0.02 | -0.52 | 0.19 | 164.39 |
Station 13 | 188.76 | 78 | 163.87 | 0.02 | -0.58 | 0.21 | 164.22 |
Station 14§ | 212.48 | 84 | 171.17 | 0.02 | -0.66 | 0.24 | 171.11 |
Station 15 | 226.98 | 90 | 163.89 | 0.02 | -0.70 | 0.26 | 164.31 |
s.e.† | - | - | 0.42 | 0.00 | 0.05 | 0.02 | 0.40 |
* Raw gravity readings were measured using a Worden Gravimeter with an accuracy of 0.01 mGal | |||||||
† s.e. = the standard error to one standard deviation | |||||||
§ Suspected erroneous reading |
The precise depth to bedrock at the base stations is not known but was instead estimated based on the available geological information of the study area. The relationship Δg = gstation - gbase station, was used to determine the change in gravity or relative gravity (Δg) between the base station (gbase station) and an intermediary station (gstation). The relative gravity was then plotted against the overall survey length in meters to create two relative gravity profiles (Figures 7 & 8). The profiles demonstrate that negative residual anomalies do exist beneath the traverse locations.
Station is abbreviated to STA followed by the corresponding station number and BASE refers to the location of the base station.
Station is abbreviated to STA followed by the corresponding station number and BASE refers to the location of the base station. Station 14 (STA 14) was not plotted on the graph as it is a suspiciously high value resulting from a possibly erroneous initial reading prior to the application of the various corrections, (i.e. drift, free-air, latitude, and Bouguer), as seen in Table 2.
It is important to note that limitations of the timeframe and budget of this study prevented the collection of repeat readings at each station. Ideally, the location of a base station is situated on exposed bedrock or the known depth-to-bedrock at that particular location. In this case since the depth to bedrock is unknown, the location of the base station was not arbitrary, rather it was simply the first station where gravity data was collected in the traverse.
Corrections for terrain were conducted for this study using the Hammer method [22], but were found to be negligible as the path of the traverses does not encounter much variation of vertical relief. The maximum change in vertical relief for either of the two traverses was 2.27 m. In addition, only gravity fluctuations greater than 0.1 milligals were considered as potential anomalies for this study; the level of specificity provided by the terrain correction is not necessary as it greatly exceeds the threshold precision needed. To corroborate the above statement, Crawford et al. [19] p. 203, points out that “terrain corrections of the microgravity data are usually not necessary in order to measure relative differences in gravity when measuring along a short traverse.” Additionally, Leaman [23] p. 467, states “the terrain correction has normally been ignored in low relief terrain since the error in doing so has usually been much less than that related to errors in elevation accuracy.” It is then explained that within gravity survey databases a prominent source of error lies in the terrain correction, when it is implemented [23].
As stated in the results, the true depth to bedrock was not determined due to an absence of reliable data for depth to bedrock based on drill reports for water wells, nor was there exposed bedrock in the study area. Though there have been other geophysical surveys conducted in the area, e.g. Milunich and Palmer [21], the information provided by those studies is of no use to the current investigation due to the highly variable thickness of glacial till. This variability makes it difficult to estimate the depth to bedrock at any particular location when using geophysical data which was collected at sites that are not in the immediate vicinity of the current study locations.
Based on the author’s knowledge of outcrops in the vicinity of where geophysical data was collected, the estimated depth to bedrock at the base station in traverse A-A′ would be approximately 15 m. The depth to bedrock beneath the base station in traverse B-B’ is more difficult to estimate as there are no known outcrops within a kilometer of the site, though would most likely lie between 23 and 35 m below the surface. The fill thickness for each intermediary station (Δzi) was determined as follows:
Δzi=Δg/[2πGΔρ]/1000, |
where Δzi is the fill thickness at an intermediary station (cm), Δg is the relative gravity (mGals), G is the gravitational constant (6.67*10 - 8cgsunits), and Δρ is the density contrast between overburden and bedrock (g/cm3). The density contrast between the overburden and bedrock was determined to be 0.66 g/cm3. Using the estimated depth to bedrock for the base station, Δzi is added to that value resulting in the thickness of fill or depth to bedrock of an intermediary station. This process was repeated for each intermediary station, so that a bedrock profile could be drawn for each traverse (Figures 9 & 10). For Figure 10 the median of the estimated fill thickness at the base station was used (i.e. 29 m of fill beneath the base station).
The blue dots on the black and orange lines represent the locations at which gravity measurements were taken. The area contained within the black and orange lines represent the amount of fill beneath the traverse. The orange line represents the bedrock profile at depth. Though the surface profile (horizontal black line) appears to be nearly flat note the difference in the vertical scale from Figures 7 & 8.
The reason for why there are multiple voids shown in the figure is because the model predicts that a void could be located at any of the three locations depicted. The blue dots on the black and orange lines represent the locations at which gravity measurements were taken. The area contained within the black and orange lines represent the amount of fill beneath the traverse. The orange line represents the bedrock profile at depth. Though the surface profile (horizontal black line) appears to be nearly flat note the difference in the vertical scale from Figures 7 & 8.
Negative residual anomalies observed within the generated profiles were interpreted to be caves or phreatic conduits within the bedrock based on the documented existence of karst structures in the region. The broad features seen in Figures 7 and 8 have been interpreted to be solid bedrock, while sharp variations in the residual gravity, usually consisting of readings from one or two stations, are interpreted to be caves. To offer an alternative interpretation of the observed gravity anomalies, it is also possible that the gravity profiles from this study solely reflect the bedrock surface or thickening of fill in a pre-glacial valley. The gravity profiles in Figures 7 and 8 show the potential for anomalies (e.g. cave passages) to exist beneath STA 2 in traverse (A-Aʹ) and beneath STA 1, STA 5 and 6, and STA 13 in traverse (B-Bʹ).
This study is meant to serve as a reconnaissance study which reflect two gravity surveys conducted over a limited traverse whose locations were selected to provide optimal coverage of the potential subsurface conduit. Thus, the interpretations herein of the data presented in this study needs to be considered with caution as the anomalies may be associated with other karst features such as collapsed passages or sediment-infilled solutionally-widened fractures/joints. The findings from this research and the information contained within may serve as a guide to future work in determining more detailed information about the abandoned trunk passage between McFails Cave and Howe Caverns.
This research provides analogue models of the subsurface karst structures in the Cobleskill area. This study was conducted to determine if gravimetric surveys could find the location of suspected cave passages within the Cobleskill Plateau and to provide a reconnaissance baseline to guide further research. The results demonstrate one possible explanation—and allow for a deeper understanding—of how past hydrologic flow patterns were controlled by cave passage morphology beneath the surface of the Cobleskill Plateau. Moreover, they provide greater detail as to the potential of land which could be underlain by karst and glacial features and identify areas which may be subject to future geologic hazards. The models of bedrock profiles presented in Figures 9 and 10 are open to interpretation. The findings presented by this paper attempt to address the issue of doubt as to whether McFails Cave and Howe Caverns are one continuous phreatic system and serves to supplement previous research on the matter e.g. [2,3,4,7,9,10,11,12]. The existence of subsurface cave passages were supported in this research through the detection of void spaces beneath Barnerville Road (A-Aʹ) and the Myers Road (B-Bʹ) traverses. Additional research needs to be conducted to pinpoint the location of the connector cave beneath the surface and to determine the height and width of the passage throughout the area between McFails Cave and Howe Caverns.
Without the guidance and support of numerous individuals including previous mentors, this research could not have come to fruition. Art Palmer, who provided invaluable instruction, encouragement throughout the editing process, and insight into the use of gravimetry and the nature of the local karst and groundwater of the Cobleskill Plateau. Eric Johnson, who advised the author throughout the entire project and aided in the reduction of the gravity data. Finally, I would like to thank Kristen Stives for her assistance in the field and patience during the editing process.
All authors declare no conflicts of interest in this paper.
Figure 1. Stratigraphy of the Helderberg Plateau. Based on data from [1,3,7,26,27,28,29,30].
Figure 2. Map of McFail’s Cave from Palmer [24]. Red box highlights area of interest.
Figure 3. Map of Howe Caverns from Mylroie [3]. Red box highlights area of interest.
Figure 4. Map showing the location of the Southeast Passage of McFails Cave and the Northwest Passage of Howe Caverns in relation to surface topography of the Cobleskill area and the location of gravity surveys conducted in this study. Topographic map is from USGS [25]. A-A′ represents the endpoints of the Barnerville Road gravity traverse, while B-B′ represents the endpoints of the Myers Road gravity traverse. Arrows with broken lines represent and approximate representation of the abandoned trunk passage which is thought to connect McFails Cave and Howe Caverns.
Figure 5. Photograph showing the topography of the Barnerville Road (A-A′) traverse.
Figure 6. Photograph showing the topography of the Myers Road (B-B′) traverse.
Figure 7. Graph showing the residual gravity anomalies and elevation change in centimeters (topographic profile) plotted against the distance of the overall survey length for the Barnerville Road (A-Aʹ) traverse. Station is abbreviated to STA followed by the corresponding station number and BASE refers to the location of the base station.
Figure 8. Graph showing the residual gravity anomalies and elevation change in centimeters (topographic profile) plotted against the distance of the overall survey length for the Myers Road (B-Bʹ) traverse. Station is abbreviated to STA followed by the corresponding station number and BASE refers to the location of the base station. Station 14 (STA 14) was not plotted on the graph as it is a suspiciously high value resulting from a possibly erroneous initial reading prior to the application of the various corrections, (i.e. drift, free-air, latitude, and Bouguer), as seen in Table 2.
Figure 9. A model showing the depth to bedrock and the location and size of the potential void for traverse A-A′. The blue dots on the black and orange lines represent the locations at which gravity measurements were taken. The area contained within the black and orange lines represent the amount of fill beneath the traverse. The orange line represents the bedrock profile at depth. Though the surface profile (horizontal black line) appears to be nearly flat note the difference in the vertical scale from Figures 7 & 8.
Figure 10. A model showing the depth to bedrock and the location and size of potential voids for traverse B-B′. The reason for why there are multiple voids shown in the figure is because the model predicts that a void could be located at any of the three locations depicted. The blue dots on the black and orange lines represent the locations at which gravity measurements were taken. The area contained within the black and orange lines represent the amount of fill beneath the traverse. The orange line represents the bedrock profile at depth. Though the surface profile (horizontal black line) appears to be nearly flat note the difference in the vertical scale from Figures 7 & 8.
Table 1. Gravity data and corrections for Barnerville Road (A-Aʹ) traverse. Here and in Table 2, the initial drift corrected readings have already been corrected for the drift of the instrument (i.e. gravity meter). Also, as in Figures 4 and 5, station is abbreviated to STA followed by the corresponding station number and BASE refers to the location of the base station.
Table 2. Gravity data and corrections for Myers Road (B-Bʹ) traverse.
[1] | Kastning EH (1975) Cavern development in the Helderberg Plateau, east-central New York. University of Connecticut..reprinted as New York Cave Survey Bulletin 1: 194. |
[2] | Palmer MV (1976) Groundwater flow patterns in limestone solution conduits.State University of New York at Oneonta 150. |
[3] | Mylroie JE (1977) Speleogenesis and karst geomorphology of the Helderberg Plateau, Schoharie County, New York. Rensselaer Polytechnic Institute.reprinted as New York Cave Survey Bulletin 2: 336. |
[4] | Dumont KA (1995) Karst hydrology and geomorphology of the Barrack Zourie Cave System, Schoharie County, New York. Mississippi State University.reprinted as New York Cave Survey Bulletin 5: 70. |
[5] | Weremeichik JM, Mylroie JE (2014) Glacial Lake Schoharie: An investigative study of glaciolacustrine lithofacies in caves, Helderberg Plateau, central New York.J Cave Karst Stud 76: 127-138. |
[6] | Cooper MP, Mylroie JE (2015) Glaciation and Speleogenesis: Interpretations from the Northeastern United States.Springer . |
[7] | Palmer AN, Rubin PA, Palmer MV, et al. (2003) Karst of the Schoharie Valley and land use analysis, Schoharie County, New York State. In: Johnson EL, editor.New York State Geological Association Field Trip Guidebook 75th Annual Meeting 141-165. |
[8] | Lauritzen S-E, Mylroie JE (2000) Results of a speleothem U/Th dating reconnaissance from the Helderberg Plateau, New York.J Cave Karst Stud 62: 20-26. |
[9] | Rubin PA (2009) Geological evolution of the Cobleskill Plateau; New York State, USA. In.Proceedings of the 15th International Congress of Speleology 972-978. |
[10] | Egemeier SJ (1969) Origin of caves in eastern New York as related to unconfined groundwater flow.Natl Speleol Soc Bull 37: 97-110. |
[11] | Palmer AN, Palmer MV, Porter CO, et al. (1991) A geologic guide to the karst and caves of the Helderberg Mountains, Schoharie and Albany Counties, New York. In: Nardacci M, editor. Guide to the Caves and Karst of the Northeast: 50th Anniversary NSS Convention; Cobleskill, NY.National Speleological Society 105-167. |
[12] | Palmer AN, Rubin PA (2007) Karst of the Silurian-Devonian Carbonates in Eastern New York State, with emphasis on the Cobleskill Plateau. In.Carbonate Geology of the Howes Cave Area, Schoharie County, New York, Hudson-Mohawk Professional Geologists Association Field Trip Guidebook 17-35. |
[13] | Flora DF, Ferwerda JA, Ackerson KT, et al. (1969) Soil survey of Schoharie County, New York.Soil Surv Reports United States Dep Agric 153. |
[14] | Web Soil SurveyNational Cooperative Soil Survey. U.S. Department of Agriculture.Available from . |
[15] | Bugliosi EF, Trudell R.A, Casey GD (1988) Potential yields of wells in unconsolidated aquifers in upstate New York - Hudson-Mohawk sheet. U.S..Geological Survey Water-Resources Investigations Report 87-4275. |
[16] | Parasnis DS (1979) Principles of applied geophysics.Chapman and Hall . |
[17] | Torge W (1989) Gravimetry.De Gruyter . |
[18] | Whitelaw JL, Mickus K, Whitelaw MJ, et al. (2008) High-resolution gravity study of the Gray Fossil Site.Geophysics 73: B25-B32. |
[19] | Crawford NC, Lewis MA, Winter SA, et al. (1999) Microgravity techniques for subsurface investigations of sinkhole collapses and for detection of groundwater flow paths through karst aquifers. In: Beck BF, Pettit AJ, Herring JG, editors.Hydrology and Engineering Geology of Sinkholes and Karst 203-218. |
[20] | Crawford NC, Webster JW, Winter SA (1989) Detection of caves from the surface by microgravity followed by exploratory drilling: Lost River Groundwater Basin, Bowling Green, Kentucky.Prepared for the City of Bowling Green, Municipal Order No 85-83. |
[21] | Milunich K, Palmer AN (1996) Gravity survey of a buried pre-glacial valley in east-central New York and interpretation of glacial effects on karst drainage.The Compass 74: 7-13. |
[22] | Hammer S (1939) Terrain corrections for gravimeter stations.Geophysics 4: 184-194. |
[23] | Leaman DE (1998) The gravity terrain correction - practical considerations.Explor Geophys 29: 467-471. |
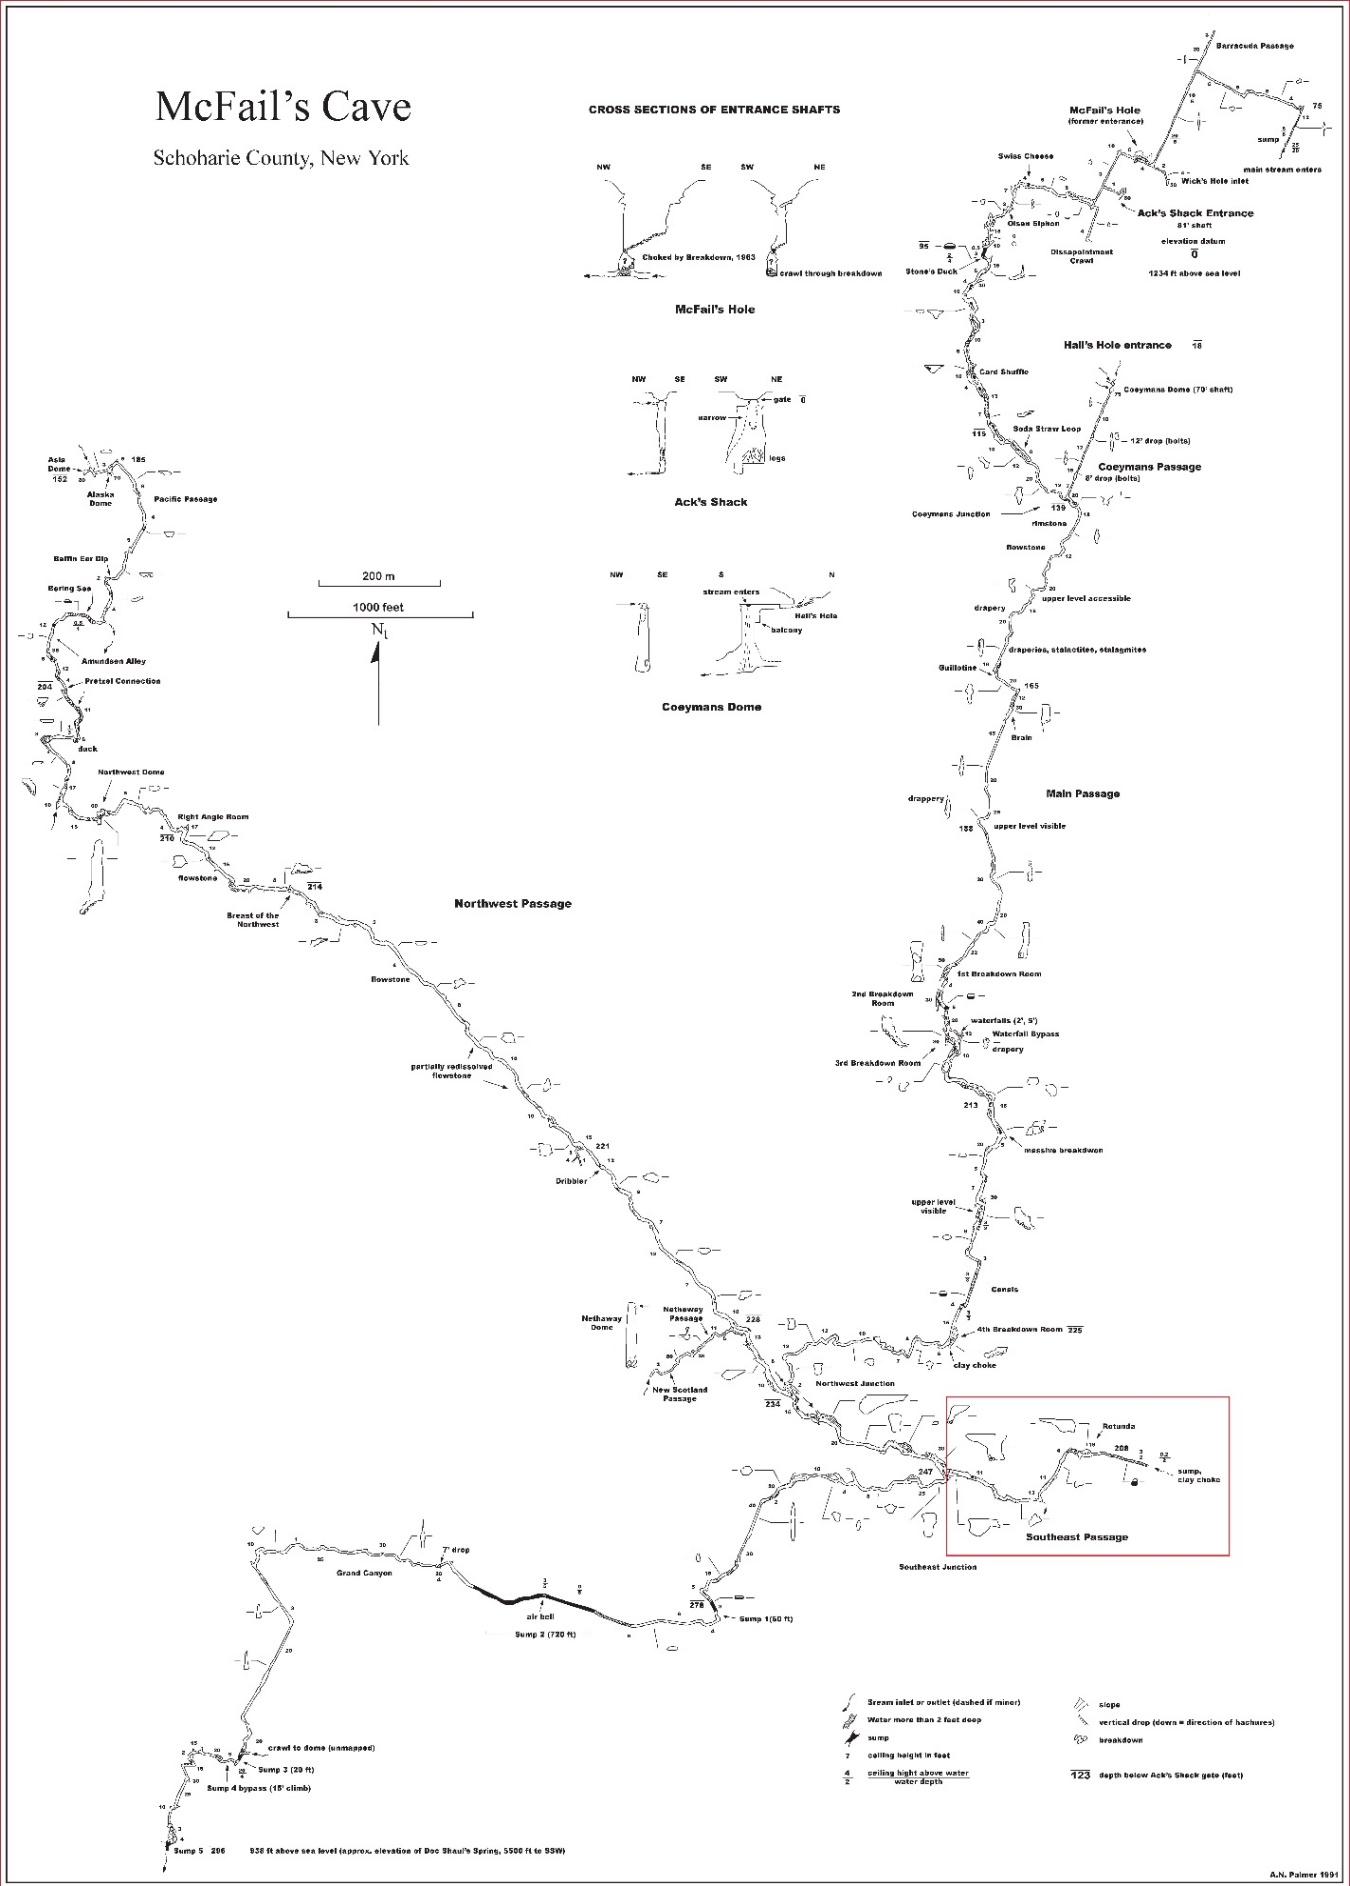
[24] | Palmer AN (1991) Map of McFails Cave, Schoharie County, New York. In: Nardacci M, editor. Guide to the Caves and Karst of the Northeast: 50th Anniversary NSS Convention, Cobleskill, New York.National Speleological Society 167. |
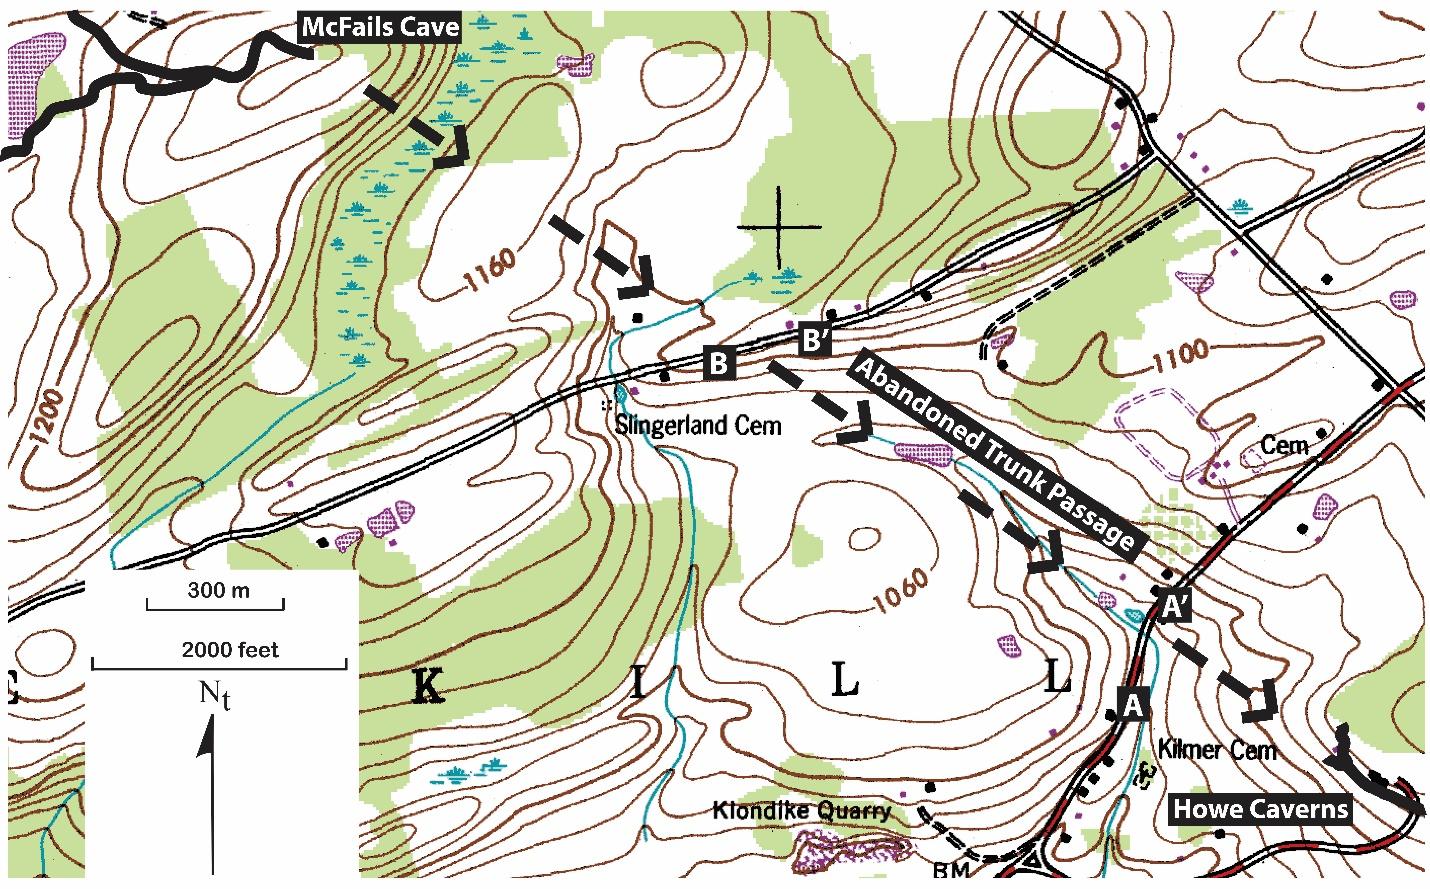
[25] | US GS (1994) Cobleskill quadrangle, New York-Schoharie Co.: 7.5 Minute Series (Topographic).scale . |
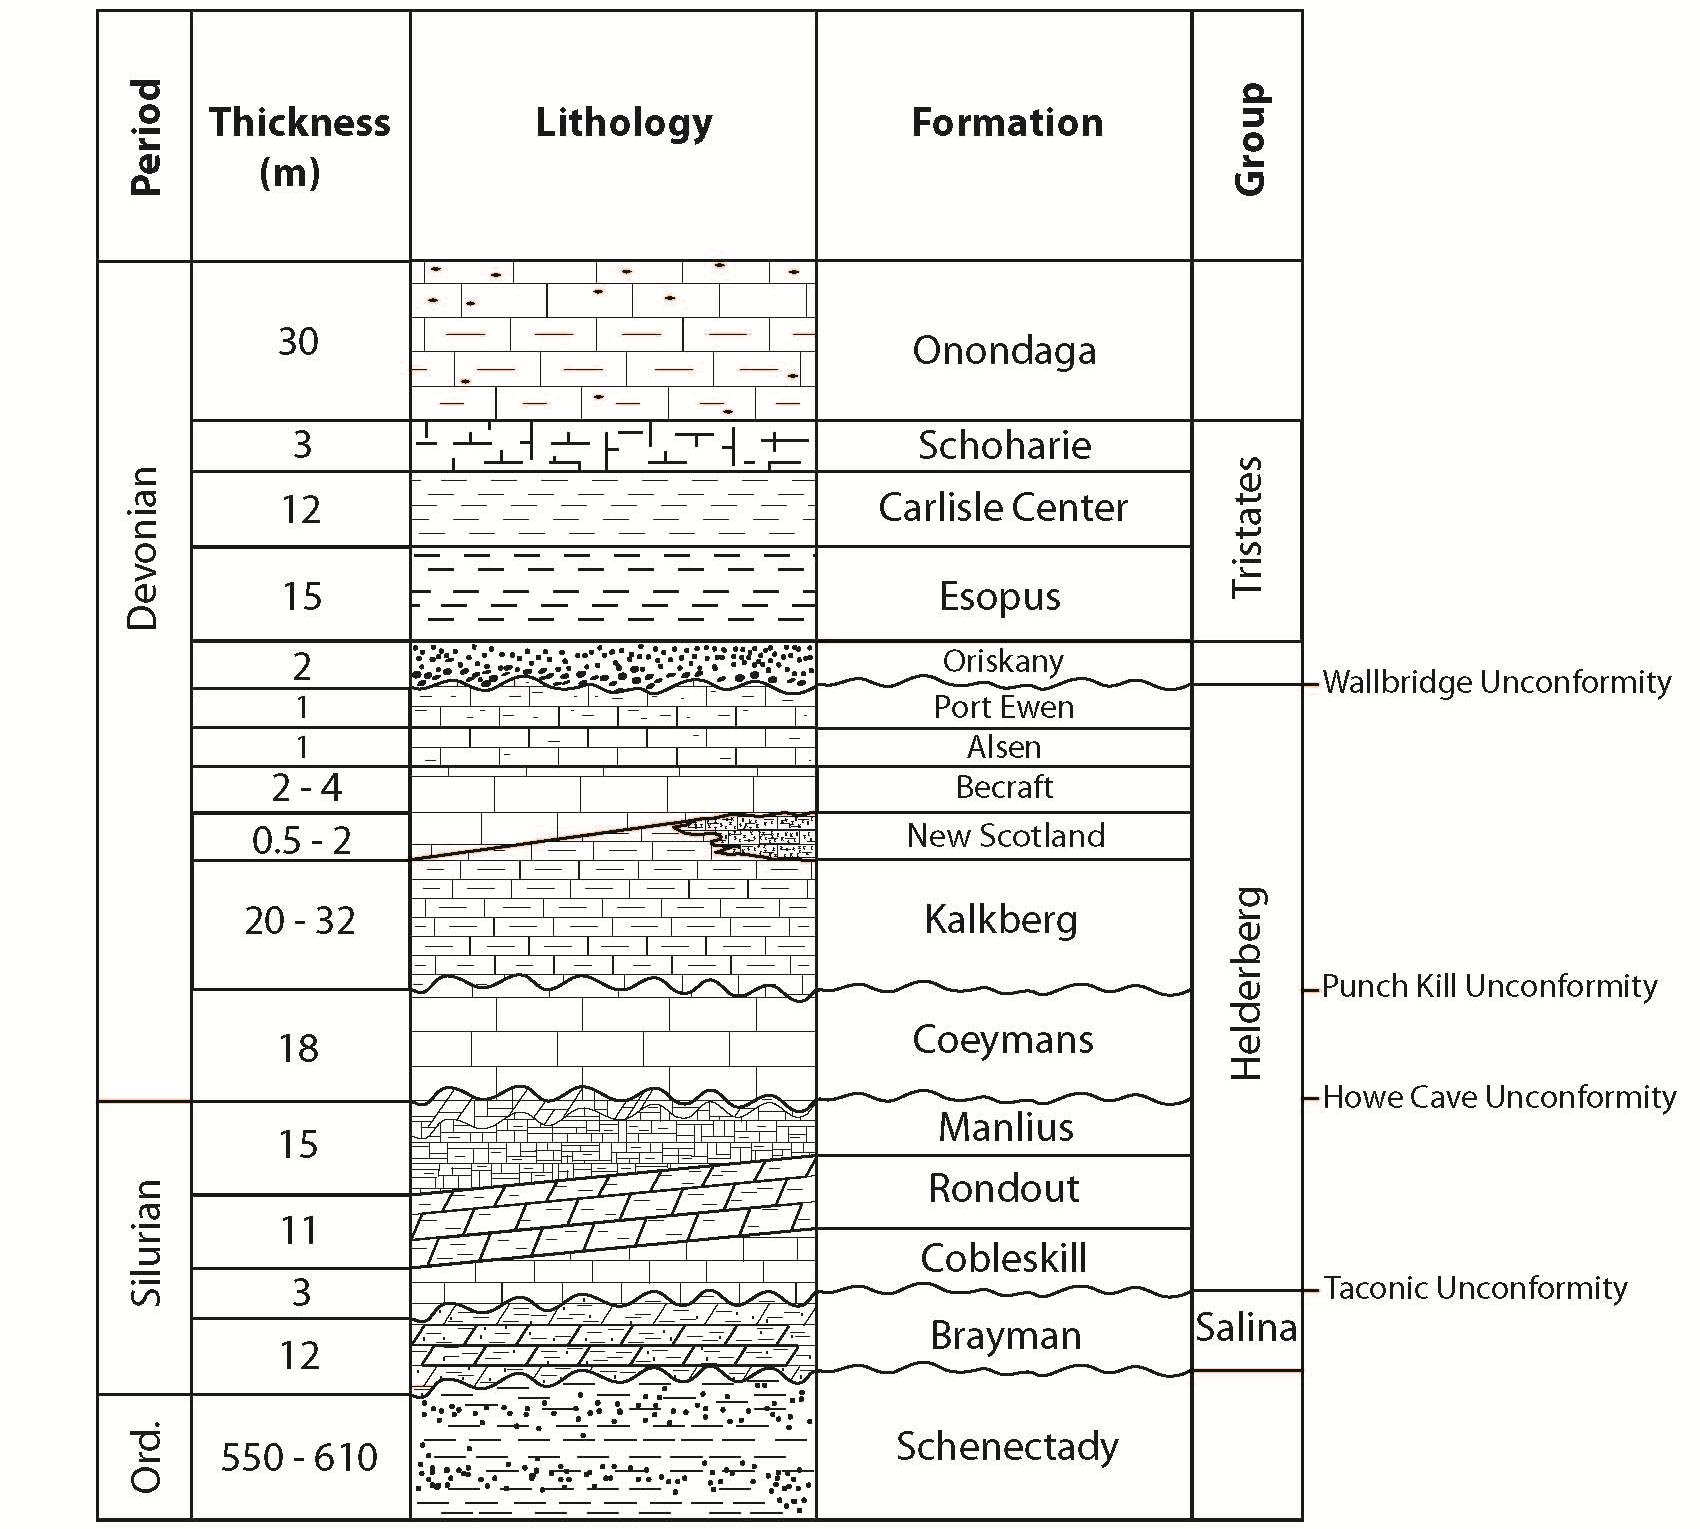
[26] | Rickard LV (1962) Late Cayugan (Upper Silurian) and Helderbergian (Lower Devonian) stratigraphy in New York.New York State Museum and Science Service Bull 386: 157. |
[27] | Ebert JR, Matteson DK, Natel EM (2001) Parting the Helderberg Sea: cryptic unconformities and the Silurian-Devonian boundary in the classic epeiric sea sequence of New York. In.Geologic Society of America, Abstracts and Programs 321-322. |
[28] | Ebert JR, Matteson DK, Wilson R (2010) Sedimentologic observation and stratigraphic interpretation of the Lower Devonian (Lochkovian) Manlius Formation along the Mohawk River Valley in Upstate New York: A discussion.J Geol 118: 333-337. |
[29] | Ver Straeten CA (2008) Volcanic tephra bed formation and condensation processes: A review and examination from Devonian stratigraphic sequences.J Geol 116: 545-557. |
[30] | Ver Straeten CA (2009) The classic Devonian of the Catskill Front: A foreland basin record of Acadian orogenesis. In.New York State Geological Association Field Trip Guidebook 81st Annual Meeting 7-1-7-54. |
Stations from South to North | Elevation from Base Station | Distance from Base Station | Drift Corrected Readings | Latitude Correction | Free-air Correction | Bouguer Correction | Final Gravity |
(cm) | (m) | (mGal)* | (mGal) | (mGal) | (mGal) | (mGal) | |
Station 18 | 30.20 | -36 | 173.59 | -0.03 | -0.09 | 0.03 | 173.68 |
Station 17 | 30.32 | -30 | 173.50 | -0.02 | -0.09 | 0.03 | 173.58 |
Station 16 | 30.14 | -24 | 173.03 | -0.02 | -0.09 | 0.03 | 173.11 |
Station 15 | 29.69 | -18 | 172.91 | -0.02 | -0.09 | 0.03 | 172.98 |
Station 14 | 29.49 | -12 | 172.53 | -0.01 | -0.09 | 0.03 | 172.59 |
Station 13 | 29.63 | -6 | 172.35 | -0.01 | -0.09 | 0.03 | 172.41 |
Base Station | 0 | 0 | 170.77 | 0.00 | 0.00 | 0.00 | 170.77 |
Station 1 | 28.98 | 6 | 170.62 | 0.01 | -0.09 | 0.03 | 170.67 |
Station 2 | 28.58 | 12 | 170.32 | 0.01 | -0.09 | 0.03 | 170.36 |
Station 3 | 28.42 | 18 | 170.51 | 0.01 | -0.09 | 0.03 | 170.56 |
Station 4 | 28.25 | 24 | 170.78 | 0.02 | -0.09 | 0.03 | 170.81 |
Station 5 | 28.13 | 30 | 170.73 | 0.03 | -0.09 | 0.03 | 170.76 |
Station 6 | 28.25 | 36 | 170.71 | 0.03 | -0.09 | 0.03 | 170.74 |
Station 7 | 28.43 | 42 | 170.68 | 0.03 | -0.09 | 0.03 | 170.70 |
Station 8 | 28.50 | 48 | 170.68 | 0.04 | -0.09 | 0.03 | 170.69 |
Station 9 | 28.91 | 54 | 171.16 | 0.04 | -0.09 | 0.03 | 171.17 |
Station 10 | 29.55 | 60 | 171.25 | 0.05 | -0.09 | 0.03 | 171.27 |
Station 11 | 30.53 | 66 | 171.29 | 0.05 | -0.09 | 0.03 | 171.30 |
Station 12 | 31.58 | 72 | 171.74 | 0.06 | -0.10 | 0.04 | 171.74 |
s.e.† | - | - | 0.25 | 0.01 | 0.00 | 0.00 | 0.26 |
* Raw gravity readings were measured using a Worden Gravimeter with an accuracy of 0.01 mGal | |||||||
† s.e. = the standard error to one standard deviation |
Stations from South to North | Elevation from Base Station | Distance from Base Station | Drift Corrected Readings | Latitude Correction | Free-air Correction | Bouguer Correction | Final Gravity |
(cm) | (m) | (mGal)* | (mGal) | (mGal) | (mGal) | (mGal) | |
Base Station | 0 | 0 | 165.38 | 0 | 0 | 0.00 | 165.38 |
Station 1 | 9.14 | 6 | 165.14 | 0.00 | -0.03 | 0.01 | 165.16 |
Station 2 | 29.69 | 12 | 165.31 | 0.00 | -0.09 | 0.03 | 165.37 |
Station 3 | 51.82 | 18 | 165.17 | 0.00 | -0.16 | 0.06 | 165.27 |
Station 4 | 83.73 | 24 | 164.97 | 0.00 | -0.26 | 0.09 | 165.13 |
Station 5 | 103.72 | 30 | 164.74 | 0.00 | -0.32 | 0.12 | 164.94 |
Station 6 | 108.91 | 36 | 164.74 | 0.01 | -0.34 | 0.12 | 164.95 |
Station 7 | 115.85 | 42 | 164.80 | 0.01 | -0.36 | 0.13 | 165.02 |
Station 8 | 135.45 | 48 | 164.84 | 0.01 | -0.42 | 0.15 | 165.09 |
Station 9 | 152.25 | 54 | 164.65 | 0.02 | -0.47 | 0.17 | 164.93 |
Station 10 | 160.57 | 60 | 164.70 | 0.01 | -0.50 | 0.18 | 165.00 |
Station 11 | 163.53 | 66 | 164.29 | 0.02 | -0.50 | 0.19 | 164.59 |
Station 12 | 169.29 | 72 | 164.07 | 0.02 | -0.52 | 0.19 | 164.39 |
Station 13 | 188.76 | 78 | 163.87 | 0.02 | -0.58 | 0.21 | 164.22 |
Station 14§ | 212.48 | 84 | 171.17 | 0.02 | -0.66 | 0.24 | 171.11 |
Station 15 | 226.98 | 90 | 163.89 | 0.02 | -0.70 | 0.26 | 164.31 |
s.e.† | - | - | 0.42 | 0.00 | 0.05 | 0.02 | 0.40 |
* Raw gravity readings were measured using a Worden Gravimeter with an accuracy of 0.01 mGal | |||||||
† s.e. = the standard error to one standard deviation | |||||||
§ Suspected erroneous reading |
Stations from South to North | Elevation from Base Station | Distance from Base Station | Drift Corrected Readings | Latitude Correction | Free-air Correction | Bouguer Correction | Final Gravity |
(cm) | (m) | (mGal)* | (mGal) | (mGal) | (mGal) | (mGal) | |
Station 18 | 30.20 | -36 | 173.59 | -0.03 | -0.09 | 0.03 | 173.68 |
Station 17 | 30.32 | -30 | 173.50 | -0.02 | -0.09 | 0.03 | 173.58 |
Station 16 | 30.14 | -24 | 173.03 | -0.02 | -0.09 | 0.03 | 173.11 |
Station 15 | 29.69 | -18 | 172.91 | -0.02 | -0.09 | 0.03 | 172.98 |
Station 14 | 29.49 | -12 | 172.53 | -0.01 | -0.09 | 0.03 | 172.59 |
Station 13 | 29.63 | -6 | 172.35 | -0.01 | -0.09 | 0.03 | 172.41 |
Base Station | 0 | 0 | 170.77 | 0.00 | 0.00 | 0.00 | 170.77 |
Station 1 | 28.98 | 6 | 170.62 | 0.01 | -0.09 | 0.03 | 170.67 |
Station 2 | 28.58 | 12 | 170.32 | 0.01 | -0.09 | 0.03 | 170.36 |
Station 3 | 28.42 | 18 | 170.51 | 0.01 | -0.09 | 0.03 | 170.56 |
Station 4 | 28.25 | 24 | 170.78 | 0.02 | -0.09 | 0.03 | 170.81 |
Station 5 | 28.13 | 30 | 170.73 | 0.03 | -0.09 | 0.03 | 170.76 |
Station 6 | 28.25 | 36 | 170.71 | 0.03 | -0.09 | 0.03 | 170.74 |
Station 7 | 28.43 | 42 | 170.68 | 0.03 | -0.09 | 0.03 | 170.70 |
Station 8 | 28.50 | 48 | 170.68 | 0.04 | -0.09 | 0.03 | 170.69 |
Station 9 | 28.91 | 54 | 171.16 | 0.04 | -0.09 | 0.03 | 171.17 |
Station 10 | 29.55 | 60 | 171.25 | 0.05 | -0.09 | 0.03 | 171.27 |
Station 11 | 30.53 | 66 | 171.29 | 0.05 | -0.09 | 0.03 | 171.30 |
Station 12 | 31.58 | 72 | 171.74 | 0.06 | -0.10 | 0.04 | 171.74 |
s.e.† | - | - | 0.25 | 0.01 | 0.00 | 0.00 | 0.26 |
* Raw gravity readings were measured using a Worden Gravimeter with an accuracy of 0.01 mGal | |||||||
† s.e. = the standard error to one standard deviation |
Stations from South to North | Elevation from Base Station | Distance from Base Station | Drift Corrected Readings | Latitude Correction | Free-air Correction | Bouguer Correction | Final Gravity |
(cm) | (m) | (mGal)* | (mGal) | (mGal) | (mGal) | (mGal) | |
Base Station | 0 | 0 | 165.38 | 0 | 0 | 0.00 | 165.38 |
Station 1 | 9.14 | 6 | 165.14 | 0.00 | -0.03 | 0.01 | 165.16 |
Station 2 | 29.69 | 12 | 165.31 | 0.00 | -0.09 | 0.03 | 165.37 |
Station 3 | 51.82 | 18 | 165.17 | 0.00 | -0.16 | 0.06 | 165.27 |
Station 4 | 83.73 | 24 | 164.97 | 0.00 | -0.26 | 0.09 | 165.13 |
Station 5 | 103.72 | 30 | 164.74 | 0.00 | -0.32 | 0.12 | 164.94 |
Station 6 | 108.91 | 36 | 164.74 | 0.01 | -0.34 | 0.12 | 164.95 |
Station 7 | 115.85 | 42 | 164.80 | 0.01 | -0.36 | 0.13 | 165.02 |
Station 8 | 135.45 | 48 | 164.84 | 0.01 | -0.42 | 0.15 | 165.09 |
Station 9 | 152.25 | 54 | 164.65 | 0.02 | -0.47 | 0.17 | 164.93 |
Station 10 | 160.57 | 60 | 164.70 | 0.01 | -0.50 | 0.18 | 165.00 |
Station 11 | 163.53 | 66 | 164.29 | 0.02 | -0.50 | 0.19 | 164.59 |
Station 12 | 169.29 | 72 | 164.07 | 0.02 | -0.52 | 0.19 | 164.39 |
Station 13 | 188.76 | 78 | 163.87 | 0.02 | -0.58 | 0.21 | 164.22 |
Station 14§ | 212.48 | 84 | 171.17 | 0.02 | -0.66 | 0.24 | 171.11 |
Station 15 | 226.98 | 90 | 163.89 | 0.02 | -0.70 | 0.26 | 164.31 |
s.e.† | - | - | 0.42 | 0.00 | 0.05 | 0.02 | 0.40 |
* Raw gravity readings were measured using a Worden Gravimeter with an accuracy of 0.01 mGal | |||||||
† s.e. = the standard error to one standard deviation | |||||||
§ Suspected erroneous reading |