Citation: E. Langford, C.A. Griffiths. The mechanical strength of additive manufactured intraosseous transcutaneous amputation prosthesis, known as the ITAP[J]. AIMS Bioengineering, 2018, 5(3): 133-150. doi: 10.3934/bioeng.2018.3.133
[1] | Joshua Bird, Euan Langford, Christian Griffiths . A study into the fracture control of 3D printed intraosseous transcutaneous amputation prostheses, known as ITAPs. AIMS Bioengineering, 2020, 7(1): 29-42. doi: 10.3934/bioeng.2020003 |
[2] | A. Sydney Gladman, Manuel Garcia-Leiner, Alexis F. Sauer-Budge . Emerging polymeric materials in additive manufacturing for use in biomedical applications. AIMS Bioengineering, 2019, 6(1): 1-20. doi: 10.3934/bioeng.2019.1.1 |
[3] | Simran Rajesh Katyari, Prateeksha Lakhe, Amit Reche . Rapid prototyping: A future in orthodontic. AIMS Bioengineering, 2024, 11(1): 66-84. doi: 10.3934/bioeng.2024005 |
[4] | Paula García-Fraile, Esther Menéndez, Raúl Rivas . Role of bacterial biofertilizers in agriculture and forestry. AIMS Bioengineering, 2015, 2(3): 183-205. doi: 10.3934/bioeng.2015.3.183 |
[5] | Yihan Zhang . Manufacture of complex heart tissues: technological advancements and future directions. AIMS Bioengineering, 2021, 8(1): 73-92. doi: 10.3934/bioeng.2021008 |
[6] | Clara Navarrete, José L. Martínez . Non-conventional yeasts as superior production platforms for sustainable fermentation based bio-manufacturing processes. AIMS Bioengineering, 2020, 7(4): 289-305. doi: 10.3934/bioeng.2020024 |
[7] | Ana Letícia Braz, Ifty Ahmed . Manufacturing processes for polymeric micro and nanoparticles and their biomedical applications. AIMS Bioengineering, 2017, 4(1): 46-72. doi: 10.3934/bioeng.2017.1.46 |
[8] | Anirudh Gupta, Bhairavi Kale, Deepika Masurkar, Priyanka Jaiswal . Etiology of dental implant complication and failure—an overview. AIMS Bioengineering, 2023, 10(2): 141-152. doi: 10.3934/bioeng.2023010 |
[9] | Chiara Schiraldi, Alberto D'Avino, Alessandro Ruggiero, Katia Della Corte, Mario De Rosa . Saccharomyces pastorianus as cell factory to improve production of fructose 1,6-diphosphate using novel fermentation strategies. AIMS Bioengineering, 2015, 2(3): 206-221. doi: 10.3934/bioeng.2015.3.206 |
[10] | Mark Weingarten, Nathan Akhavan, Joshua Hanau, Yakov Peter . A Place to Call Home: Bioengineering Pluripotential Stem Cell Cultures. AIMS Bioengineering, 2015, 2(2): 15-28. doi: 10.3934/bioeng.2015.2.15 |
The Intraosseous Transcutaneous Amputation Prosthesis, known as the ITAP (Figure 1) is the focus of this study. This research explores the manufacturability of the ITAP with a focus on the mechanical strength using 3D printing. The ITAP is a cutting-edge piece of medical engineering equipment used to connect a prosthesis to the remainder of the bone in a limb, based on the design of deer antlers protruding from the head of the deer without infection or damage to the animal [1]. ITAP is a continuation the Osseointegrated Prostheses for the Rehabilitation of Amputees (OPRA) setup but advances it through safety mechanisms for the user, like ejecting the prosthetic limb in an accident [2]. The biggest difference between ITAP and other systems of attachment that use a socket interface is that the former will always fit as it is fused to the user, the latter is placed onto the stump and locked in places using straps and pressure from the closeness of the fitting, this is done to prevent slip that could cause pain on the stump and attempts to reduce the contact friction, this may not be a safe way of relieving an amputee's pain [3]. The benefit of ITAP is its lifespan as it is designed to be a permanent fixture because the ITAP is fused to the user, while the socket interface can only be used for a finite time because infection and sores concentrate in the furcation region, resulting in it being unusable [3].
The ITAP can be used in both humans and animals, Fitzpatrick et al. (2011) concluded from there report that the use of ITAP is feasible if the chosen material is biocompatible with correct installation [4]. ITAP can also be utilised in multiple amputations and medical needs, such as the reconstruction of complex facial defects, using infection free implants suitable for direct skeleton attachment for the reconfiguration of the skull [5]. Research indicates that ITAPs produce a greater quality of life for the user then not having a prosthetic attachment [6].
One inhibiting factor for the use of the ITAP is user lifestyle. The forces generated on a human leg in day-to-day activities are varied and never constant, and there is a possibility of the ITAP failure, leading to further damage to bone structure and tissue because the ITAP is fused to the skeleton. The design and material selection must be suitable to withstand moderate impact and loads associated with walking and running.
The way the ITAP is designed for the individual is governed by two crucial factors. The first being the biocompatibility of the material, which is an issue because the wrong material could cause infection or corrosion in the body. Materials that are beneficial to the skeleton would be preferred such as titanium or peak [7,8,9]. The second crucial factor is the generation of the ITAP, by using layer-based manufacturing technologies, personalised components can be built to individual's needs.
The aim of this research is to manufacture the ITAP using 3D printing and identify the optimum ITAP mechanical structure using load bearing simulations and validation of the solutions using tensile testing of test specimens.In this project Polylactic acid (PLA) samples have been used for all testing, as the costing for layer base printed titanium samples is considerably higher. PLA could not be used in a real ITAP as it is not readily biocompatible, but is suitable for tensile testing because it identifies the optimum 3D printing build combination of infill and orientation. For all simulations the ITAP's material has been set to titanium alloy (Ti6Al4V), as titanium is a biomedical material that is compatible with the human body. Titanium is predominantly used in hip replacements and medical inserts within the body. The research of Chen et al. (2017) [10] shows titanium has the potential of fusing the ITAP to the human femur when using powder metallurgy.
In 2013 Newcombe et al. [11] worked on various lengths of amputation of the femur, putting them under loads of 664 N, 143 N and 8 Nm of axial (F1), shear (F2) and torque (F3) loading respectively while using ITAP's design (Figures 2 and 10). The load from the weight of the average patient was assumed to be 750 N. The testing was conducted in three different caseloads, where each case focused on one force (F) at a time. It was found that the stress from the shear load was greater than the axial load stress in the experiments. At the longest length of femur, the calculated axial and shear forces produced a maximum stress of 38 and 41 MPa respective to each case load, the forces in this experiment were applied to the protruding end of the ITAP (Figures 2, 4, 5).
The conclusion of the paper was that it is not recommended that an amputee should be fitted with an ITAP when their amputation is close to the joint of the hip, as this is weaker material and is unable to facilitate the transmission of stress on the bone anchor. However, Newcombe et al.'s research stated that a quarter amputation of the femur is a feasible region of use for the ITAP.
As such the focus of this research builds on the findings of Newcombe et al., working with a quarter amputation. The simulations that Newcombe et al. used to identify the stress in the ITAP, have been used in the report to validate the mechanical strength generated by the ITAP, when using different infill and orientation settings. For comparisons of Newcombe's work this study used the same control measures. These include, the same length of amputation on the cylindrical femur and outer diameter of 26 mm, with the same length and diameter of the ITAP's insert into the bone, this being 160 mm and 14 mm respectively, with the acting forces F1-F3 on the assembled femur and ITAP model. A control variable used in Newcombe et al's work is the weight of the user of the ITAP being applied in each simulation.
By following the same simulation controls as Newcombe et al., it has been possible to identify the maximum stress (σmax) found within the ITAP assembly with the femur. This high stress region is critical for the ITAP when being manufactured. To optimise the build of the ITAP infill percentage for the simulation have been set to 25, 50, 75 and 100% for all three-possible print orientation.
The simulation study of the ITAP model has been run with CAD design software as this will allow visual representation of the ITAP stresses and the repercussions of the loading forces. This process may identify where changes are needed to produce a design that can handle loads without failure while distributing the stress throughout the model. As this is a product that can be used by humans or animals, it is imperative that it meets the recognised standard of design and follows the factors of safety (FOS) set in place. The FOS for the ITAP has currently not been identified in any medical engineering research papers or design specification.
The initial design of the ITAP produced by the engineering standards is shown in Figures 1 and 2. The femur used in this report has been generated using computed tomography (CT) on a deceased subject, the CT scanned data had then been imported into digital imaging (DI) software resulting in the femur model (Figure 3). This femur has been printed to a 1:1, as well as the augmented femur used in this report, with accompanying ITAP for a visual representation of the medical devices. The details of the deceased person are as follows: Male, Left leg, Age 44, Death 2016, Weigh 85 kg, Height 185 cm. The CAD designer who imported this item is Mahmoudi 2017 [12].
The bone material used in the SolidWorks simulation has been generated by the information gathered from four separate sources. The research gathered by Yousif 2012, of the human femur bone during normal walking and standing up [13] is the primary source of data collection, however the research of Ahuja et al. [14] and Yeni et al. 1998 [15] and the SolidWorks community database 2017 [16] also produces concordant data to use (Table 1). As the density and the material characteristics of the femur changes throughout the bone, the lowest values of data in the femur have been chosen, this being trabecular bone, in order not to under-engineer the ITAP's impact on the femur in the simulations.
Ultimate Tensile strength | Elastic Modulus | Shear Modulus | Poisson's Ratio |
49 Mpa | 2029.4 MPa | 4.69 GPa | 0.4 |
Shear Stress | Compressive strength | Density [ρ] | |
65 MPa | 131 MPa | 1.3712 g/cm3 |
The method of testing of potential material will follow the necessary standards suitable for use, the standard used here is the tensile properties BS EN ISO 527-2:2012 (ISO 527) [17]. This standard of testing is used on rigid and semi-rigid thermoplastics and thermosetting plastics produced by different production methods, including the use of layer based production.
The production of the parts to be used must follow the part dimensions given in the standards of the ISO 527, which is suitable to use in test sample 1B (Figure 6). As different orientations of layer based production, density of filament and printing temperature affect the strength generated in the product, these samples will have the ISO principles applied to them to identify the best combination to suit the ITAP design. If the procedures are not followed, then the gathered data is invalid. The test samples used have the same infill densities as the simulations, these being 25, 50, 75 and 100% fill density, printed on 3 different planes (Figure 7) using the same control variables on the Ultimate 2+ 3D printer using PLA infill. Upon completion, these samples were subjected to testing of the ISO's standards.
The Infill Pattern has been set to Tri-Hexagonal as this follows honeycomb design (Figure 8). Extensive research has shown that this infill technique is stronger. It uses triangulation in its structure, as a result conferring a high strength to weight ratio that also has the capability of high-energy absorption [18,19]. The production of the honeycomb filament in 3D printing has the benefit of handling a greater stress because, as the triangulation increases so does that of the filament density [20,21] in this case producing a stronger test specimen for the ITAP. See Table 2 for all control variables and production of test specimens. The dependent variables for the samples are the infill percentage and orientation of printing. The result of both the control and independent variables gives way to the dependent variables, these being the yield load (YL), ultimate tensile load (UTL), yield stress (YS) and ultimate tensile stress (UTS).
Control Variables for ISO printing of test specimen: | |||
Layer Height | 0.1 mm | Gradual Infill Steps | 0 |
Top/Bottom Thickness | 0.8 mm | Generate Support | Yes |
Infill Pattern | Tri-Hexagonal | Plate Adhesion Type | Brim |
Support Placement | Everywhere | Brim Width | 10 mm |
Temperature of bed | 60'C | Temperature of Extruder | 200'C |
Unfortunately, in the production of the test sample the print failed when printing the vertical samples for the ISO test specimens. This was due to the specimen peeling from the heated bed, but continuing to print and resulted in the specimen's failure. However, this did not affect the other samples being printed. As such the vertical print orientation will not be used in this report as it is unstable when being manufactured. It is also the weakest orientation as identified through the research of Tanoto et al. 2017, where it was observed that the print with the greatest vertical orientation had less than half the maximum tensile stress capability found in its counterparts, which were printed in the x and y orientation. This can be attributed to the forces acting on either side of the plastic layers where there are minimal strands holding the layers of the test sample together [22].
The PLA ISO 527 specimens were tested using the Hounsfield 25 kN electrically operated tensile test machine (Figure 9). This procedure follows the British testing standards stated in ISO 527. Each specimen was loaded into the grips of the tensile machine. A constant value of torque was applied to the grippers, this value of torque was judged by the feel of the apparatus tightening, to ensure repeatability in testing and security of the parts being clamped in place. Its imperative to not under or over tighten the specimens, as the former would strip away material of the specimen when its being pulled out when undergoing tensile testing. The latter is an issue as over tighten could course a stress construction in the specimen, processing inaccurate data.
The set speed for testing all samples is at a rate of 1 mm/minute, where the data is recorded every 0.5 seconds. The direction of the measured steers and displacement in each sample was recorded on the largest section of each specimen in the same direction of testing, this being in the Z-axis, see Figures 7 and 9. Upon completion of testing, five complete sets each consisting of the four specimens with the greatest UTL have been printed on the Ultimate 2+.
Flat specimens where used for the testing as 3D printing cylindrical samples was found not to be suitable on the machines available, as failure had a very high chance of happing, especially when lowering the infill percentage. As such it was concluded that it was better to use a dog bone sample to identify the failure in a variety of infill and print orientations. This can then be used for the development of ITAPs that may not be cylindrical in nature.
A preliminary simulation was undertaken using SolidWorks; to identify the stress found studying F1 at an infill percentage of 100%. A σmax of 18 GPa was identified directly to the ITAP embedded in the femur. A pressure such as this would splinter the femur and cause irreparable damage to the bone with fragments potentially penetrating the femoral artery. Such a scenario would require immediate medical attention and further amputation. The identified maximum axial stress value is inaccurate when compared to 38 MPa result identified in the work by Newcombe et al. When looking at a femur with a quarter amputation of the stress were equal to 18 GPa, the ITAP would not be used in prosthetic fittings.
Due to the limitation of solid works computational modelling, ANSYS has been used to validate the work of Newcombe et al. to achieve a higher accuracy and produce accurate simulations of the ITAP model (Figure 10). The simulations used imported CAD files generated by using SolidWorks that were then loaded into ANSYS. In total there were twelve models, one for each infill percentage and possible print orientation; for each model there was a total of three simulations for each load, overall equating to 36 simulations of the augmented femur. The loads applied for each simulation are: F1 the axial load of 664 N, F2 the shear load of 143 N and F3 the torque load of 8 Nm.
The model of the ITAP changed by the infill percentage and print orientation, the simulations mimicked this by having marital removed in different axis's of printing orientation. A honeycomb grid was built in to and completely coved the printed orientation side of the ITAP using 4mm pentagons, the same dimensions used in the 3D printing software in the Ultimate 2+. Within these pentagons smaller one where built at the sizes of 1 mm, 2 mm and 3 mm, and extruded throw out the ITAP module resulting in the 75%, 50% and 25% models.
The meshing of the simulated module of the ITAP assembly used three separate meshing sensitivities in each simulation, these sensitivities being: Low with a mesh refinement level setting of 2 for solid object; High with a mesh refinement level setting of 4 for solid object; and Fusion which had a mesh refinement level of 5 for edges of contact with two bodies. The mesh sensitivity set to Low was set to the femur module, as this was a constant parameter in each simulation, and had no change in geometry or weight. The area that had a higher mesh control was that of the ITAP, which was imbedded in to the femur. Different simulations had different amounts of material removed, as such the increase in the mesh density produced simulations with accurate data. The final mesh sensitivity, Fusion, was set to the areas were the forces where applied to the simulation and the points were the ITAP and femur fussed together after being fitted top the user, this sensitivity had the largest mesh density as this is there area were stress would be most likely to congregate in the model. Both the mesh sensitivities of high and fusion were not uniform as the change in geometry altered the element nodes used for meshing.
The vertical simulations have been included in this simulation for a comparison between samples, the results of these simulations can be seen in Table 3. The horizontal simulations are countable for the ITAP being printed on a flat or side build, as the ITAP is cylindrical in this design, making both prints identical, the only exception is the orientation of fitting (Figure 11), this will have a critical impact of the performances, as seen in Tables 4 and 5. A further simulation of a “healthy femur” was undertaken for a compression in data, for this section of testing, see Table 6.
Infill percentages of ITAP model | ||||
Load | 25% | 50% | ||
Stress [MPa] | Displacement [mm] | Stress [MPa] | Displacement [mm] | |
F1 | 152.02 | 1.0746 | 57.132 | 1.0596 |
F2 | 4729.4 | 147 | 5996.9 | 250.34 |
F3 | 1.8118 | 1.34E-02 | 1.0544 | 2.25E-03 |
Infill percentages of ITAP module | ||||
Load | 75% | 100% | ||
Stress [MPa] | Displacement [mm] | Stress [MPa] | Displacement [mm] | |
F1 | 82.039 | 1.059 | 9.365 | 1.0546 |
F2 | 1615.2 | 424.08 | 109.6 | 424.433 |
F3 | 0.330141 | 0.0048445 | 0.6095 | 0.2287 |
Infill percentages of ITAP module | ||||
Load | 25% | 50% | ||
Stress [MPa] | Displacement [mm] | Stress [MPa] | Displacement [mm] | |
F1 | 44.474 | 1.0978 | 22.836 | 0.94148 |
F2 | 763.32 | 429.76 | 379.99 | 421.83 |
F3 | 0.19065 | 5.54E-03 | 0.06702 | 1.93E-03 |
Infill percentages of ITAP module | ||||
Load | 75% | 100% | ||
Stress [MPa] | Displacement [mm] | Stress [MPa] | Displacement [mm] | |
F1 | 14.728 | 1.0526 | 9.365 | 1.0546 |
F2 | 296.98 | 420.76 | 109.6 | 424.433 |
F3 | 0.111243 | 3.76E-03 | 0.60951 | 0.2287 |
Infill percentages of ITAP module | ||||
Case Load | 25% | 50% | ||
Resulting Max Stress [MPa] | Resulting Max Displacement [mm] | Resulting Max Stress [MPa] | Resulting Max Displacement [mm] | |
F1 | 44.47 | 1.097 | 22.83 | 0.9414 |
F2 | 727.4 | 435.8 | 237.5 | 191 |
F3 | 0.1906 | 5.54E-03 | 0.06702 | 1.93E-03 |
Infill percentages of ITAP module | ||||
Case Load | 75% | 100% | ||
Resulting Max Stress [MPa] | Resulting Max Displacement [mm] | Resulting Max Stress [MPa] | Resulting Max Displacement [mm] | |
F1 | 14.72 | 1.052 | 9.365 | 1.054 |
F2 | 389.8 | 326.3 | 109.6 | 424.4 |
F3 | 0.1112 | 3.76E-03 | 0.6095 | 0.2287 |
Case Load | |||
Simulated output | F1 | F2 | F3 |
Resulting Max Stress [MPa] | 1.421 | 34.08 | 0.004671 |
Resulting Max Displacement [mm] | 2.863 | 833.9 | 0.007448 |
The tensile characteristics of the PLA specimens are recorded in Table 7 and in Figures 12 and 13. All specimens had a greater region of elastic deformation than a region of plastic deformation. The samples printed on a flat orientation have a much greater plastic deformation range, this being between the YS and the point of failure. It can also be seen that all specimens failed in a brittle manner. However, the specimens with the greatest UTL and YL, are: Flat printed 100% infill; Flat printed 75% infill; Side printed 100% infill and finally Side printed 75% infill. As such an in-depth study of these samples was undertaken to identify the average characteristics on the specimens under loading. For this in-depth study both 100% and 75% samples have been printed on a flat and side orientation, in total five complete sets, a total of 20 specimens, were produced allowing a standard deviation in testing.
PLA Sample properties | Yield Load [N] | Ultimate Tensile Load [N] | Yield Stress [MPa] | Ultimate Tensile Stress [MPa] |
Flat Print 100% Infill | 2048 | 2122 | 51.41 | 53.06 |
Flat Print 75% Infill | 1293 | 1330 | 31.87 | 33.27 |
Flat Print 50% Infill | 1151 | 1170 | 28.97 | 29.25 |
Flat Print 25% Infill | 960.0 | 1000 | 22.45 | 25.00 |
Side Print 100% Infill | 2100 | 2196 | 52.81 | 54.91 |
Side Print 75% Infill | 1124 | 1159 | 27.91 | 28.97 |
Side Print 50% Infill | 885.8 | 931.6 | 22.75 | 23.29 |
Side Print 25% Infill | 763.3 | 803.3 | 19.43 | 20.08 |
The production of the specimens was carried out on the Ultimaker 2+, following the same controls as the initial samples (Table 2). After the production of the samples a digital calliper was used to ensure that the samples were adequate for testing, Table 8 shows the mean averages and standard deviations for the width, thickness and length measured from the samples. The thickness and width readings were taken in the middle of the samples, while the length was measured from end to end. These average readings where used to calculate the stress and strain for each specimen class.
Sample properties | Average [mm] | Standard Deviation [σ] | |
Flat Print 100% Infill | Width | 10.18 | 0.02030 |
Thickness | 4.080 | 0.04620 | |
Length | 150.1 | 0.05350 | |
Side Print 100% Infill | Width | 10.36 | 0.1398 |
Thickness | 4.168 | 0.06410 | |
Length | 149.8 | 0.4611 | |
Flat Print 75% Infill | Width | 10.11 | 0.03460 |
Thickness | 4.190 | 0.02440 | |
Length | 150.0 | 0.1447 | |
Side Print 75% Infill | Width | 10.30 | 0.09470 |
Thickness | 3.992 | 0.06450 | |
Length | 150.1 | 0.1651 |
The recorded average for all four specimens' forces displacement graph and stress strain graph can be seen in Figures 12-14. It can be demonstrated that all the samples behave in a linear manner to the points of YS, but as the specimens enter the region of plastic deformation, the specimens start to fail, the mean average stress readings have removed the data of failed specimens to continue a trend line of results. The point of failure of the specimens is shown by a sharp decrease in forces or stress respectively shown by a cross or dot in Figure 13. The specimen with the greatest UTS is that of the side print with a 100% infill, whereas the specimen with the lowest UTS is that of the side print with an infill of 75%. The points of the YS and UTS found in the specimens can be seen in Figure 14, this graph shows a clear representation of the points of maximum mean average stress, these points can also be seen in Table 9. The accompanying error bars are derived from the standard deviation calculated by the differences between strain and stress respectively.
PLA Sample properties | Yield Load [N] | Ultimate Tensile Load [N] | Yield Stress [MPa] | Ultimate Tensile Stress [MPa] |
Flat Print 100% Infill | 2199 | 2247 | 50.93 | 52.03 |
Flat Print 75% Infill | 1326 | 1375 | 32.23 | 33.42 |
Side Print 100% Infill | 2225 | 2291 | 53.54 | 55.14 |
Side Print 75% Infill | 1234 | 1271 | 32.23 | 30.00 |
In Tables 3-5 the stresses and local displacement found in the augmented femur following the work of Newcombe et al. can be identified. The results are compared to that of a simple femur model data in the same simulation seen in Table 6. It has been shown that both the vertical and horizontal (side and flat fitted) simulated ITAP models, when at an infill of 100%, have the lowest stresses and displacements in each caseload, except for caseload F3, as at 100% infill there is less flexibility in the modal making the stress more prominent in the simulation, in comparison to a lower infill (Figure 17).
As the infill percentage increases from 25% to 100%, the σmax in each simulation was found to decrease, except for the stress recorded at F3 for an infill of 100%, which increased after its minimum stress value at 75% infill. The other exception is that an infill of 50% produced stresses greater than an original infill of 25% when studying F1 and F2. Regarding the similarities in stress and displacements produced by the loads F1 and F3 for the flat and side fitted ITAP models, the values were found to be the same; this is due to the geometry of the ITAP not changing with respect to the forces being applied. However, the stresses found in the vertical models is considerably higher than that of their horizontal counterparts, most notably when working with caseload F2. This is concordant with the work of Tanoto et al. [22], which as discussed, proved that a vertical printed specimen has a considerably weaker ultimate tensile load and consequently would have poor stress distribution.
Figures 15-17 show the changes in stress for both the vertical and horizontal variations of simulated specimens. However, these are only simulations of the acting forces of movement; many forces are applied in this motion that have not been utilized in the simulations, such as the pressure of the muscles surrounding the femur. The values produced by F1-F3 are greater in the augmented femur simulations than the simulations that generate the stress for a standard ‘healthy femur’. This is expected, as the inclusion of a stress raiser from an amputation and ITAP insert would increase the stress in simulations of the femur. As the augmented femur's geometry has changed to incorporate the complex design of the ITAP, all positions of the forces (F1-F3) have moved to the head of the ITAP, excluding the weight of the user which is applied to the base of the femur (Figure 10).
The values generated from these simulations following the method of Newcombe et al. are different from the published data. Differences in density and material properties used for simulation of the femur account for this variation. It has also been determined that out of the two possible horizontal prints, side or flat (Figure 7), a side printed sample can hold a greater applied load before failure occurs this being at an infill of 100%. By lowering the infill percentage, the load needed for failure decreases drastically. The inference from this is that the ITAP is more likely to fail as material if removed from it internally. This is consequently perceived as a cause of critical failure for the devices, and a minimum limit for the infill percentage should be set to reduce the possibility of ITAP failure in day to day use.
The result of this limitation would depend on the material used for the ITAP, as the properties of the material influence the bonding ability between fused layers and its biocompatibility when considered for use in the human body. A material with such characteristics is titanium [25]. This would allow a higher mechanical strength at a lower infill percentage for the ITAP. Titanium is suitable for the use of the ITAP because the fusion between layers is much stronger then than that found in PLA samples, because a greater heat is applied fusing the metal layers together. Titanium is traditionally printed using indirect metal laser sintering (DMLS) [26] which is an additive manufacturing layer base process. PLA is inadequate as a material for the ITAP because the material is not strong enough between infill layers for intense loading. PLA is also not always biocompatible with organic tissue found within bone or muscle, because PLA needs sterilisation and chemical processing when used for medical operations [27].
Consistency of results is essential for the ITAP to succeed as a medical device. It can be seen in Figures 15-17 that the testing of the ISO 527 specimens had inconsistent points of failure within the region of plastic deformation. These results indicate error in the process of production; this error is the effect of Ultimaker 2+ not having a constant temperature across the working heat bed. Because of this, samples that have been printed away from the centre of the heating element have not had a consistent fusion between layers, resulting in errors. However, the region that is consistent in data collection is the elastic region of deformation. This is the region where deformation is not permanent. As such it is prudent that this is the area that has a greater repeatability, because permanent deformation would cause interior and exterior problems to the user of the ITAP. A warped ITAP would not distribute load correctly, potentially rendering the ITAP useless.
An additional point to consider before the use of a layer base printed ITAP is the effect of the bonding between the layers. The simulations assume one solid model for the ITAP, whereas in practice the ITAP has been constructed from many layers fused together. Such a difference in the ITAP's characteristics would alter the stresses found under load. However, this would be only a small discrepancy as the machinery used for this level of manufacturing is extremely accurate in bonding between layers.
In this paper, the optimum orientation and infill percentage of layer base production have been studied, to produce the medical prosthetic device known as the intraosseous transcutaneous amputation prosthesis. The use of layer base production methods can be used to make a bespoke ITAP suited for the user's lifestyle needs. The research found the following.
• A test specimen being printed can withstand a greater load before failure when printed on a side orientation, with an infill percentage of 100%. This has been derived by the testing of the ISO 527 tensile test specimens and is verified by the simulations following the methodology of Newcombe et al.
• It has been identified that a simulated model, printed on a horizontal bed and fitted with a side orientation (Figure 14) produced the least stress, except for caseload F3. These simulations quantified the σmax detected under loads associated with walking.
When considering the use and surgical insertion of layer base printed ITAPs, further data on both the patient's femur, using CT scanning, as well as data collection from the patient regarding their lifestyle is needed. This will allow a bespoke ITAP to be produced using layer base production methods, ensuring that the ITAP can meet the individual's needs. For this process to happen, further research, using the ISO 527 standards, is needed in tensile testing of the material selected for use in the ITAP. This is crucial as such testing will validate the simulations following the work of Newcombe et al. and allow dedicated designs whereby orientation and infill percentage is optimized for the ITAP, to match each individual user's lifestyle. If the resulting analysis of the further testing, shows that a conventional test sample, produced by tooling process, is more suited to load distribution than layer base production. Other processes are available for use, such as bulk machining but they do not possess the same ability to produce a bespoke interior design.
The authors would like to acknowledge the support of the Advanced Sustainable Manufacturing Technologies (ASTUTE 2022) project, which is partly funded from the EU's European Regional Development Fund through the Welsh European Funding Office, in enabling the research upon which this paper is based. Further information on ASTUTE can be found at www.astutewales.com.
The authors of this paper declare no conflicts of interest in this paper.
[1] |
Pendegrass CJ, Goodship AE, Price JS, et al. (2006) Natures answer to breaching the skin barrier: An innovative development for amputees. J Anat 209: 59–67. doi: 10.1111/j.1469-7580.2006.00595.x
![]() |
[2] |
Li Y, Brånemark R (2017) Osseointegrated prostheses for rehabilitation following amputation. Der Unfallchirurg 120: 285–292. doi: 10.1007/s00113-017-0331-4
![]() |
[3] |
Zhang M, Turner-Smith A, Roberts V, et al. (1996) Frictional action at lower limb/prosthetic socket interface. Med Eng Phys 18: 207–214. doi: 10.1016/1350-4533(95)00038-0
![]() |
[4] | Fitzpatrick N, Smith TJ, Pendegrass CJ, et al. (2011) Intraosseous Transcutaneous Amputation Prosthesis (ITAP) for limb salvage in 4 dogs. Vet Surg 40: 909–925. |
[5] |
Kang NV, Morritt D, Pendegrass C, et al. (2013) Use of ITAP implants for prosthetic reconstruction of extra-oral craniofacial defects. J Plast Reconstr Aesthet Surg 66: 497–505. doi: 10.1016/j.bjps.2012.11.036
![]() |
[6] |
Sullivan J, Uden M, Robinson KP, et al. (2003) Rehabilitation of the trans femoral amputee with an osseointegrated prosthesis: The United Kingdom experience. Prosthet Orthot Int 27: 114–120. doi: 10.1080/03093640308726667
![]() |
[7] |
Deng L, Deng Y, Xie K (2017) AgNPs-decorated 3D printed PEEK implant for infection control and bone repair. Colloid Surface B 160: 483–492. doi: 10.1016/j.colsurfb.2017.09.061
![]() |
[8] | Duraiselvam M (2012) Laser surface modification of metals for liquid impingement erosion resistance. Laser Surf Modification Alloy Corros Erosion Resis 2012: 155–176. |
[9] | Overview of biomaterials and their use in medical devices. (2018) Available from: https://www.asminternational.org/documents/10192/1849770/06974G_Chapter_1.pdf |
[10] |
Chen Y, Frith JE, Dehghan-Manshadi A, et al. (2017) Mechanical properties and biocompatibility of porous titanium scaffolds for bone tissue engineering. J Mech Behav Biomed 75: 169–174. doi: 10.1016/j.jmbbm.2017.07.015
![]() |
[11] |
Newcombe L, Dewar M, Blunn G, et al. (2013) Effect of amputation level on the stress transferred to the femur by an artificial limb directly attached to the bone. Med Eng Phys 35: 1744–1753. doi: 10.1016/j.medengphy.2013.07.007
![]() |
[12] | GrabCAD-CAD library. Available from: https://grabcad.com/library/femur-bone-2. |
[13] | Yousif A, Aziz MY (2012) Biomechanical analysis of the human femur bone during normal walking and standing up. IOSR J Eng 02: 13–19. |
[14] | Ahuja M (1969) Normal variation in the density of selected human bones in North India. J Bone Joint Surg Br 51: 719–735. |
[15] |
Yeni Y, Brown C, Norman T (1998) Influence of bone composition and apparent density on fracture toughness of the human femur and tibia. Bone 22: 79–84. doi: 10.1016/S8756-3282(97)00227-5
![]() |
[16] | Anyone has cancelous bone material file? Bill of Materials Discussions. Available from: https://forum.solidworks.com/thread/189281. |
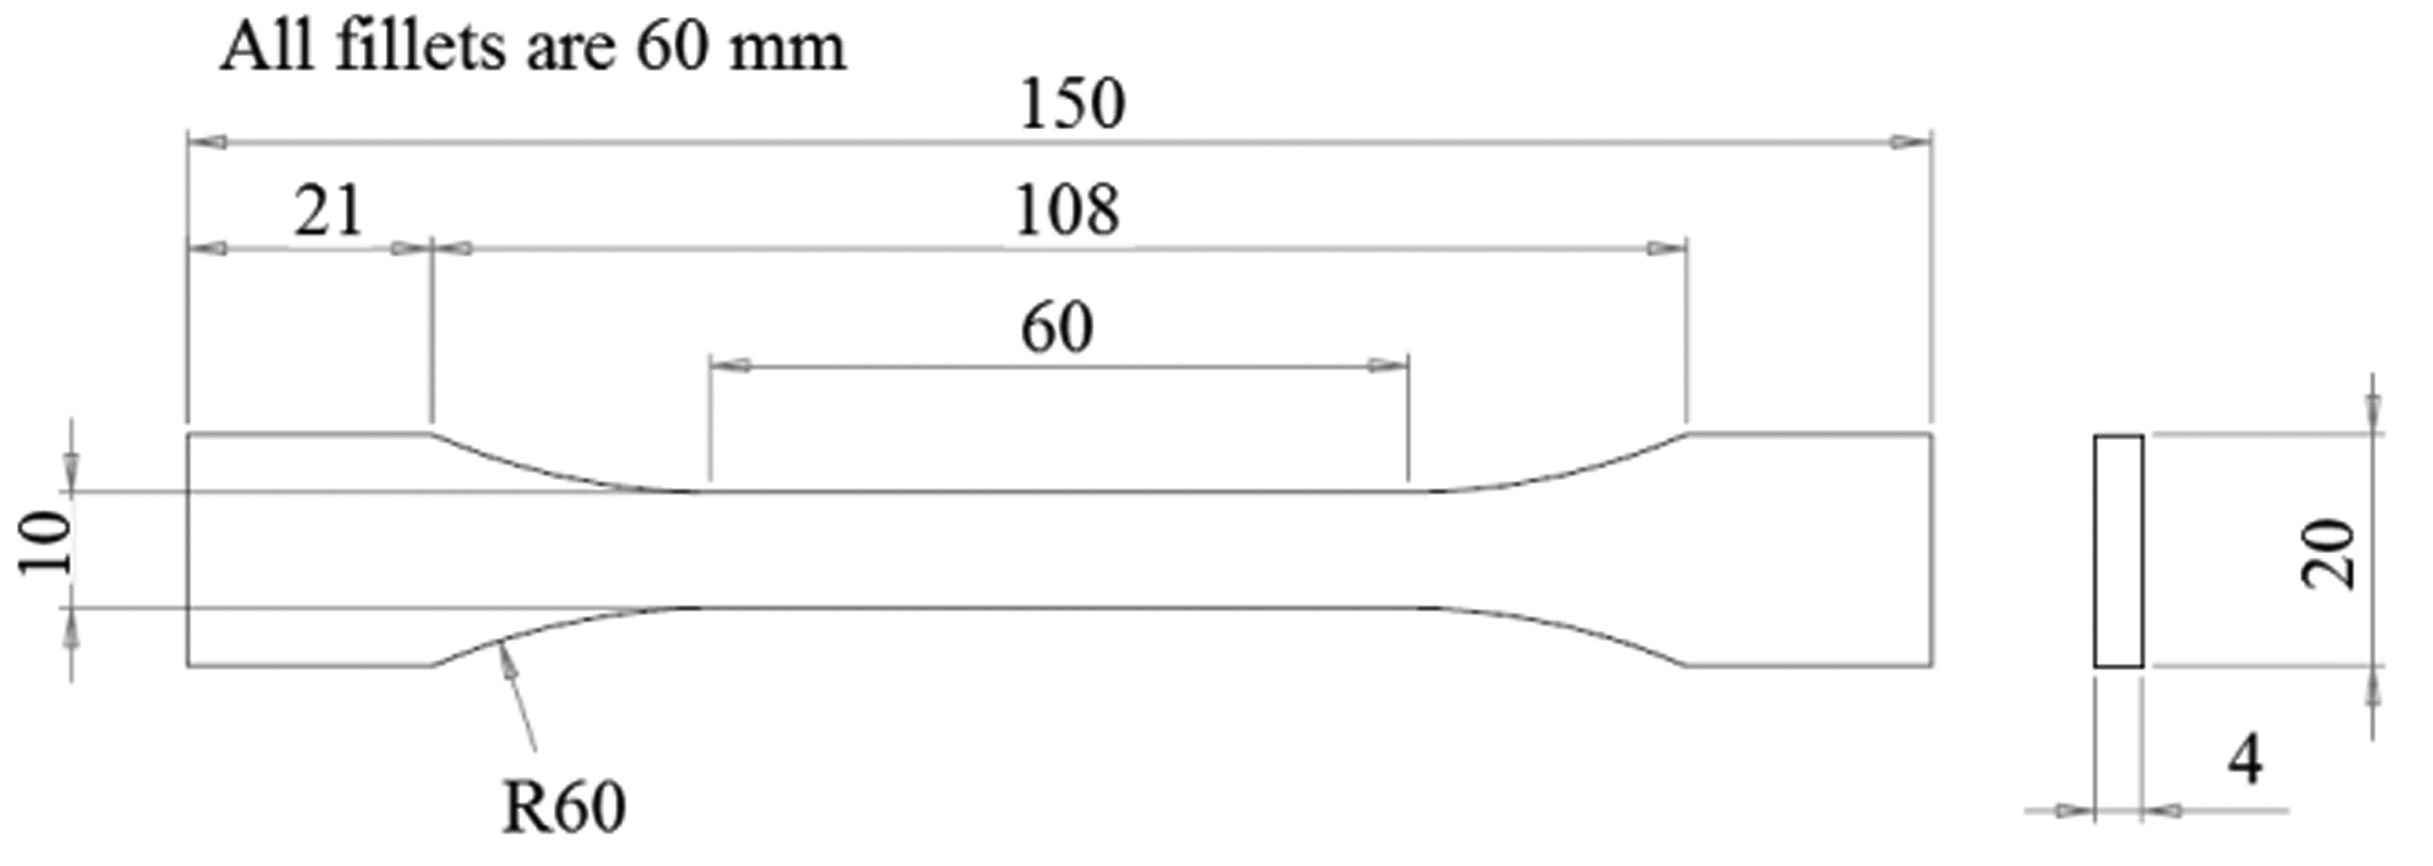
[17] | Plastics - Determination of tensile properties - Part 2: Test conditions for moulding and extrusion plastics. BS EN ISO 527-2:2012. |
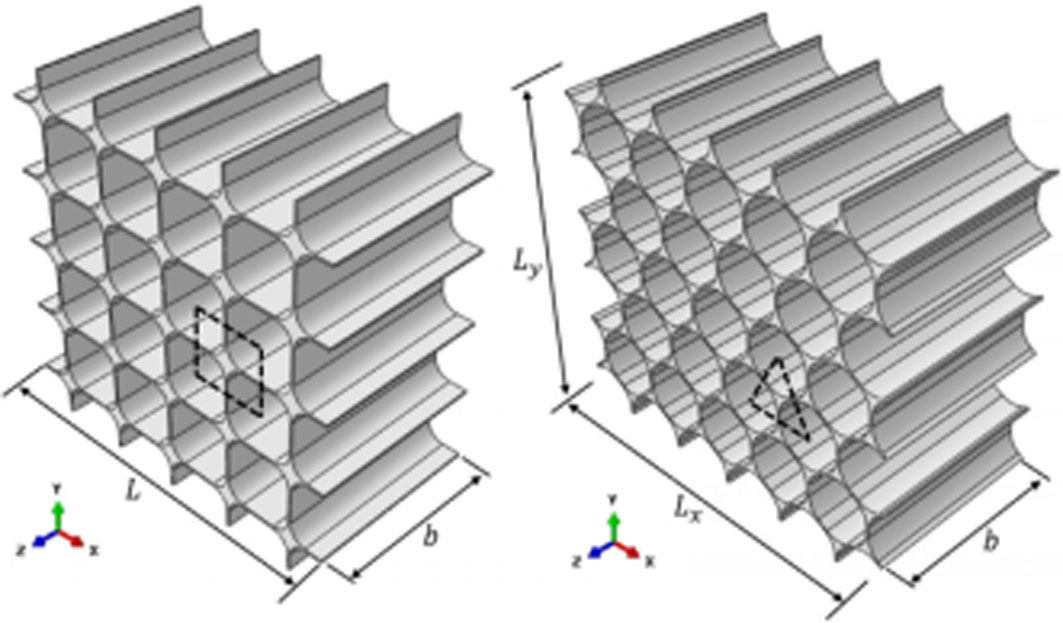
[18] | Tiwari G, Thomas T, Khandelwal R (2017) Influence of reinforcement in the honeycomb structures under axial compressive load. Thin Wall Struct. |
[19] |
Duan S, Tao Y, Lei H, et al. (2018) Enhanced out-of-plane compressive strength and energy absorption of 3D printed square and hexagonal honeycombs with variable-thickness cell edges. Extreme Mech Lett 18: 9–18. doi: 10.1016/j.eml.2017.09.016
![]() |
[20] |
Chen Y, Li T, Jia Z, et al. (2018) 3D printed hierarchical honeycombs with shape integrity under large compressive deformations. Mater Design 137: 226–234. doi: 10.1016/j.matdes.2017.10.028
![]() |
[21] |
Hosseinabadi HG, Bagheri R, Gray LA, et al. (2017) Plasticity in polymeric honeycombs made by photo-polymerization and nozzle based 3D-printing. Polym Test 63: 163–167. doi: 10.1016/j.polymertesting.2017.08.008
![]() |
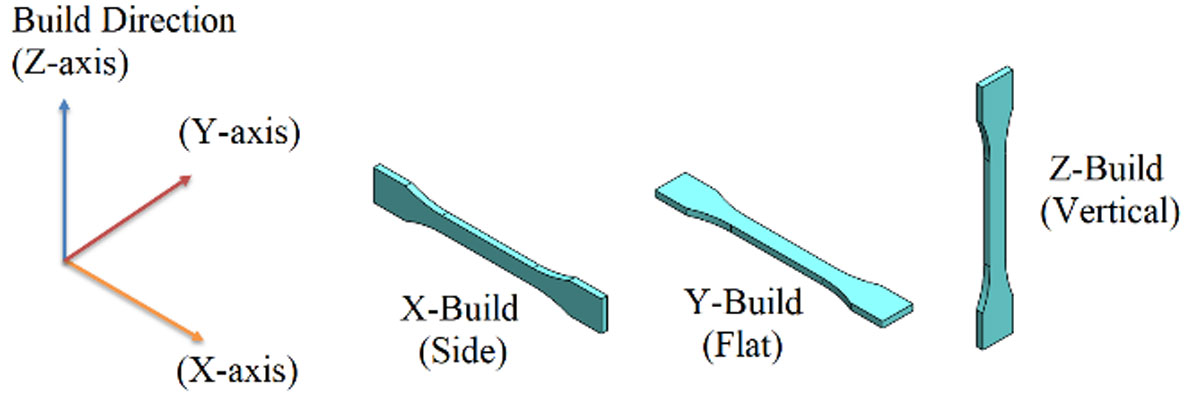
[22] | Tanoto YY, Anggono J, Siahaan IH, et al. (2017) The effect of orientation difference in fused deposition modeling of ABS polymer on the processing time, dimension accuracy, and strength. Int Conf Eng 2017: 030051. |
[23] | Skeletal System: Bones, Joints, Cartilage, Ligaments, Bursae. Health Pagesorg Anatomy Surgery Pregnancy Nutrition Fitness. Available from: https://www.healthpages.org/anatomy-function/musculoskeletal-system-bones-joints-cartilage-ligaments/. |
[24] | Healthfully, 2018. Available from: https://healthfully.com/do-ligaments-do-skeletal-system-5757453.html. |
[25] |
Bose S, Banerjee D, Shivaram A, et al. (2018) Calcium phosphate coated 3D printed porous titanium with nanoscale surface modification for orthopedic and dental applications. Mater Design 151: 102–112. doi: 10.1016/j.matdes.2018.04.049
![]() |
[26] |
Nicoletto G (2018) Directional and notch effects on the fatigue behavior of as-built DMLS Ti6Al4V. Int J Fatigue 106: 124–131. doi: 10.1016/j.ijfatigue.2017.10.004
![]() |
[27] |
Ramot Y, Haim-Zada M, Domb AJ, et al. (2016) Biocompatibility and safety of PLA and its copolymers. Adv Drug Deliver Rev 107: 153–162. doi: 10.1016/j.addr.2016.03.012
![]() |
1. | Euan Langford, Christian Andrew Griffiths, Andrew Rees, Josh Bird, The Micro Topology and Statistical Analysis of the Forces of Walking and Failure of an ITAP in a Femur, 2021, 12, 2072-666X, 298, 10.3390/mi12030298 | |
2. | Joshua Bird, Euan Langford, Christian Griffiths, A study into the fracture control of 3D printed intraosseous transcutaneous amputation prostheses, known as ITAPs, 2020, 7, 2375-1495, 29, 10.3934/bioeng.2020003 | |
3. | Amirhossein Asfia, Basaula Deepak, James I Novak, Bernard Rolfe, Tomas Kron, Infill selection for 3D printed radiotherapy immobilisation devices, 2020, 6, 2057-1976, 065014, 10.1088/2057-1976/abb981 | |
4. | S. I. S. Shaharuddin, M. N. I. Asha'ari, A. A. Nordin, N. A. Sukindar, 2023, 2753, 0094-243X, 050078, 10.1063/5.0116521 | |
5. | Peter Maroti, Adam Tibor Schlegl, Balint Nagy, Luca Toth, Peter Bogar, Gergo Jozsa, Szilard Rendeki, Shadpour Mallakpour, Chaudhery Mustansar Hussain, 2024, 9780323953832, 179, 10.1016/B978-0-323-95383-2.00028-7 |
Ultimate Tensile strength | Elastic Modulus | Shear Modulus | Poisson's Ratio |
49 Mpa | 2029.4 MPa | 4.69 GPa | 0.4 |
Shear Stress | Compressive strength | Density [ρ] | |
65 MPa | 131 MPa | 1.3712 g/cm3 |
Control Variables for ISO printing of test specimen: | |||
Layer Height | 0.1 mm | Gradual Infill Steps | 0 |
Top/Bottom Thickness | 0.8 mm | Generate Support | Yes |
Infill Pattern | Tri-Hexagonal | Plate Adhesion Type | Brim |
Support Placement | Everywhere | Brim Width | 10 mm |
Temperature of bed | 60'C | Temperature of Extruder | 200'C |
Infill percentages of ITAP model | ||||
Load | 25% | 50% | ||
Stress [MPa] | Displacement [mm] | Stress [MPa] | Displacement [mm] | |
F1 | 152.02 | 1.0746 | 57.132 | 1.0596 |
F2 | 4729.4 | 147 | 5996.9 | 250.34 |
F3 | 1.8118 | 1.34E-02 | 1.0544 | 2.25E-03 |
Infill percentages of ITAP module | ||||
Load | 75% | 100% | ||
Stress [MPa] | Displacement [mm] | Stress [MPa] | Displacement [mm] | |
F1 | 82.039 | 1.059 | 9.365 | 1.0546 |
F2 | 1615.2 | 424.08 | 109.6 | 424.433 |
F3 | 0.330141 | 0.0048445 | 0.6095 | 0.2287 |
Infill percentages of ITAP module | ||||
Load | 25% | 50% | ||
Stress [MPa] | Displacement [mm] | Stress [MPa] | Displacement [mm] | |
F1 | 44.474 | 1.0978 | 22.836 | 0.94148 |
F2 | 763.32 | 429.76 | 379.99 | 421.83 |
F3 | 0.19065 | 5.54E-03 | 0.06702 | 1.93E-03 |
Infill percentages of ITAP module | ||||
Load | 75% | 100% | ||
Stress [MPa] | Displacement [mm] | Stress [MPa] | Displacement [mm] | |
F1 | 14.728 | 1.0526 | 9.365 | 1.0546 |
F2 | 296.98 | 420.76 | 109.6 | 424.433 |
F3 | 0.111243 | 3.76E-03 | 0.60951 | 0.2287 |
Infill percentages of ITAP module | ||||
Case Load | 25% | 50% | ||
Resulting Max Stress [MPa] | Resulting Max Displacement [mm] | Resulting Max Stress [MPa] | Resulting Max Displacement [mm] | |
F1 | 44.47 | 1.097 | 22.83 | 0.9414 |
F2 | 727.4 | 435.8 | 237.5 | 191 |
F3 | 0.1906 | 5.54E-03 | 0.06702 | 1.93E-03 |
Infill percentages of ITAP module | ||||
Case Load | 75% | 100% | ||
Resulting Max Stress [MPa] | Resulting Max Displacement [mm] | Resulting Max Stress [MPa] | Resulting Max Displacement [mm] | |
F1 | 14.72 | 1.052 | 9.365 | 1.054 |
F2 | 389.8 | 326.3 | 109.6 | 424.4 |
F3 | 0.1112 | 3.76E-03 | 0.6095 | 0.2287 |
Case Load | |||
Simulated output | F1 | F2 | F3 |
Resulting Max Stress [MPa] | 1.421 | 34.08 | 0.004671 |
Resulting Max Displacement [mm] | 2.863 | 833.9 | 0.007448 |
PLA Sample properties | Yield Load [N] | Ultimate Tensile Load [N] | Yield Stress [MPa] | Ultimate Tensile Stress [MPa] |
Flat Print 100% Infill | 2048 | 2122 | 51.41 | 53.06 |
Flat Print 75% Infill | 1293 | 1330 | 31.87 | 33.27 |
Flat Print 50% Infill | 1151 | 1170 | 28.97 | 29.25 |
Flat Print 25% Infill | 960.0 | 1000 | 22.45 | 25.00 |
Side Print 100% Infill | 2100 | 2196 | 52.81 | 54.91 |
Side Print 75% Infill | 1124 | 1159 | 27.91 | 28.97 |
Side Print 50% Infill | 885.8 | 931.6 | 22.75 | 23.29 |
Side Print 25% Infill | 763.3 | 803.3 | 19.43 | 20.08 |
Sample properties | Average [mm] | Standard Deviation [σ] | |
Flat Print 100% Infill | Width | 10.18 | 0.02030 |
Thickness | 4.080 | 0.04620 | |
Length | 150.1 | 0.05350 | |
Side Print 100% Infill | Width | 10.36 | 0.1398 |
Thickness | 4.168 | 0.06410 | |
Length | 149.8 | 0.4611 | |
Flat Print 75% Infill | Width | 10.11 | 0.03460 |
Thickness | 4.190 | 0.02440 | |
Length | 150.0 | 0.1447 | |
Side Print 75% Infill | Width | 10.30 | 0.09470 |
Thickness | 3.992 | 0.06450 | |
Length | 150.1 | 0.1651 |
PLA Sample properties | Yield Load [N] | Ultimate Tensile Load [N] | Yield Stress [MPa] | Ultimate Tensile Stress [MPa] |
Flat Print 100% Infill | 2199 | 2247 | 50.93 | 52.03 |
Flat Print 75% Infill | 1326 | 1375 | 32.23 | 33.42 |
Side Print 100% Infill | 2225 | 2291 | 53.54 | 55.14 |
Side Print 75% Infill | 1234 | 1271 | 32.23 | 30.00 |