With growing global population aging, Alzheimer's disease (AD) poses a severe public health threat. Mild cognitive impairment (MCI), a subtle transitional state between normal cognition and AD, exhibits substantial heterogeneity and hinders accurate early diagnosis. This study aimed to resolve MCI heterogeneity via a multimodal data fusion approach for reliable subtype identification. Integrating clinical scores, genetic profiles, biomarkers, and structural magnetic resonance imaging (sMRI) data from the Alzheimer's disease neuroimaging initiative (ADNI) database, we constructed a standardized multimodal dataset for model development and validation. On the basis of the original Ordinary graph-based deep temporal clustering (OG-DTC) model, we incorporated an attention mechanism and optimized the loss function to establish an improved Attention-OG-DTC model. Five-fold cross-validation verified that Attention-OG-DTC outperformed the original model in silhouette coefficient and Davies-Bouldin index (DBI). Two distinct MCI subtypes were identified. Subtype 1 showed severer baseline cognitive impairment and broader cerebral atrophy, with significantly faster AD progression and poorer longitudinal prognosis ($ p\leq0.001 $, log-rank test). shapley additive explanations (SHAP) analysis further determined key covariates governing subtype differentiation. This data-driven stratification reveals prominent MCI heterogeneity, providing credible evidence for the continuous and heterogeneous nature of the AD spectrum. The proposed method facilitates early refined screening and stratified intervention for AD.
Citation: Yueli Chen, Taihe Yu, Hui Chang. Subtype identification of Alzheimer's disease based on multimodal fusion and deep clustering[J]. Big Data and Information Analytics, 2026, 10: 308-337. doi: 10.3934/bdia.2026016
With growing global population aging, Alzheimer's disease (AD) poses a severe public health threat. Mild cognitive impairment (MCI), a subtle transitional state between normal cognition and AD, exhibits substantial heterogeneity and hinders accurate early diagnosis. This study aimed to resolve MCI heterogeneity via a multimodal data fusion approach for reliable subtype identification. Integrating clinical scores, genetic profiles, biomarkers, and structural magnetic resonance imaging (sMRI) data from the Alzheimer's disease neuroimaging initiative (ADNI) database, we constructed a standardized multimodal dataset for model development and validation. On the basis of the original Ordinary graph-based deep temporal clustering (OG-DTC) model, we incorporated an attention mechanism and optimized the loss function to establish an improved Attention-OG-DTC model. Five-fold cross-validation verified that Attention-OG-DTC outperformed the original model in silhouette coefficient and Davies-Bouldin index (DBI). Two distinct MCI subtypes were identified. Subtype 1 showed severer baseline cognitive impairment and broader cerebral atrophy, with significantly faster AD progression and poorer longitudinal prognosis ($ p\leq0.001 $, log-rank test). shapley additive explanations (SHAP) analysis further determined key covariates governing subtype differentiation. This data-driven stratification reveals prominent MCI heterogeneity, providing credible evidence for the continuous and heterogeneous nature of the AD spectrum. The proposed method facilitates early refined screening and stratified intervention for AD.

| [1] |
Gauthier S, Reisberg B, Zaudig M, Petersen RC, Ritchie K, Broich K, et al. (2006) Mild cognitive impairment. Lancet 367: 1262–1270. https://doi.org/10.1016/S0140-6736(06)68542-5 doi: 10.1016/S0140-6736(06)68542-5
|
| [2] |
Mitchell AJ, Shiri-Feshki M (2009) Rate of progression of mild cognitive impairment to dementia–-meta-analysis of 41 robust inception cohort studies. Acta Psychiatr Scand 119: 252–265. https://doi.org/10.1111/j.1600-0447.2008.01326.x doi: 10.1111/j.1600-0447.2008.01326.x
|
| [3] |
Albert MS, DeKosky ST, Dickson D, Dubois B, Feldman HH, Fox NC, et al. (2011) The diagnosis of mild cognitive impairment due to Alzheimer's disease: Recommendations from the National Institute on Aging-Alzheimer's Association workgroups on diagnostic guidelines for Alzheimer's disease. Alzheimer's Dementia 7: 270–279. https://doi.org/10.1016/j.jalz.2011.03.008 doi: 10.1016/j.jalz.2011.03.008
|
| [4] |
Pourzinal D, Yang JHJ, Byrne GJ, O'Sullivan JD, Mitchell L, McMahon KL, et al. (2020) Identifying subtypes of mild cognitive impairment in Parkinson's disease using cluster analysis. J Neurol 267: 3213–3222. https://doi.org/10.1007/s00415-020-09977-z doi: 10.1007/s00415-020-09977-z
|
| [5] |
Ryoo HG, Choi H, Shi K, Rominger A, Lee DY, Lee DS, et al. (2024) Distinct subtypes of spatial brain metabolism patterns in Alzheimer's disease identified by deep learning-based FDG PET clusters. Eur J Nucl Med Mol Imaging 51: 443–454. doilinkhttps://doi.org/10.1007/s00259-023-06440-9 doi: 10.1007/s00259-023-06440-9
|
| [6] |
Chen R, Herskovits EH, for the Alzheimer's Disease Neuroimaging Initiative (2022) Machine learning detects distinct subtypes of minimal cognitive impairment. J Sign Process Syst 94, 437–443. https://doi.org/10.1007/s11265-021-01667-x |
| [7] |
Edmonds EC, McDonald CR, Marshall A, Thomas KR, Eppig J, Eppig AJ, et al. (2019) Early versus late MCI: Improved MCI staging using a neuropsychological approach. Alzheimer's Dementia 15: 699–708. https://doi.org/10.1016/j.jalz.2018.12.009 doi: 10.1016/j.jalz.2018.12.009
|
| [8] |
Sindhu TS, Kumaratharan N, Anandan P (2024) Hybrid optimized deep fuzzy clustering-based segmentation and Deep Maxout Network for Alzheimer's disease classification. Biomed Signal Process Control 93: 106118. https://doi.org/10.1016/j.bspc.2024.106118 doi: 10.1016/j.bspc.2024.106118
|
| [9] |
Manouvriez D, Kuchcinski G, Roca V, Sillaire AR, Bertoux M, Delbeuck X, et al. (2025) BrainAGE latent representation clustering is associated with longitudinal disease progression in early-onset Alzheimer's disease. J Neuroradiology 52: 101365. https://doi.org/10.1016/j.neurad.2025.101365 doi: 10.1016/j.neurad.2025.101365
|
| [10] |
Chang CY, Slowiejko D, Win N (2024) Prediction and clustering of Alzheimer's disease by race and sex: A multi-head deep-learning approach to analyze irregular and heterogeneous data. Sci Rep 14: 26668. https://doi.org/10.1038/s41598-024-77829-1 doi: 10.1038/s41598-024-77829-1
|
| [11] |
Ribino P, Di Napoli C, Paragliola G, Chicco D, Gasparini F (2025) Multivariate longitudinal clustering reveals neuropsychological factors as dementia predictors in an Alzheimer's disease progression study. BioData Min 18: 26. https://doi.org/10.1186/s13040-025-00441-0 doi: 10.1186/s13040-025-00441-0
|
| [12] |
Jiao CN, Shang J, Li F, Cui X, Wang YL, Gao YL, et al. (2024) Diagnosis-guided deep subspace clustering association study for pathogenetic markers identification of Alzheimer's disease based on comparative atlases. IEEE J Biomed Health Inf 28: 3029–3041. https://doi.org/10.1109/JBHI.2024.3372294 doi: 10.1109/JBHI.2024.3372294
|
| [13] |
Wang R, Gao L, Zhang X, Han J (2024) SVFR: A novel slice-to-volume feature representation framework using deep neural networks and a clustering model for the diagnosis of Alzheimer's disease. Heliyon 10: e23008. https://doi.org/10.1016/j.heliyon.2023.e23008 doi: 10.1016/j.heliyon.2023.e23008
|
| [14] |
Wang D, Ma X, Schulz PE, Jiang X, Kim Y, (2024) Clinical outcome-guided deep temporal clustering for disease progression subtyping. J Biomed Inf 158: 104732. https://doi.org/10.1016/j.jbi.2024.104732 doi: 10.1016/j.jbi.2024.104732
|
| [15] |
Baytaş İM (2024) Predicting progression from mild cognitive impairment to Alzheimer's dementia with adversarial attacks. IEEE J Biomed Health Inf 28: 3750–3761. https://doi.org/10.1109/JBHI.2024.3373703 doi: 10.1109/JBHI.2024.3373703
|
| [16] |
Hou B, Wen Z, Bao J, Zhang R, Tong B, Yang S, et al. (2024) Interpretable deep clustering survival machines for Alzheimer's disease subtype discovery. Med Image Anal 97: 103231. https://doi.org/10.1016/j.media.2024.103231 doi: 10.1016/j.media.2024.103231
|
| [17] |
Jack Jr CR, Bernstein MA, Fox NC, Thompson P, Alexander G, Harvey D, et al. (2008) The Alzheimer's disease neuroimaging initiative (ADNI): MRI methods. J Magn. Reson Imaging 27: 685–691. https://doi.org/10.1002/jmri.21049 doi: 10.1002/jmri.21049
|
| [18] |
Mueller SG, Weiner MW, Thal LJ, Petersen RC, Jack C, Jagust W, et al. (2005) The Alzheimer's disease neuroimaging initiative. Neuroimaging Clin 15: 869–877. https://doi.org/10.1016/j.nic.2005.09.008 doi: 10.1016/j.nic.2005.09.008
|
| [19] |
Weiner MW, Veitch DP, Aisen PS, Beckett LA, Cairns NJ, Green RC, et al. (2017) The Alzheimer's disease neuroimaging initiative 3: Continued innovation for clinical trial improvement. Alzheimer's Dementia 13: 561–571. https://doi.org/10.1016/j.jalz.2016.10.006 doi: 10.1016/j.jalz.2016.10.006
|
| [20] |
McKhann GM, Knopman DS, Chertkow H, Hyman BT, Jack Jr CR, Kawas CH, et al. (2011) The diagnosis of dementia due to Alzheimer's disease: Recommendations from the National Institute on Aging-Alzheimer's Association workgroups on diagnostic guidelines for Alzheimer's disease. Alzheimer's Dementia 7: 263–269. https://doi.org/10.1016/j.jalz.2011.03.005 doi: 10.1016/j.jalz.2011.03.005
|
| [21] |
Petersen RC (2004) Mild cognitive impairment as a diagnostic entity. J Intern Med 256: 183–194. https://doi.org/10.1111/j.1365-2796.2004.01388.x doi: 10.1111/j.1365-2796.2004.01388.x
|
| [22] |
Folstein MF, Folstein SE, McHugh PR (1975) "Mini-mental state": A practical method for grading the cognitive state of patients for the clinician. J Psychiatr Res 12: 189–198. https://doi.org/10.1016/0022-3956(75)90026-6 doi: 10.1016/0022-3956(75)90026-6
|
| [23] |
Morris JC (1993) The clinical dementia rating (CDR) current version and scoring rules. Neurology 43: 2412–2412. https://doi.org/10.1212/WNL.43.11.2412-a doi: 10.1212/WNL.43.11.2412-a
|
| [24] |
Rosen WG, Mohs RC, Davis KL (1984) A new rating scale for Alzheimer's disease. Am J Psychiatry 141: 1356–1364. https://doi.org/10.1176/ajp.141.11.1356 doi: 10.1176/ajp.141.11.1356
|
| [25] |
Fischl B (2012) FreeSurfer. Neuroimage 62: 774–781. https://doi.org/10.1016/j.neuroimage.2012.01.021 doi: 10.1016/j.neuroimage.2012.01.021
|
| [26] |
Friston KJ, Holmes AP, Worsley KJ, Poline JP, Frith CD, Frackowiak RSJ (1994) Statistical parametric maps in functional imaging: A general linear approach. Hum Brain Mapp 2: 189–210. https://doi.org/10.1002/hbm.460020402 doi: 10.1002/hbm.460020402
|
| [27] |
Gaser C, Dahnke R, Thompson PM, Kurth F, Luders E, the Alzheimer's Disease Neuroimaging Initiative (2024) CAT: A computational anatomy toolbox for the analysis of structural MRI data. Gigascience 3: giae049. https://doi.org/10.1093/gigascience/giae049 doi: 10.1093/gigascience/giae049
|
| [28] |
Ashburner J, Friston KJ (2005) Unified segmentation. Neuroimage 26: 839–851. https://doi.org/10.1016/j.neuroimage.2005.02.018 doi: 10.1016/j.neuroimage.2005.02.018
|
| [29] |
Ashburner J (2007) A fast diffeomorphic image registration algorithm. Neuroimage 38: 95–113. https://doi.org/10.1016/j.neuroimage.2007.07.007 doi: 10.1016/j.neuroimage.2007.07.007
|
| [30] |
Mazziotta JC (1995) A probabilistic atlas of the human brain: Theory and rationale for its development: The international consortium for brain mapping (ICBM). Neuroimage 2: 89–101. https://doi.org/10.1006/nimg.1995.1012 doi: 10.1006/nimg.1995.1012
|
| [31] |
Tzourio-Mazoyer N, Landeau B, Papathanassiou D, Crivello F, Etard O, Delcroix N, et al. (2002) Automated anatomical labeling of activations in SPM using a macroscopic anatomical parcellation of the MNI MRI single-subject brain. Neuroimage 15: 273–289. https://doi.org/10.1006/nimg.2001.0978 doi: 10.1006/nimg.2001.0978
|
| [32] |
Rumelhart DE, Hinton GE, Williams RJ (1986) Learning representations by back-propagating errors. Nature 323: 533–536. https://doi.org/10.1038/323533a0 doi: 10.1038/323533a0
|
| [33] |
Lundberg SM, Lee SI (2017) A unified approach to interpreting model predictions. Adv Neural Inf Process Syst 30. |
Figures(14) / Tables(12)

Yueli Chen, Taihe Yu, Hui Chang. Subtype identification of Alzheimer's disease based on multimodal fusion and deep clustering[J]. Big Data and Information Analytics, 2026, 10: 308-337. doi: 10.3934/bdia.2026016

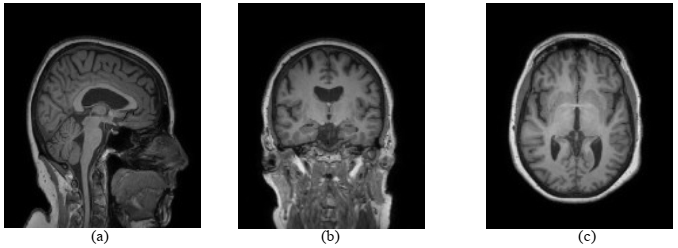
Raw MRI images. (a) Sagittal view; (b) Coronal view; (c) Axial view
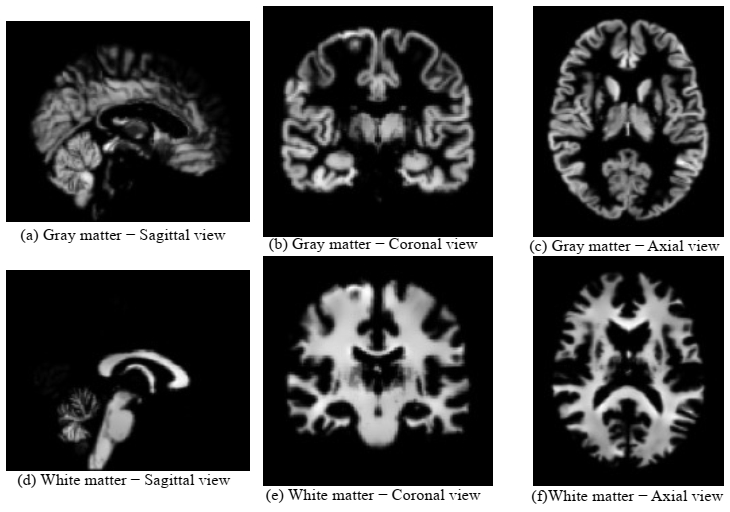
Gray-matter and white-matter images obtained via computational segmentation. (a)(d) Sagittal view; (b)(e) Coronal view; (c)(f) Axial view
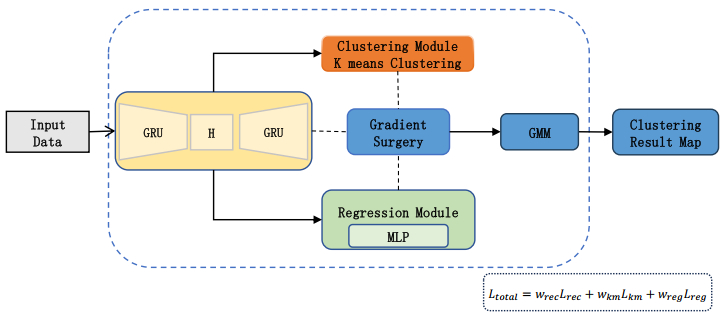
OG-DTC architecture diagram
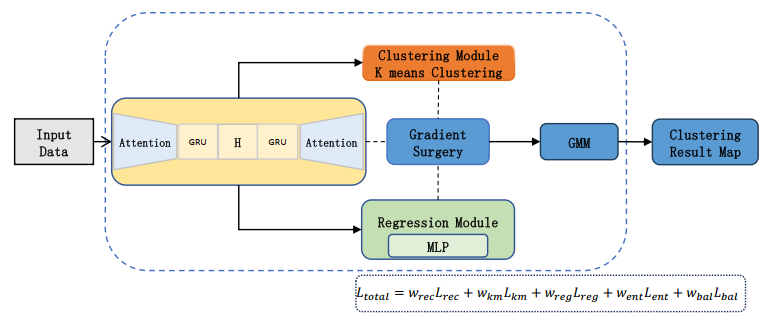
Attention-OG-DTC architecture diagram
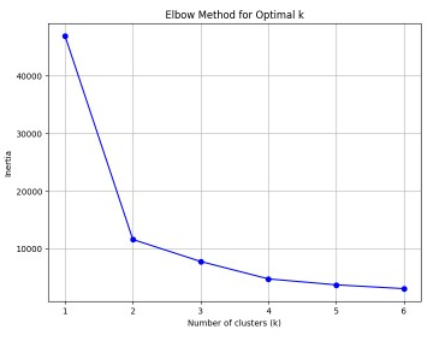
Elbow plot for K-means clustering
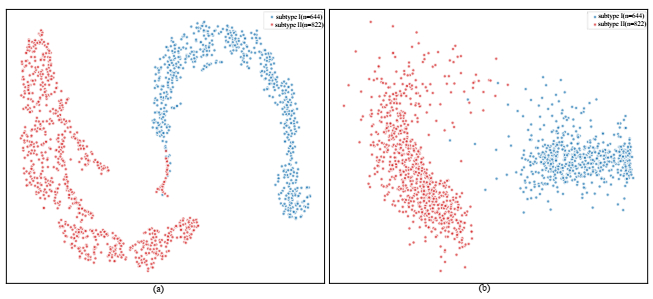
Visualization of OG-DTC clustering results. (a) t-SNE visualization; (b) PCA visualization
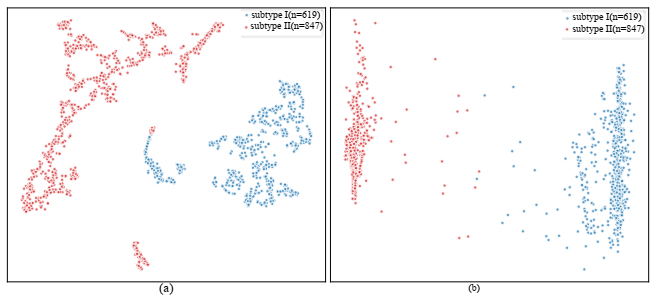
Visualization of clustering results from the improved OG-DTC. (a) t-SNE visualization; (b) PCA visualization
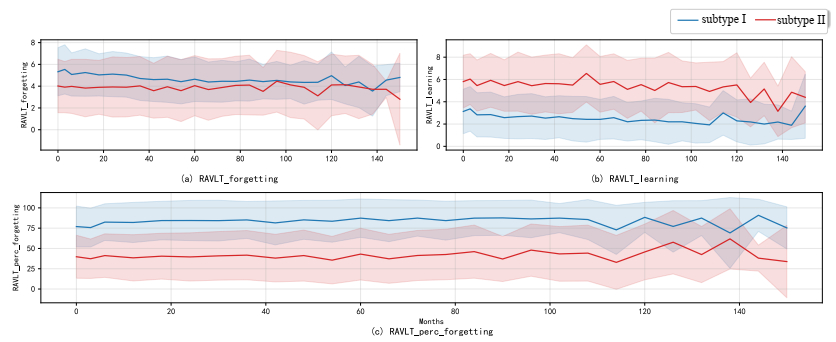
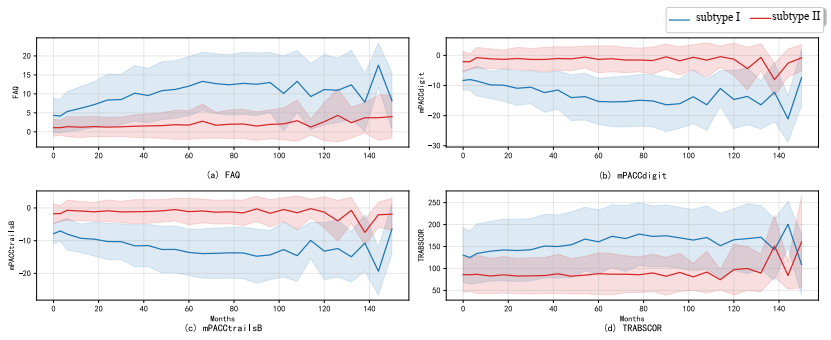
Line charts illustrating longitudinal changes in memory function-related indicators during follow-up
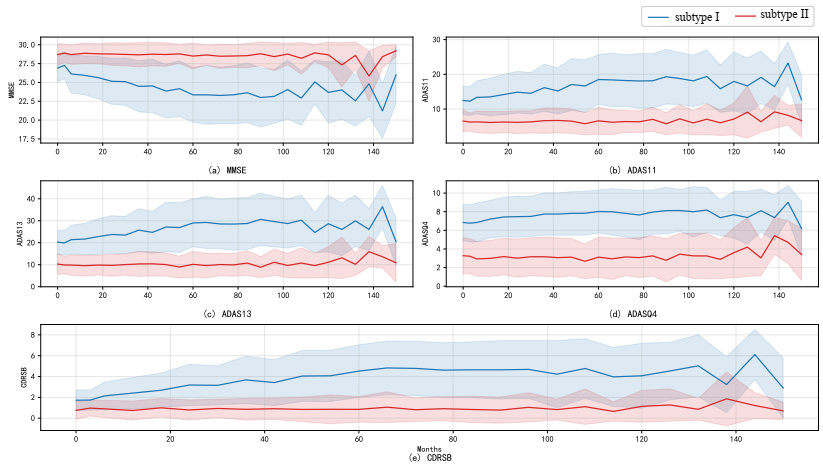
Line chart of indicators related to daily function and executive ability
Line chart showing trajectories of comprehensive cognitive assessment indicators
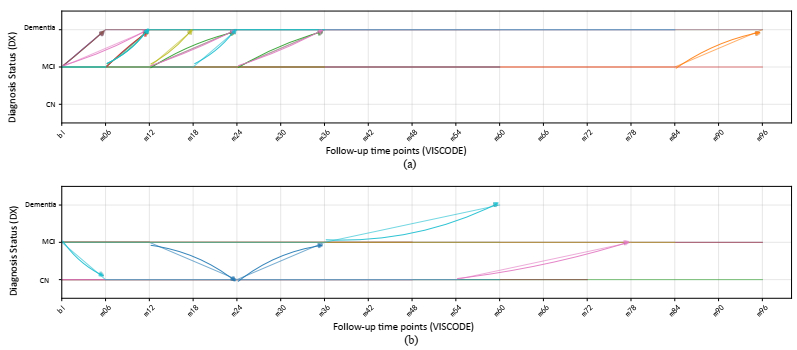
Longitudinal disease state transition trajectories of patients in different clusters. (a) Temporal changes in Subtype Ⅰ; (b) Temporal changes in Subtype Ⅱ
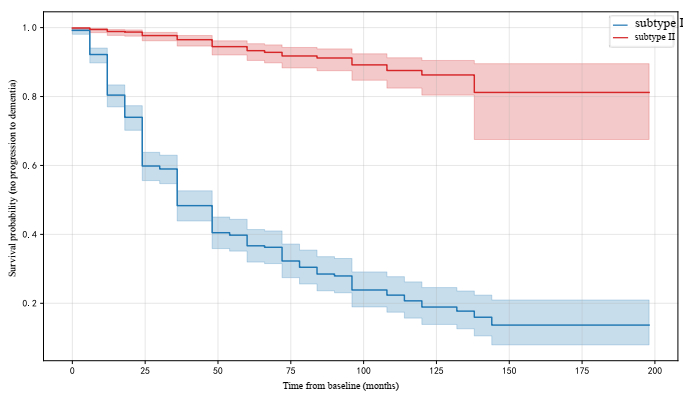
Kaplan-Meier survival curves for distinct clusters (participants with baseline MCI)
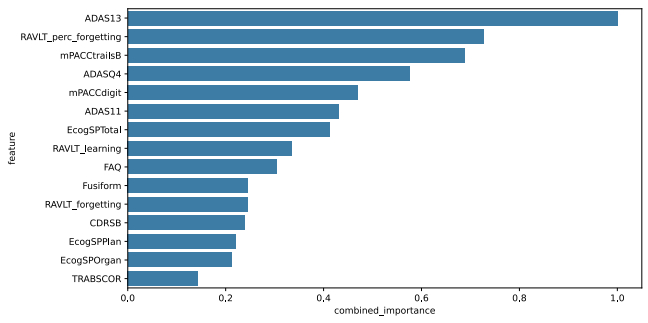
Ranking results of feature importance based on clustering results
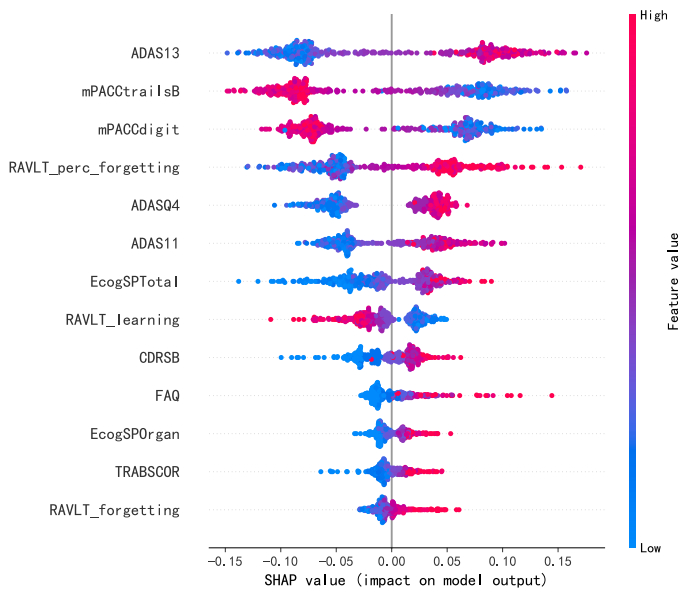
SHAP summary plot of input features. Features on the vertical axis are ranked in descending order of mean absolute SHAP value. The horizontal axis shows SHAP values, and the color gradient encodes feature values (red: high values; blue: low values)





 DownLoad: