Analyzing opinion dynamics in online social networks

  • Published: 01 October 2016
  • In this paper, we examine the challenge of performing analyses of opinion dynamics in online social networks. We present a model for studying the influence exerted by peers within the network, emphasizing the role that skepticism can play with respect to establishing consensus of opinion. From here, we focus on some key extensions to the model, with respect to the nature of peers (their familiarity relationships, their empathy) and the presence of peers with particular profiles, as well as with specific clustering of peer relationships. Specifically, we show that the influence of trusted confidants on individuals behaves in a predictable fashion; moreover, we show that the underlying model is robust to individual variations in empathy within the population. These empirical results provide important insights to those seeking to examine and analyze patterns of influence within social networks.

    Citation: Robin Cohen, Alan Tsang, Krishna Vaidyanathan, Haotian Zhang. Analyzing opinion dynamics in online social networks[J]. Big Data and Information Analytics, 2016, 1(4): 279-298. doi: 10.3934/bdia.2016011

    Related Papers:

    [1] John A. Doucette, Robin Cohen . A testbed to enable comparisons between competing approaches for computational social choice. Big Data and Information Analytics, 2016, 1(4): 309-340. doi: 10.3934/bdia.2016013
    [2] Nickson Golooba, Woldegebriel Assefa Woldegerima, Huaiping Zhu . Deep neural networks with application in predicting the spread of avian influenza through disease-informed neural networks. Big Data and Information Analytics, 2025, 9(0): 1-28. doi: 10.3934/bdia.2025001
    [3] Nick Cercone . What's the Big Deal About Big Data?. Big Data and Information Analytics, 2016, 1(1): 31-79. doi: 10.3934/bdia.2016.1.31
    [4] Yang Yu . Introduction: Special issue on computational intelligence methods for big data and information analytics. Big Data and Information Analytics, 2017, 2(1): i-ii. doi: 10.3934/bdia.201701i
    [5] Weidong Bao, Wenhua Xiao, Haoran Ji, Chao Chen, Xiaomin Zhu, Jianhong Wu . Towards big data processing in clouds: An online cost-minimization approach. Big Data and Information Analytics, 2016, 1(1): 15-29. doi: 10.3934/bdia.2016.1.15
    [6] Mingxing Zhou, Jing Liu, Shuai Wang, Shan He . A comparative study of robustness measures for cancer signaling networks. Big Data and Information Analytics, 2017, 2(1): 87-96. doi: 10.3934/bdia.2017011
    [7] Subrata Dasgupta . Disentangling data, information and knowledge. Big Data and Information Analytics, 2016, 1(4): 377-390. doi: 10.3934/bdia.2016016
    [8] Amanda Working, Mohammed Alqawba, Norou Diawara, Ling Li . TIME DEPENDENT ATTRIBUTE-LEVEL BEST WORST DISCRETE CHOICE MODELLING. Big Data and Information Analytics, 2018, 3(1): 55-72. doi: 10.3934/bdia.2018010
    [9] Qinglei Zhang, Wenying Feng . Detecting Coalition Attacks in Online Advertising: A hybrid data mining approach. Big Data and Information Analytics, 2016, 1(2): 227-245. doi: 10.3934/bdia.2016006
    [10] Bill Huajian Yang . Modeling path-dependent state transitions by a recurrent neural network. Big Data and Information Analytics, 2022, 7(0): 1-12. doi: 10.3934/bdia.2022001
  • In this paper, we examine the challenge of performing analyses of opinion dynamics in online social networks. We present a model for studying the influence exerted by peers within the network, emphasizing the role that skepticism can play with respect to establishing consensus of opinion. From here, we focus on some key extensions to the model, with respect to the nature of peers (their familiarity relationships, their empathy) and the presence of peers with particular profiles, as well as with specific clustering of peer relationships. Specifically, we show that the influence of trusted confidants on individuals behaves in a predictable fashion; moreover, we show that the underlying model is robust to individual variations in empathy within the population. These empirical results provide important insights to those seeking to examine and analyze patterns of influence within social networks.


    1. Overview

    In this paper, we explore an important component of the effective understanding of influence in social networks, a topic which has significant interest currently to those in a variety of organizations who face the challenge of performing meaningful analyses in the face of big data. The work that we present in this paper provides insights into how to properly arrange and interpret social network relationships. Our proposed models are introduced; their effectiveness is illustrated through a series of detailed simulations of environments in which users may be participating with their peers, exchanging information, being susceptible to influence and reaching final decisions about actions to take. The strategy that we adopt in fact coincides exactly with the methods promoted by Professor Cercone (advice that in fact one of us once received from him and remember quite vividly), namely to properly establish the grounding for proposed models in artificial intelligence first and foremost through a proof-of-concept analysis. We are quite proud to be offering a contribution in the memory of Professor Cercone, of value towards a topic area with which he was intimately involved: that of big data and information analytics.


    2. Introduction

    This paper studies the challenge of analyzing the dynamics of opinions within online social networks. The problem we focus on is how to model the behavior of a peer who is forming an opinion in order to make a decision, under the influence of others within the social network. Depending on the nature of the peers in the networks and their relationships in the social network, convergence of opinions may be promoted. We are interested in the role that extremists and stubborn agents may play in promoting a polarization of opinions and whether this can be addressed by imbuing peers with an appropriate level of skepticism.

    Various settings today place users in environments where massive numbers of other peers may potentially serve to cause an adjustment in opinion. Comprehensive analysis of the opinion dynamics may then be of great importance. This may be challenging to perform. For example, social networks may enable voters to discuss possible candidates in an upcoming national election. Pollsters may then be interested in analyzing the opinion dynamics that tend to emerge, in order to predict how people may end up voting. Businesses may seek to influence peers in a social network, to convince them to purchase the company's products; knowing how the opinions of these peers could be changed, if the business were able to project an opinion into this network, would be very valuable in order to determine appropriate strategies. By studying the dynamics that results under a variety of specific scenarios, we are able to equip organizations with a way to gain their desired insights.

    Our approach is one where we suggest adopting skepticism in the presence of others whose beliefs radically differ from one's own. Our aim is to examine where convergence of beliefs can still emerge. This is done by first describing a core model ([17]) which examines conditions under which the opinions of moderates stratify, under varying degrees of empathy, using distinct techniques for measuring the trust of peers, in the context of certain structures of graphical relationships for the network.

    We then expand the model to consider two separate but valuable extensions, each of which serves to confirm the robustness of the original design, under a wide variety of differing environments.

    With the initial extension, the empathy of the agents is kept constant in order to examine the difference of influence between acquaintances and confidants, within the social network. In distinguishing these two primary kinds of peer relationships, we are able to produce a more detailed analysis of influence, linked to these roles.

    In the second extension, we first of all experiment with modeling the parameter of empathy as a distribution instead of a constant, in order to examine how much polarization of opinion is achieved, with extremists in the network. We also introduce curmudgeons into the population, individuals who constantly question the group's norms and may be viewed as extremists with moderate opinions, in order to examine the dynamics that ensue and the effect on convergence of overall opinions. A final variation examined is admitting scenarios where peers tend to collect into small cliques, known as cavemen graphs; this is done in order to examine the behavior of changing opinions, within this stratified network.

    All together, we reveal important relationships exhibited in social networks among peers, when forming opinions for decision making. In scenarios where massive numbers of other agents may pose a challenge to enabling opinions to be formed with some clarity, our methods provide valuable insights for how peers should be organizing, reasoning and acting, towards carrying out effective actions.


    3. Background

    In this section, we provide an introduction to opinion dynamics, followed by the presentation of some existing work that serves as the backdrop to the new models that are developed in this paper. Included here is a cogent summary of the approach of Tsang and Larson [17] which forms the basis of our research.


    3.1. Opinion dynamics

    The study of opinion dynamics has early applications in fields such as the early adoption of antibiotics, hybrid corn, etc. This process is referred to as "innovation diffusion" and has traditionally been modeled by binary variables which model whether agents adopt the new techniques or not [17]. While this binary decision model is appropriate for the above decisions, this does not suffice while capturing more complex opinions like political leanings, socioeconomic standing, fashion trends, movie preferences, etc. Modern opinion dynamics generalizes this innovation model by expressing opinion as continuous values in the interval [0,1].

    In an iteration, agents interact with each other and consequently change their opinion. Agents have opinions in the interval [0,1]. Some agents, termed "extremists", have opinions close to either 0 or 1, and do not update over time (they are termed as 0-extremists and 1-extremists, respectively); also, it is accepted that the populations frequently converge to a single opinion after sufficient iterations. An interesting point to study is if it is possible to have a certain fraction of the population disagree (or have slightly different opinions) even after convergence. This is very important: if there is no diversity of opinion, then that group will only think along a converged set of ideas and is vulnerable to unexpected changes in the environment. This is termed as cognitive collapse in the literature [12].

    A phenomena that is observed in real life is that, agents are more likely to interact with each other when they are already similar to each other. To model this, simulations incorporate homophily from the literature [17]. Homophily is the principle that similar people are more likely to interact with each other than dissimilar people [10]. Homophily makes sure that agents who have similar opinions are more likely to interact with one another. Another related phenomena which motivates cognitive scientists is cognitive bias; this refers to when subjects arrive at irrational conclusions based on subjective reconstruction of reality [1]. We are specifically concerned with motivated cognition, a particular type of cognition bias, where observations are evaluated in ways that is compatible with the individual's belief. Examples of this bias are seen in studies where participants are asked to rate the attractiveness of a person; it was observed that participants consistently rated the person higher if they were led to believe they were going on a date later on in the experiment [9].

    Opinion dynamics among agents in a social network has also been widely studied in terms of trust model selection and experimental verification [6]. Most of existing methodologies model whether an agent would adopt opinions from its neighbours, and how users updating their own opinions lead to evolution of opinions[2]. Then the convergence or divergence of opinions and the emergence of a consensus or polarization status can be observed and evaluated [7]. There are three main types of components defined in most of these models: Neighbours, Opinions, Trust. The Neighbours for a specific user in the social network are defined as those who follow this user and those followed by this user [13]. As for the Opinion held by each agent, while binary variables 0 or 1 are suitable to model many decisions such as political elections, the field of opinion dynamics utilizes continuous values in the interval [0,1] to describe opinions where 0 and 1 represent the extreme ends of the spectrum. Finally, the Trust value between agents is also depicted as a value in the interval [0,1]. According to the opinions distribution, the values of opinions can always be normalized to the interval [0,1]. This enables us to more accurately measure the degree of trust between different types of agent pairs.


    3.2. Tsang and Larson's opinion dynamics for skeptical agents

    The work by Tsang and Larson [17] focuses on how agents with extreme opinions affects the general population. As mentioned in Section 3.1, this paper models opinions as continuous values between the interval [0,1]. It also makes use of homophilic networks, where agents are more likely to interact with agents similar to itself, and the fact that these network may fail to converge to a single opinion when: agents are least skeptical, and when they stabilize themselves with opinions from extremists from both camps (close to 0 and 1, respectively). The concept of skepticism is explained in more detail in Section 3.5.

    The Opinion Dynamics Model used has agents embedded in a social network with each agent having an opinion xi[0,1]. Each agent is influenced by its neighbors, N(i)={vV|(i,v)E} and each agent i values opinions of neighbor j by weight wi,j>0. A trust function based on distance between opinions is also defined in Equation 1.

    T(x,x)=exp((xx)2h) (1)

    where h is the empathy of the population, a higher empathy reflects a population more willing to be persuaded. The opinion and weight update at each iteration is performed by the equations below:

    xi(wi,ixi+jN(i)wi,jxj)(wi,i+jN(i)wi) (2)
    wi,j(wi,j+rT(xi,xj))(1+r) (3)

    Here, r is the learning rate of the population; the higher the learning rate the more an agent distrusts agents with different opinions. Note that opinion update in Equation 2 is performed before the weight update in Equation 3.

    The random graph models used for simulation are the Barabasi-Albert graph model and a homophily model based on the Erdös-Reyni random graph. The Barabasi-Albert model is an algorithm to generate a random network using a preferential attachment process [15]. It is constructed iteratively by adding vertices with an attachment parameter m to m existing vertices with probability proportional to their respective degrees.

    An Erdös-Reyni graph model with connecting probability p is constructed by considering every two pair of vertices and drawing an edge between them with probability p. Homophily is incorporated by weighting this probability to (1d)p, where d=|xixj|.

    Tsang and Larson test their model by averaging their results over 25 replicated trials (each with a maximum of 500 rounds). Their evaluation shows that they have constructed a robust model of opinion dynamics, with agents operating in preferential attachment, resulting in a small-world network which quickly converges to an early, loose consensus. They also show that the final outcome of the equilibrium, whether the population converges to a moderate or extreme opinion, will be based on agent empathy and as a secondary factor, the network's connectivity. In Section 6 we show a couple of graphs which display output from algorithms encoded to run this model in specific social networking environments. These graphs will be used to contrast with the results we obtain from the extensions presented in this paper, as part of our discussion of the new results that emerge in our work.


    3.3. Considering loners in the population

    It is pertinent to note the work of Swarup et al. [16], who studied the convergence of language norms, how new features in languages occur, and when they expire. This approach differs from the work of Tsang and Larson in that they consider bidirectional graphs, where agent A can be influenced by agent B, but vice-versa may not be possible. Their model assumes the existence of loners, who are not influenced by anyone else, and who are responsible for introduction of new features to the language. These loners draw an interesting parallel to the curmudgeons introduced by Parunak et al. [12], which is expanded upon late in the literature review.

    The underlying assumption of the paper is that languages keep changing due to "innovation", or the change of diction. The authors also assume that as a novel feature enters a language, it becomes the norm after a period of time. Note that a norm is said to be reached if 90 % of the population uses the language variant. The paper divided agents into two groups:

    1. Loners: People who do not copy others, and are not connected to many people

    2. Hubs: People who are connected to many people

    The paper posits that loners, who are uninfluenced by other agents, are more liable to coming up with language features which differ from the norm, and are responsible for the introduction of new features in languages. The model used is the Degree-Biased Voter Model (DBVM), which is a graph, where if each node A has a directed edge to node B, then A can copy B. The directed edge is an ordered pair of vertices, which in this case would be (A,B). The probability of a neighbour, or a node which has incoming edge, say i, being chosen to copy from is described in Equation 4.

    P(i)=kinijkinji,jN (4)

    where kini is the in-degree of neighbor i and N consists all neighbors of current node.

    The paper tests this model and compares it favorably with data available from 19th century French. The conclusions of the paper are that with an increase in words being introduced to the language, a lesser number of loners introduce variants, and that the time taken to reach a norm decreases. Another important note is that agents need to be conservative if a norm is to exist, if agents are very susceptible to change, then norm may not be formed.

    This work serves as an influence for the second extension presented in this paper, in Section 5.


    3.4. Modelling and managing collective cognitive convergence

    The paper of Parunak et al. [12] was motivated by the perceived increasingly ingrown nature of agent research [12]. The authors focus on a phenomena termed as Collective Cognitive Convergence, or C3, which arises when the same set of people interact frequently with each other, and consequently they grow to think more alike. While convergence of opinion is good, too much can reduce the diversity of opinions and so, cognitive collapse arises. An examples of cognitive collapse is during the Cold War between the Soviet Union and NATO, which left them both ill-prepared to face asymmetric warfare. Another example is highly specialized academic disciplines like agent research which may become increasingly irrelevant to people outside the field. Some of the measures used by the paper to tackle cognitive collapse, like curmudgeons and interacting subpopulations, are used in the proposed extension in Section 5. The similarity of curmudgeons and Swarup et al.'s loners was also expanded upon before.

    The reasons for C3 were listed by the authors as:

    1. Social pressure to conform

    2. Limited information in delimited groups

    Another pertinent phenomena is group polarization, where a group with a slight tendency towards one position will become more extreme through interactions. On running experiments, Parunak et al. detail the items below as some methods which did not help in countering the collapse of the population.

    1. Highly tolerant agents: when agents interact very easily with all agents disregarding the extremeness of their opinion, extremists could influence agents to convergence

    2. Delimiting agent's neighborhood: when agents are constrained to interact with only other agents in their neighborhood, they are never exposed to agents who have disparate opinions and therefore this leads to collapse

    3. Neighborhood is delimited to random agents: when agents were picked by random to interact with other agents, it was experimentally shown that there was still a collapse of the population

    The authors propose the following mechanisms as successful in countering collapse of populations:

    1. Random mutation: the opinion of agents change in each iteration with a small probability

    2. Curmudgeons: adding agents who constantly question the group's norms and assumptions

    3. Interacting sub populations: having users who are part of different communities (Fig. 1)

    Figure 1. In this caveman graph, the nodes of cliques which are connected to other cliques correspond to users who are part of different communities.

    This work will also be an inspiration for the extension outlined in Section 5.


    3.5. Trust and opinion dynamics

    The DEGROOT model is one of the classical averaging models which studies, in a fixed network, how opinion consensus is reached when individual opinions are updated to the average opinions of the neighborhood [5]. In a social network with n agents, an undirected graph G=(V,E) depicts the edges E between |V| agents. The edge (i,j)E has weight wij=wji, which captures homophily between agents i and j. Let N(i) denote the neighbours of agent i. At any particular time, let xn denote the vector of the opinions of the agents. The opinion will be updated in this model in the following way:

    xiwi,ixi+jN(i)wi,jxjwi,i+jN(i)wi,j (5)

    The DEGROOT model of opinion dynamics figures prominently in the extension outlined in Section 4. This model easily updates an agent's opinion by averaging his opinion with the mean of his nearby opinions. And all the opinions will be swayed by each other through repeated iterations and finally converge to a consensus in the fixed network. However, the DEGROOT model ignores the fact that there exist some extremists in the social network and the problem of how to model those agents who disagree with others even at equilibrium [4]. Tsang and Larson [17] proposed a Skepticism model to investigate how skepticism affects opinion formation in social network. Skepticism model explores the effects of skepticism between agents. Agents are skeptical of other agents when their opinions diverge, but are more receptive to persuasion when their opinions better align.

    Equation 1 defines a kernel based trust function which measures the degree of trust between agents according to the distance of their opinions |xx|. The trust value wi,j between agents i and j is weighted and updated in each iteration according to Equation 3. Tsang and Larson [17] found varying r didn't change the qualitative results. For the experiments in Section 4, we in fact fix r=1.5. And wi,i describes the inertia of i's trust and opinion. Combining all the above equations, each agent i updates its opinion xi and trust wi,j with others via a weighted average in each iteration.

    The opinion would evolve to a two-pole model when there exist a lot of extremists in the social network. Tsang and Larson [17] also found that higher empathy increases the impact of the extremists on the population. And small-world networks will quickly converge to an early, loose consensus before taking coordinated action to migrate the collective opinion to the equilibrium. This equilibrium may be moderate or polar, with agent empathy being the primary factor influencing the final outcome.


    4. Distinguishing acquaintances and confidants

    In this paper, we present two distinct efforts to introduce extensions to the model of Tsang and Larson, in order to produce experimental results that demonstrate the robustness of this approach. The first is outlined in this section; the second extension is showcased in Section 5. Our results serve to provide important insights to practitioners about how the core model may be employed and interpreted, in a variety of settings. In Section 6, we return to provide additional discussion about the conclusions to be drawn.

    The first extension we present concerns a confidant opinion dynamics model. Based on the DEGROOT model [3] and the Skepticism model [17], our novel model combines the variance of friendship with a traditional averaging model. Agents {1,2,...,n} are connected by a Erdös Rényi random graph G=(V,E). xj[0,1] represents the opinion held by agent j. In each graph, we select a particular reference agent i. We partition i's edges into EC and EA, which stand for the connections with confidants (close friends) and acquaintances respectively. In other words, agent i has two types of neighbors, confidants: C(i)={vV|{i,v}EC}; and acquaintances: A(i)={vV|{i,v}EA} with different trust weights.

    In this model, agent i is parameterized by two quantities: α is defined as the Confidant Parameter to measure the probability to be persuaded by agent's confidants. We hypothesize that an agent's opinion is more likely to be affected by his family members and close friends which are confidants in our model. Other types of neighbors of this agent cannot achieve the same level of influence. By adjusting the confidant parameter α in Equation 6, we can assign different trust weights to confidants and acquaintances respectively. We assume the opinion difference between an agent and his different types of neighbours would be different after opinion evolution within agents. In particular, the agent should hold an opinion that is more similar with his confidants than with his acquaintances.

    The opinion xi is also influenced by various types of neighbors with different trust value weights: trust weight yi,j>0 is weighted for confidants' opinions and wi,k>0 is for acquaintances' opinions. For each confidant jCi for agent i, the degree of j's influence also vary with different trust value yi,j. In some case, some of confidants might shape an agent's opinion to a greater extent such as relatives or most close friends. So the trust value yi,j should also be varied according to the confidant's friendship distribution. In order for an agent to put some weight on his own opinion during opinion evolution, there also exists a weight wi,i contributes to the agent's new opinion. We assume wi,i>c×kAiwi,k.

    xiwi,ixi+αjC(i)yi,jxj+(1α)kA(i)wi,kxkwi,i+αjC(i)yi,j+(1α)kA(i)wi,k (6)

    In this model, we assume minjCiyi,j>maxkOiwi,k since the agent i remains more receptive to his confidants Ci than other acquaintances Ai in our assumption. As indicated in Equation 3, for wi,k in each iteration of opinion formation, it is updated via a trust function T which is based on the distance between opinions x and x via the Gaussian kernel shown in Equation 1.

    We assume the distribution of confidant networks follows a power-law distribution [11]. So only a small portion of neighbors can be regarded as confidants for a specific agent in our defined social model. Due to the sparsity of confidants in our simulated confidants network, we assume all trust weights for confidants agents as {yi,j=1|jCi} to simplify the simulation process. So every confidant j would be assigned the highest trust value yi,j=1 from i. The variation of trust value yi,j for different confidants is left as future work. We use the confidant parameter α as the multiplicative weight of opinions given by i to each of his confidants, and conversely, 1α, for acquaintances.


    4.1. Empirical simulations

    Our proposed model can be verified by comparing the opinions differences between agents and their neighborhoods after multiple iterations of opinions formation. The degrees of opinion difference with acquaintances or confidants can be different. Meanwhile, we also need to check whether our model would lead the agents' opinions to convergence or divergence. Moreover, it is also interesting to investigate the influence of varying parameters: Confidant Parameter α and the proportion of confidants in neighbours β.


    4.1.1. Graph model

    This paper applies a modified Erdös Rényi random model to generate agents connection graph [18]. Recall that in the Erdös Rényi model, a graph is constructed by connecting nodes randomly. Each edge is included in the graph with probability p independent from every other edge. In our experimental settings, the edges between every pair of vertices i and j are connected according to a fixed probability p. By following the Skepticism model [17], we introduce homophily by reweighting the connection probability between two agents with (1d)p, where d=|xixj|. The modification implies that the nodes with similar opinions are more likely to be connected together than other pairs of nodes with opinion disagreement. The reason for selecting the modified Erdös Rényi random model is that we can decrease weights for some edges according to homophily and regenerate the graph after each iteration.

    An example of modified Erdös Rényi graph on 40 vertices and p=0.2 is shown in Figure 2. In our experiments, we set p=0.2 means that each agent is connected with other agents with 20% probability. This proportion of connectivity is consistent with the experimental setting of Tsang and Larson [17]. The initial opinions for these 40 agents are generated from a normal distribution (see below). The orange nodes have the opinions near to 1 and the white ones represent opinions around 0. It is clear that the nodes with similar opinions are grouped together and the nodes are distributed according to their opinions.

    Figure 2. 40 nodes Erdös Rényi random graph with homophily. The color of node stands for initial opinion, with progression from white (0) to orange (1).

    4.1.2. Experimental design

    For each experiment, we initialize the social network G with 200 nodes using modified Erdös Rényi random model and p=0.2, with varying parameters for graph construction and agent empathy. The initial opinions X for 200 agents are generated from truncated normal distribution XN(μ,σ2) with μ=0.5,σ=0.3. According to the Skeptical model [17], we find most of opinions in the population would comprise the moderates. The initial trust value T(x,x) between any pair of agents is set according to the trust function defined in the equations 1. For each agent in the graph model, the proportion of confidants in neighbours β is varying to model how the density of confidants can affect the dynamics of opinions. In our experiment, we increase β from 0 to 1 by a step size equal to 0.1.

    Once the network and opinions are initialized, the variables are updated according to equations 6 - 3. We set r=1.5 for all experiments, since [17] found that varying r didn't change the results [17]. The experiment terminates when no opinions changed by more than a small value ϵ, or a maximum number of iterations tmax has been reached. In our experiments, we set ϵ=0.001 and tmax=500; tmax was rarely reached in practice. In order to avoid the variance as much as possible, all the results are averaged over 25 replicated independent trials.

    The empathy bandwidth parameter h defined in the equation 1 is fixed in our experiment as h=0.03. As discussed in the previous sections, higher empathy h is correlated with increased influence from extremists. In our study, we are not interested in understanding and capturing the polarization phenomenon in opinion dynamics. So we set a lower h to avoid polarization. We assume the final averaged opinions will converge to moderate opinions since the initial opinions follow normal distribution where μ=0.5.


    4.1.3. Opinion convergence

    Figure 3 shows the evolution of opinions for around 500 iterations from all the trials. The opinions of all the trials are averaged at the end of each experiment. To measure the process of opinions evolution, we record the distribution of opinions in each iteration. Since the initial opinions X are generated according to normal distribution, Figure 3 shows all the opinions from 200 agents are equally distributed from the interval [0,1] in the beginning stage of evolution. We can also see the trend of opinions evolution (shown as the blocks with the similar colors Figure 3) is gradually converging to moderate opinions as the number of iteration increases. Most of the opinions fall into the interval between [0.4,0.55]. It has a similar opinion formation process as the convergence of opinions described in [17]. We can also find that the opinions converge rapidly to a common opinion after around 140 iterations. Even the extremists finally converge to a consensus status quickly. The reason for this phenomenon is that this effect is amplified by the small world property of these graphs. In a small world, each agent is easily influenced by its neighborhoods, and opinions are broadcast quickly through the entire network.

    Figure 3. Evolution of opinions in moderates, on a modified ERgraph with homophily, with partially polarized initial opinions.

    4.1.4. pinion difference evaluation

    We calculate the difference between the opinions of agent xi and the opinions of his confidants {xj|jCi} as the degree of opinion acceptability after running all the iterations. As shown in Equation 7, for each i's confidant j, we calculate their opinion difference between the final opinions |xixj| and average all the opinion differences to get Dc. Dc means the average opinion difference between agents and their confidants. The average of opinions differences can measure the overall differences between agents and corresponding neighbors and avoid the bias. In the same way shown in Equation 8, Da measures the average opinion difference between agents and their acquaintances.

    Dc=iVjC(i)|xixj|iV|C(i)| (7)
    Da=iVkA(i)|xixk|iV|A(i)| (8)

    Figure 4 measures the difference between Dc and Da by calculating their gap G=DaDc in Equation 9. If the opinion of agent i is more receptive to confidants Ci than his acquaintances Ai, the average opinion difference between xi and {xj|jCi} should be smaller than the difference between xi and {xk|kAi}. So G should be larger than 0. And if the gap G is higher, it means the agents hold more similar opinions with their confidants and are therefore are more trustful to confidants. If G0, it means there is no difference between confidants' opinions and acquaintances' opinions.

    Figure 4. The gap between average opinion difference between agents and confidants with average difference between agents and acquaintances.
    G=DoDc{>0 Opinions are closer to confidants=0 No differences between neigbours' opinions<0 Opinions are closer to acquaintances (9)

    Figure 4 shows the heatmap of G under varying parameter settings the confidant parameter α and the proportion of confidant β. The deeper color block in Figure 4 means the G is higher and the agents' opinions are closer to their confidants. We found the colors of most blocks are deeper than white which means G0. With lower proportion of confidants: β, agents have more similar opinions with their confidants than other acquaintances. If the proportion of confidants β is high, the G would be low and the opinion difference is not that clear. We assume the reason for this phenomenon is that more confidants will dilute agent opinions to a higher extent. More confidants would bring more averaged opinions to the agent. And there would be no distinct difference between opinions from confidants and acquaintances. With a higher confidant parameter α, agents would listen more to confidants than acquaintances. So it means the opinions from confidants matter more for agents since higher trust weights are assigned to confidants.

    The results show that the opinion difference between agents and their confidants is smaller than that between agents and their acquaintances. This phenomenon is more clear when agents are assigned higher Confidant Parameters (i.e. listen more to confidants than to acquaintances) and the proportion of acquaintances in their network is smaller (i.e. only a small portion of neighbours are acquaintances) so agents are strongly influenced by limited neighbours and this differs more with acquaintances.

    We also find the pattern remains consistent no matter how much we vary the empathy[0.2, 0.8] and regardless of the connection probability of agents in the Erdos Renyi graph[0.15, 0.4]. We do not show the data from these experiments for brevity, but no data point differs from those in Figure 4 by more than ±1.05e05. Thus, we conclude that the opinions of agents are mostly reliant on the Confidant Parameter and the acquaintances proportion.


    5. Considering distributions of empathy, curmudgeons and cavemen

    We now present a second effort to introduce important variations for the core model of Tsang and Larson [17]: allowing empathy to be modeled as a distribution rather than as a constant, examining how opinion dynamics adjust in the presence of curmudgeons, and considering the effects when clique-ish cavemen graphs persist within the environment.

    Our proposed model is based on the observation in Tsang's model that empathy and learning rate could vary among the population of a society. Research in the literature shows that for Japanese medical students, empathy increases as they progress in their study and that female medical students were more empathetic [8]. This pattern, however, was not observed in Korean medical students where empathy difference was not observed between genders [14]. It seems reasonable to conclude that empathy differs across a population based on educational and social factors. To include this in Tsang's model, we vary empathy across an uniform distribution. We could represent this in our formula by modifying the trust function in Equation 1 to Equation 10.

    T(xi,xj)=exp((xixj)2hi) (10)

    5.1. Preliminary experiments

    In the subsection that follows, we present our experiments which initialized 200 nodes in an appropriate graph with varying parameters of empathy, curmudgeons, and extremists. To eliminate noise, we initialize curmudgeons in all experiments with evenly spaced values between 0 and 0.5 (not inclusive of 0), the number of which depends on the fraction of curmudgeons specified. Empathy is varied across an uniform distribution between 0 and a threshold. The learning rate was fixed at 1.5, similar to Tsang and Larson [17]. For all our experiments, we used the uniform trust model, where wi,j=1,i,jE. We consider two models in our experiment: the first being the 2-pole model where 10 % of the population is chosen uniformly at random as 1-extremists and another 10 %, also chosen uniformly at random, as 0-extremists; the second being the 1-pole model where 10 % of the population is chosen uniformly at random to be 1-extremists.

    The figures for the 2-pole model show the average polarization for moderates, moderates being agents who are not extremists or curmudgeons, which is the average distance of opinions from 0.5 for moderates. While for the 1-pole model, the figures show the average final opinion, which is the average value of the opinion of moderates. The results are as shown as Figures 5, 6, 7, and 8. All the figures are heatmaps where the y-axis shows the average polarization/final opinion at different values of connectivity parameter for Erdos-Reyni graphs and attachement factor for Barabasi-Albert graphs. The x-axis shows the average polarization/final opinion at different values of the mean of the empathy distribution. The intensity of the points on the heatmap increases as the value of the average polarization or final opinion get larger.

    Figure 5. The average polarization of moderates when exposed to 10% 1-extremists and 10% 0-extremists without curmudgeons. The graph on the left is an Erdos Reyni graph without homophily (95% C.Ⅰ. within ±0:08) while the graph on the right is an Erdos Reyni graph with homophily (95% C.Ⅰ. within ±0:07). Both were averaged by 75 trials.
    Figure 6. The average polarization of moderates when exposed to 10% 1-extremists and 10% 0-extremists without curmudgeons. The graph is a Barabasi-Albert graph (95% C.Ⅰ. within ±0:08), averaged by 25 trials.
    Figure 7. The average final opinion of moderates when exposed to 10% 1-extremists without curmudgeons. The graph on the left is a graph on the Erdos Reyni graph without homophily (95% C.Ⅰ. within ±0:11) while the right is an Erdos Reyni graph with homophily (95% C.Ⅰ. within ±0:11). Both were averaged by 25 trials.
    Figure 8. The average final opinion of moderates when exposed to 10% 1-extremists without curmudgeons. The graph is a BarabasiAlbert graph (95% C.Ⅰ. within ±0:10), averaged by 25 trials.

    5.2. With curmudgeons

    We now move on to examine the robustness of the Tsang and Larson model to the presence of curmudgeons in the population. Recall that these are agents that constantly question the group's norms. These curmudgeons do not change their opinions in all the iterations. We analyze for different graph models when 20 % of the population, chosen uniformly at random, to be curmudgeons and when 10 % of the population, also chosen uniformly at random, to be curmudgeons. We note that increasing the percentage of curmudgeons increases the polarization of agent opinion and that varying empathy disrupts the pattern that was shown to exist in Tsang and Larson's work [17]. The results are shown in Figures 9, 10, 11, 12, 13, and 14.

    Figure 9. The average polarization of moderates when exposed to 10% 1-extremists and 10% 0-extremists with 10% curmudgeons. The graph on the left is an Erdos-Reyni graph without homophily (95% C.Ⅰ. within ±0:08) while the right is with homophily (95% C.Ⅰ. within ±0:08). Both were averaged by 25 trials.
    Figure 10. The average polarization of moderates when exposed to 10% 1-extremists and 10% 0-extremists with 20% curmudgeons. The graph on the left is an Erdos-Reyni graph without homophily (95% C.Ⅰ. within ±0:08) while the right is with homophily (95% C.Ⅰ. within ±0:08). Both were averaged by 25 trials.
    Figure 11. The average final opinion of moderates when exposed to 10% 1-extremists with 10% curmudgeons. The graph on the left is an Erdos-Reyni graph without homophily (95% C.Ⅰ. within ±0:10) while the right is with homophily (95% C.Ⅰ. within ±0:11). Both were averaged by 25 trials.
    Figure 12. The average final opinion of moderates when exposed to 10% 1-extremists with 20% curmudgeons. The graph on the left is an Erdos-Reyni graph without homophily (95% C.Ⅰ. within ±0:10) while the right is with homophily (95% C.Ⅰ. within ±0:11). Both were averaged by 25 trials.
    Figure 13. The average polarization of moderates when exposed to 10% 1-extremists and 10% 0-extremists for Barabasi-Albert graphs. The graph on the left has 10% curmudgeons (95% C.Ⅰ. within ±0:08) while the right has 20% curmudgeons (95% C.Ⅰ. within ±0:08). Both were averaged by 25 trials.
    Figure 14. The average final opinion of moderates when exposed to 10% 1-extremists for Barabasi-Albert graphs. The graph on the left has 10% curmudgeons (95% C.Ⅰ. within ±0:11) while the right has 20% curmudgeons (95% C.Ⅰ. within ±0:12). Both were averaged by 25 trials.

    5.3. Caveman network

    We also sought to test the Tsang and Larson model [17] on different network structures like the caveman graph (Figure 1), where there are tight knit separate communities that are connected to each other by only a few bridge agents. The caveman graph, while perhaps not representative of typical modern societies, could be true of certain environments where peers tend to be more isolated and are connected by only a few agents (for example, travelling salesmen). When the experiment was run on a caveman graph with 200 nodes and 5 cliques of size 40 each, the agent's opinions converged to a mean of 0.75 while the standard deviation was 0.24. But, when the experiment was run on a caveman graph with 200 nodes and 20 cliques of size 10, the mean of the agents' opinion was 0.75 and the standard deviation was 0.10. We conclude that when the number of cliques are lower opinion does not converge, and as the number of cliques become higher it converges to a consensus. Note that we did not use curmudgeons while running the experiment for caveman graphs.


    6. Discussion

    In order to reflect further on the results presented in this paper we first of all reimplemented the algorithms of Tsang and Larson [17] using the same parameters employed for the graphs in Section 5. We then selected three representative graphs from that paper to display here: Figures 15, 16 and 17. These graphs now admit a straightforward comparison with the ones that were generated in Section 5. In particular, we observe that varying empathy disrupts the pattern that existed in the work shown in Tsang and Larson's work [17].

    Figure 15. The average polarization of moderates when exposed to 10% 1-extremists and 10% 0-extremists for Barabasi-Albert graph without its empathy being varied and without curmudgeons. It has a 95% C.Ⅰ. within ±0:08, averaged by 25 trials.
    Figure 16. The average polarization of moderates when exposed to 10% 1-extremists and 10% 0-extremists for an Erdos-Reyni graph without its empathy being varied and without curmudgeons. It has a 95% C.Ⅰ. within ±0:09.
    Figure 17. The average polarization of moderates when exposed to 10% 1-extremists and 10% 0-extremists for an Erdos-Reyni graph without its empathy being varied and without curmudgeons. It has a 95% C.Ⅰ. within ±0:09.

    Introducing curmudgeons does not change this pattern, but we see a marginal change in the polarization of agents when 10 % curmudgeons are introduced and we see that there is slightly more polarization when a higher percentage of the population (20 %) are curmudgeons. The reasoning behind this is might be that as there are more agents with slightly polarized opinions, and who are not influenced by other agents, the overall polarization of the population increases correspondingly. To summarize, adding empathy distributions disrupts the original model but adding curmudgeons does not have much effect.

    We note that the results of Section 4 are not brought into a direct comparison with the results of Tsang and Larson [17]. This is because these results focus on analyzing local effects, i.e. for one agent in the graph (i.e. the reference agent), reporting on the influence of confidants and acquaintances within the social networks. These are therefore independent conclusions.


    7. Conclusion

    In this paper, we showcased the model of Tsang and Larson [17], used to examine opinion dynamics in social networking contexts. We explained how a study of the patterns of behaviour of peers within these networks is a truly vital challenge, one where the populations may be extremely large, and thus where key insights into how opinions adjust, under varying parameter configurations, is critical. As we explore two primary extensions to the skepticism model of Tsang and Larson, we are able to examine the outcomes that emerge with regard to peer opinion. We have learned that the model rests on a solid foundation that enables it to be repurposed in a setting where peers may be distinguished as acquaintances or confidants, and that a similar convergence of behaviours exhibited in the original model continue to emerge, under this extension. We have also learned that the original model adapts well when empathy is viewed as a distribution of possible values, rather than being held constant, during experimentation. With the addition of curmudgeons into the environment, we are able to additionally challenge the peers as they converge on their opinions; allowing cavemen-like cliques to be formed also enables us to draw conclusions about the value of the model in a rather specific arrangement of peer relationships. In all, we see that the original model is adaptable to variations in parameter settings, and provides an extensible framework for practitioners to learn the nature of opinion dynamics within their social networks.


    8. Future work

    For future work, we plan to conduct additional experiments and to examine additional metrics with respect to experiments that have already been conducted. To begin, the exploration of confidants and acquaintances presented in this paper set the empathy value to be fixed, since we were not focusing on the polarization of opinions. For future experiments, varying empathy is worth exploring; the final opinion may be influenced by the presence of extremists, so we can learn more about the effect of empathy in the presence of confidants. Ideally, we would be able to supplement the theoretical models of acquaintance-confidant relationships with real world data mined from social networks. Another possible direction is to examine the trust distribution of confidants, trying to set this more accurately, in comparison with how trust is modeled for acquaintances.

    For the experiments presented in Section 5, which examine empathy in terms of a distribution and consider the role of curmudgeons, we can gain further insights by varying the empathy according to the degree (i.e., the number of neighbors that an agent has) and seeing whether this affects the polarization of opinions. In addition, the exploration of caveman graphs to date has been modest. For the future, we aim to experiment with lesser empathy for agents who are in multiple cliques. The reasoning behind this is that such agents would less likely to be influenced by other agents as they have to content with many neighbors.

    Other areas worth exploring, for the empathy and curmudgeons extension include the following special cases: ⅰ) when there is only one group of extremists and how this affects the convergence of opinions ⅱ) allowing nodes in caveman graphs present in more than one community to be modeled as curmudgeons (following suggestions that in feudal societies it is tradesmen who are considered least gullible and most likely to interact with more than one community). Broader explorations of value for examining confidants and acquaintances includes: ⅰ) considering distinctions among the set of confidants, with certain peers designated as having a higher status than others ⅱ) more generally, considering additional kinds of friendship relations within the social network, allowing finer distinctions than the current arrangement of confidants and acquaintances.

    A final thread for future research is to implement our algorithms in specific contexts where practitioners can help to set the parameters to be explored, as they seek to gain insights into specific trends within social networks that they are most interested in examining. As mentioned in our introduction, we can imagine applications where pollsters seek to analyze the influence of voters in the population or where businesses are making decisions about product offerings based on how they perceive the dynamics of opinions amongst customers to unfold.


    [1] [ H. Bless, K. Fiedler and F. Strack, Social Cognition:How Individuals Construct Social Reality, Psychology Press, 2004.
    [2] [ Y.-S. Cho, G. V. Steeg and A. Galstyan, Co-evolution of selection and influence in social networks, arXiv:1106.2788.
    [3] [ A. Das, S. Gollapudi and K. Munagala, Modeling opinion dynamics in social networks, in Proceedings of the 7th ACM international conference on Web search and data mining, ACM, 2014, 403-412.
    [4] [ G. Deffuant, Comparing extremism propagation patterns in continuous opinion models, Journal of Artificial Societies and Social Simulation, 9.
    [5] [ M. H. DeGroot, Reaching a consensus, Journal of the American Statistical Association, 69(1974), 118-121.
    [6] [ H. Fang, J. Zhang and N. M. Thalmann, A trust model stemmed from the diffusion theory for opinion evaluation, in Proceedings of the 2013 international conference on Autonomous agents and multi-agent systems, International Foundation for Autonomous Agents and Multiagent Systems, 2013, 805-812.
    [7] [ R. Hegselmann and U. Krause et al., Opinion dynamics and bounded confidence models, analysis, and simulation, Journal of Artificial Societies and Social Simulation, 5.
    [8] [ H. U. Kataoka, N. Koide, K. Ochi, M. Hojat and J. S. Gonnella, Measurement of empathy among japanese medical students:Psychometrics and score differences by gender and level of medical education, Academic Medicine, 84(2009), 1192-1197.
    [9] [ Z. Kunda, The case for motivated reasoning, Psychological Bulletin, 108(1990), 480-498.
    [10] [ M. McPherson, L. Smith-Lovin and J. M. Cook, Birds of a feather:Homophily in social networks, Annual Review of Sociology, 27(2001), 415-444.
    [11] [ L. Muchnik, S. Pei, L. C. Parra, S. D. Reis, J. S. Andrade Jr, S. Havlin and H. A. Makse, Origins of power-law degree distribution in the heterogeneity of human activity in social networks, Scientific reports, 3.
    [12] [ H. Parunak, T. C. Belding, R. Hilscher and S. Brueckner, Modeling and managing collective cognitive convergence, in Proceedings of the 7th international joint conference on Autonomous agents and multiagent systems, International Foundation for Autonomous Agents and Multiagent Systems, 3(2008), 1505-1508.
    [13] [ O. Pryymak, A. Rogers and N. R. Jennings, Efficient opinion sharing in large decentralised teams, in Proceedings of the 11th International Conference on Autonomous Agents and Multiagent Systems-Volume 1, International Foundation for Autonomous Agents and Multiagent Systems, 2012, 543-550.
    [14] [ M.-S. Roh, B.-J. Hahm, D. H. Lee and D. H. Suh, Evaluation of empathy among korean medical students:A cross-sectional study using the korean version of the jefferson scale of physician empathy, Teaching and Learning in Medicine, 22(2010), 167-171.
    [15] [ R. Srinivasan, Lecture notes for topics in complex networks, 2013, URL https://www.ma.utexas.edu/users/rav/ComplexNetworks/ComplexNetworks.Lecture12.Notes.pdf.
    [16] [ S. Swarup, A. Apolloni and Z. Fagyal, A model of norm emergence and innovation in language change, in The 10th International Conference on Autonomous Agents and Multiagent Systems-Volume 2, International Foundation for Autonomous Agents and Multiagent Systems, 2011, 693-700.
    [17] [ A. Tsang and K. Larson, Opinion dynamics of skeptical agents, in Proceedings of the 2014 international conference on Autonomous agents and multi-agent systems, International Foundation for Autonomous Agents and Multiagent Systems, 2014, 277-284.
    [18] [ L. H. Wong, P. Pattison and G. Robins, A spatial model for social networks, Physica A:Statistical Mechanics and its Applications, 360(2006), 99-120.
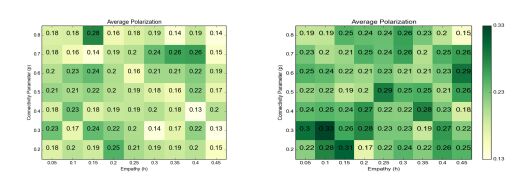
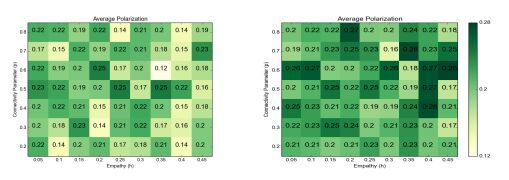
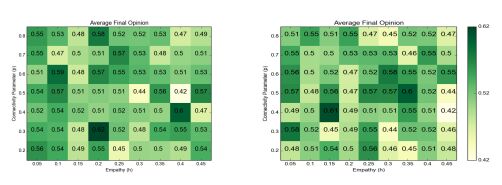
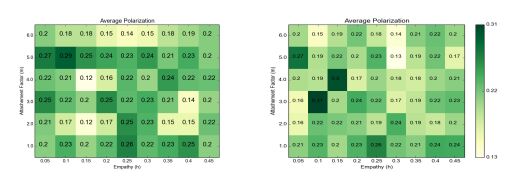
  • Reader Comments
  • © 2016 the Author(s), licensee AIMS Press. This is an open access article distributed under the terms of the Creative Commons Attribution License (http://creativecommons.org/licenses/by/4.0)
通讯作者: 陈斌, bchen63@163.com
  • 1. 

    沈阳化工大学材料科学与工程学院 沈阳 110142

  1. 本站搜索
  2. 百度学术搜索
  3. 万方数据库搜索
  4. CNKI搜索

Metrics

Article views(3593) PDF downloads(526) Cited by(0)

Article outline

Figures and Tables

Figures(17)

/

DownLoad:  Full-Size Img  PowerPoint
Return
Return

Catalog