Type 2 diabetes mellitus (DMT2) is a metabolic disease that is increasingly attracting public attention. Diabetes mellitus is expected to reach 439 million in the world in 2030. Resistant starch (RS) is an indigestible starch which has health properties which has health properties that can be used for preventing diabetes mellitus type 2. In order to increase the RS content, a dual modification method consisted of acidification and heat moisture treatment (HMT) can be applied. The Acid-HMT method is affected by various factors, i.e., acid types, acid concentration, water content ratio, HMT temperature and HMT processing time, and different treatments may result in different RS yields. This study aimed to analyze the effective treatment in the Acid-HMT dual modification to enhance RS content by using a systematic review based on the PRISMA method. The studies revealed that there were 11 articles (n = 68 data) which utilized various acid types combined with HMT. The utilization of acid-alcohol, HCl, and organic acid such as citric acid, acetic acid, and lactic acid resulted in different results of RS content in modified starch. In addition to acid types, treatment conditions such as acid concentration, acidification time, acidification temperature, water content ratio, HMT time, and HMT temperature also affected the resulted RS. The treatment with 0.2 M citric acid for 24 hours at 25 ℃ combined with HMT with 30% moisture at 110 ℃ for 8 hours resulted in the highest increase in RS content of modified starch.
Citation: Ratu Reni Budiyanti, Didah Nur Faridah, Nur Wulandari, Anuraga Jayanegara, Frendy Ahmad Afandi. Effect of combining acid modification and heat-moisture treatment (HMT) on resistant starch content: A systematic review[J]. AIMS Agriculture and Food, 2023, 8(2): 479-495. doi: 10.3934/agrfood.2023025
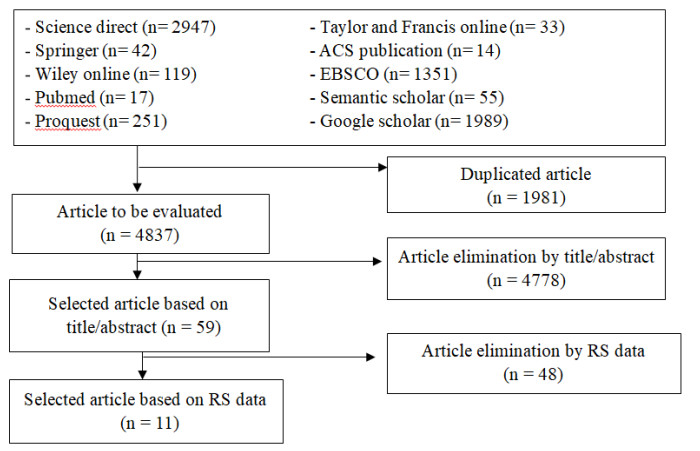
Type 2 diabetes mellitus (DMT2) is a metabolic disease that is increasingly attracting public attention. Diabetes mellitus is expected to reach 439 million in the world in 2030. Resistant starch (RS) is an indigestible starch which has health properties which has health properties that can be used for preventing diabetes mellitus type 2. In order to increase the RS content, a dual modification method consisted of acidification and heat moisture treatment (HMT) can be applied. The Acid-HMT method is affected by various factors, i.e., acid types, acid concentration, water content ratio, HMT temperature and HMT processing time, and different treatments may result in different RS yields. This study aimed to analyze the effective treatment in the Acid-HMT dual modification to enhance RS content by using a systematic review based on the PRISMA method. The studies revealed that there were 11 articles (n = 68 data) which utilized various acid types combined with HMT. The utilization of acid-alcohol, HCl, and organic acid such as citric acid, acetic acid, and lactic acid resulted in different results of RS content in modified starch. In addition to acid types, treatment conditions such as acid concentration, acidification time, acidification temperature, water content ratio, HMT time, and HMT temperature also affected the resulted RS. The treatment with 0.2 M citric acid for 24 hours at 25 ℃ combined with HMT with 30% moisture at 110 ℃ for 8 hours resulted in the highest increase in RS content of modified starch.

| [1] |
Cummings JH, Stephen AM (2007) Carbohydrate terminology and classification. Eur J Clin Nutr 61 (Suppl 1): S5–S18. https://doi.org/10.1038/sj.ejcn.1602936 doi: 10.1038/sj.ejcn.1602936

|
| [2] | Kusnandar F (2020) Kimia Pangan Komponen Makro, Jakarta: Bumi Aksara, 133–141. |
| [3] | Englyst HN, Kingman SM, Cummings JH (1992) Classification and measurement of nutritionally important starch fractions. Eur J Clin Nutr 46 (Suppl 2): S33–50. https://pubmed.ncbi.nlm.nih.gov/1330528/ |
| [4] |
Wei HX, Liang BD, Chai YR, et al. (2020) Effect of Different Heat Treatments on Physicochemical Properties and Structural and Digestibility of Water Caltrop Starch. Starch 72:1–11. https://doi.org/10.1002/star.201900275 doi: 10.1002/star.201900275
|
| [5] |
Haralampu SG (2000) Resistant starch-a review of the physical properties and biological impact of RS3. Carbohydr Polym 41: 285–292. https://doi.org/10.1016/S0144-8617(99)00147-2 doi: 10.1016/S0144-8617(99)00147-2
|
| [6] |
Li Y, Su X, Shi F, et al. (2017) High-temperature air-fluidization-induced changes in the starch texture, rheological properties, and digestibility of germinated brown rice. Starch 69:1–10. https://doi.org/10.1002/star.201600328 doi: 10.1002/star.201600328
|
| [7] |
Weickert M, Mohlig C, Koebnick C, et al. (2005) Impact of cereal fibre on glucose-regulating factors. Diabetologia 48: 2343–2353. https://doi.org/10.1007/s00125-005-1941-x doi: 10.1007/s00125-005-1941-x
|
| [8] |
Shaikh F, Ali TM, Mustafa G, et al. (2021) Comparative study on effects of xanthan gum at different concentrations on the functional, thermal, and digestibility characteristics of corn and sorghum starch extrudates. Starch 73: 2000206. https://doi.org/10.1002/star.202000206 doi: 10.1002/star.202000206
|
| [9] |
Esfahani A, Wong JMW, Mirrahimi A, et al. (2009) The glycemic index: Physiological significance. J Am Coll Nutr 28: 439S–445S. https://doi.org/10.1080/07315724.2009.10718109 doi: 10.1080/07315724.2009.10718109
|
| [10] |
Maache-Rezzoug Z, Zarguili I, Loisel C, et al. (2008) Structural modifications and thermal transitions of standard maize starch after DIC hydrothermal treatment. Carbohydr Polym 74: 802–812. https://doi.org/10.1016/j.carbpol.2008.04.047 doi: 10.1016/j.carbpol.2008.04.047
|
| [11] |
Faridah DN, Damaiyanti S, Indrasti D, et al. (2021) Effect of heat moisture treatment on resistant starch content among carbohydrate sources: A meta-analysis. Int J Food Sci Technol 57: 1965–1974. https://doi.org/10.1111/ijfs.15276 doi: 10.1111/ijfs.15276
|
| [12] |
Hung P Van, My NTH, Phi NTL (2014) Impact of acid and heat-moisture treatment combination on physicochemical characteristics and resistant starch contents of sweet potato and yam starches. Starch 66: 1013–1021. https://doi.org/10.1002/star.201400104 doi: 10.1002/star.201400104
|
| [13] |
Massuquetto A, Durau JF, Ezaki Barrilli LN, et al. (2020) Thermal processing of corn and physical form of broiler diets. Poult Sci 99: 3188–3195. https://doi.org/10.1016/j.psj.2020.01.027 doi: 10.1016/j.psj.2020.01.027
|
| [14] |
Barretti BRV, Almeida VS de, Ito VC, et al. (2020) Combination of organic acids and heat-moisture treatment on the normal and waxy corn starch: thermal, structural, pasting properties, and digestibility. Food Sci 2061: 1–7. https://doi.org/10.1590/fst.33120 doi: 10.1590/fst.33120
|
| [15] |
Shaikh F, Ali TM, Mustafa G, et al. (2019) Comparative study on effects of citric and lactic acid treatment on morphological, functional, resistant starch fraction and glycemic index of corn and sorghum starches. Int J Biol Macromol 135: 314–327. https://doi.org/10.1016/j.ijbiomac.2019.05.115 doi: 10.1016/j.ijbiomac.2019.05.115
|
| [16] |
Maior L de O, de Almeida VS, Barretti BRV, et al. (2021) Combination of organic acid and heat–moisture treatment: impact on the thermal, structural, pasting properties and digestibility of maize starch. J Therm Anal Calorim 143: 265–273. https://doi.org/10.1007/s10973-019-09241-1 doi: 10.1007/s10973-019-09241-1
|
| [17] |
Van Hung P, Huong NTM, Phi NTL, et al. (2017) Physicochemical characteristics and in vitro digestibility of potato and cassava starches under organic acid and heat-moisture treatments. Int J Biol Macromol 95: 299–305. https://doi.org/10.1016/j.ijbiomac.2016.11.074 doi: 10.1016/j.ijbiomac.2016.11.074
|
| [18] | Moher D, Liberati A, Tetzlaff J, et al. (2009) Academia and clinic annals of internal medicine preferred reporting items for systematic reviews and meta-analyses. Annu Intern Med 151: 264–269. |
| [19] | Afandi FA (2020) Meta-analisis Faktor-faktor Penentu Nilai Indeks Glikemik Bahan Pangan Pati-patian dan Verifikasinya dengan Menggunakan Model Pangan, Bogor: IPB University. |
| [20] |
Afandi FA, Wijaya CH, Faridah DN, et al. (2021) Evaluation of various starchy foods: A systematic review and meta-analysis on chemical properties affecting the glycemic index values based on in vitro and in vivo experiments. Foods 10: 364. https://doi.org/10.3390/foods10020364 doi: 10.3390/foods10020364
|
| [21] | Higgins J, Green S (2008) Cochrane Handbook for Systematic Reviews of Intervention. Hoboken: Wiley-Blackwell. |
| [22] |
Lin JH, Lee SY, Chang YH (2003) Effect of acid-alcohol treatment on the molecular structure and physicochemical properties of maize and potato starches. Carbohydr Polym 53: 475–482. https://doi.org/10.1016/S0144-8617(03)00145-0 doi: 10.1016/S0144-8617(03)00145-0
|
| [23] |
Chang YH, Lin JH, Chang SY (2006) Physicochemical properties of waxy and normal corn starches treated in different anhydrous alcohols with hydrochloric acid. Food Hydrocoll 20: 332–339. https://doi.org/10.1016/j.foodhyd.2005.02.024 doi: 10.1016/j.foodhyd.2005.02.024
|
| [24] |
Lin J-HH, Singh H, Wen C-YY, et al. (2011) Partial-degradation and heat-moisture dual modification on the enzymatic resistance and boiling-stable resistant starch content of corn starches. J Cereal Sci 54: 83–89. https://doi.org/10.1016/j.jcs.2011.05.001 doi: 10.1016/j.jcs.2011.05.001
|
| [25] |
Hoover R, Vasanthan T (1994) Effect of heat-moisture treatment on the structure and physicochemical properties of cereal, legume, and tuber starches. Carbohydr Res 252: 33–53. https://doi.org/10.1016/0008-6215(94)90004-3 doi: 10.1016/0008-6215(94)90004-3
|
| [26] |
Shi YC, Capitani T, Trzasko P, et al. (1998) Molecular structure of a low-amylopectin starch and other high-amylose maize starches. J Cereal Sci 27: 289–299. https://doi.org/10.1006/jcrs.1997.9998 doi: 10.1006/jcrs.1997.9998
|
| [27] |
Li C, Dhital S, Gidley MJ (2022) High-amylose wheat bread with reduced in vitro digestion rate and enhanced resistant starch content. Food Hydrocoll 123: 107181. https://doi.org/10.1016/j.foodhyd.2021.107181 doi: 10.1016/j.foodhyd.2021.107181
|
| [28] |
Aparicio-Saguilán A, Valera-Zaragoza M (2015) Lintnerization of banana starch isolated from underutilized variety: morphological, thermal, functional properties, and digestibility. CyTA-Journal 13:1, 3–9. https://doi.org/10.1080/19476337.2014.902864 doi: 10.1080/19476337.2014.902864
|
| [29] |
Adhiyamaan PS, Parimalavalli R (2020) Effect of dual modification on crystalline formation of resistant starch from cassava. J Food Meas 14: 3520–3528. https://doi.org/10.1007/s11694-020-00580-4 doi: 10.1007/s11694-020-00580-4
|
| [30] |
Jayakody L, Hoover R (2002) The effect of lintnerization on cereal starch granules. Food Res Int 35: 665–680. https://doi.org/10.1016/S0963-9969(01)00204-6 doi: 10.1016/S0963-9969(01)00204-6
|
| [31] |
Ng JQ, Siew CK, Mamat H, et al. (2018) Effect of Acid Methanol Treatment and Heat Moisture Treatment on In Vitro Digestibility and Estimated Glycemic Index of Raw and Gelatinized Sago (Metroxylon Sagu) Starch. Starch 70: 776–780. https://doi.org/10.1002/mdc3.13341 doi: 10.1002/mdc3.13341
|
| [32] |
Brumovsky JO, Thompson DB (2001) Production of boiling‐stable granular resistant starch by partial acid hydrolysis and hydrothermal treatments of high‐amylose maize starch. Cereal Chem 78:680–689. https://doi.org/10.1094/CCHEM.2001.78.6.680 doi: 10.1094/CCHEM.2001.78.6.680
|
| [33] |
Kim JY, Huber KC (2013) Heat-moisture treatment under mildly acidic conditions alters potato starch physicochemical properties and digestibility. Carbohydr Polym 98: 1245–1255. https://doi.org/10.1016/j.carbpol.2013.07.013 doi: 10.1016/j.carbpol.2013.07.013
|
| [34] |
Schmiedl D, Bäuerlein M, Bengs H, et al. (2000) Production of heat-stable, butyrogenic resistant starch. Carbohydr Polym 43: 183–193. https://doi.org/10.1016/S0144-8617(00)00147-8 doi: 10.1016/S0144-8617(00)00147-8
|
| [35] |
De La Rosa-Millán J (2017) Physicochemical, Molecular, and digestion characteristics of annealed and heat-moisture treated starches under acidic, neutral, or alkaline pH. Cereal Chem 94: 770–779. https://doi.org/10.1094/CCHEM-03-16-0068-FI doi: 10.1094/CCHEM-03-16-0068-FI
|
| [36] |
Horstmann SW, Lynch KM, Arendt EK (2017) Starch characteristics linked to gluten-free products. Foods 6(29): 1–21. https://doi.org/10.3390/foods6040029 doi: 10.3390/foods6040029
|
| [37] |
Gidley MJ, Cooke D, Darke AH, et al. (1995) Molecular order and structure in enzyme-resistant retrograded starch. Carbohydr Polym 28: 23–31. https://doi.org/10.1016/0144-8617(96)81387-7 doi: 10.1016/0144-8617(96)81387-7
|
| [38] |
Waduge RN, Warkentin TD, Donner E, et al. (2017) Structure, Physicochemical Properties, and In Vitro Starch Digestibility of Yellow Pea Flour Modified with Different Organic Acids. Cereal Chem 94: 142–150. https://doi.org/10.1094/CCHEM-03-16-0068-FI doi: 10.1094/CCHEM-03-16-0068-FI
|
| [39] |
Sánchez-Rivera MM, Núñez-Santiago M del C, Bello-Pérez LA, et al. (2017) Citric acid esterification of unripe plantain flour: Physicochemical properties and starch digestibility. Starch 69: 1–21. https://doi.org/10.1002/star.201700019 doi: 10.1002/star.201700019
|
| [40] |
Li M-NN, Xie Y, Chen H-QQ, et al. (2019) Effects of heat-moisture treatment after citric acid esterification on structural properties and digestibility of wheat starch, A- and B-type starch granules. Food Chem 272: 523–529. https://doi.org/10.1016/j.foodchem.2018.08.079 doi: 10.1016/j.foodchem.2018.08.079
|
| [41] |
Pratiwi M, Faridah DN, Lioe HN (2018) Structural changes to starch after acid hydrolysis, debranching, autoclaving-cooling cycles, and heat moisture treatment (HMT): A review. Starch 70. https://doi.org/10.1002/star.201700028 doi: 10.1002/star.201700028
|
| [42] |
Duyen TTM, Huong NTM, Phi NTL, et al. (2020) Physicochemical properties and in vitro digestibility of mung-bean starches varying amylose contents under citric acid and hydrothermal treatments. Int J Biol Macromol 164: 651–658. https://doi.org/10.1016/j.ijbiomac.2020.07.187 doi: 10.1016/j.ijbiomac.2020.07.187
|
| [43] |
Hung P V, My NTH, Phi NTL (2014) Impact of acid and heat–moisture treatment combination on physicochemical characteristics and resistant starch contents of sweet potato and yam starches. Starch 66:1013-1021. https://doi.org/10.1002/star.201400104 doi: 10.1002/star.201400104
|
| [44] |
Chung H-JJ, Liu Q, Hoover R (2009) Impact of annealing and heat-moisture treatment on rapidly digestible, slowly digestible and resistant starch levels in native and gelatinized corn, pea and lentil starches. Carbohydr Polym 75: 436–447. https://doi.org/10.1016/j.carbpol.2008.08.006 doi: 10.1016/j.carbpol.2008.08.006
|
| [45] |
Gunaratne A, Hoover R (2002) Effect of heat-moisture treatment on the structure and physicochemical properties of tuber and root starches. Carbohydr Polym 49: 425–437. https://doi.org/10.1016/S0144-8617(01)00354-X doi: 10.1016/S0144-8617(01)00354-X
|
| [46] |
Wu T-Y, Tsai S-J, Sun N-N, et al. (2020) Enhanced thermal stability of green banana starch by heat-moisture treatment and its ability to reduce body fat accumulation and modulate gut microbiota. Int J Biol Macromol 160: 915–924. https://doi.org/10.1016/j.ijbiomac.2020.05.271 doi: 10.1016/j.ijbiomac.2020.05.271
|
| [47] |
Hung P Van, Vien NL, Lan Phi NT (2016) Resistant starch improvement of rice starches under a combination of acid and heat-moisture treatments. Food Chem 191: 67–73. https://doi.org/10.1016/j.foodchem.2015.02.002 doi: 10.1016/j.foodchem.2015.02.002
|


Figures(3) / Tables(5)

Ratu Reni Budiyanti, Didah Nur Faridah, Nur Wulandari, Anuraga Jayanegara, Frendy Ahmad Afandi. Effect of combining acid modification and heat-moisture treatment (HMT) on resistant starch content: A systematic review[J]. AIMS Agriculture and Food, 2023, 8(2): 479-495. doi: 10.3934/agrfood.2023025


 DownLoad: