Avocado's global acceptance has grown, resulting in expanding cultivation, agricultural development, and significant marketing efforts. Publicizing avocado also targets its by-products' nutritional and functional benefits. This is the first bibliometric analysis for avocado. It aims to provide a descriptive structure to identify collaborative patterns and emerging themes in avocado research. Based on the search string used in the article title, the study retrieved 2576 documents from the Scopus database for further analysis. For comparison, we separated the data into two study periods: 1916–2011 and 2012–2021. BibliometriX and VOSviewer software were used to examine the descriptive structure and collaborative patterns, as well as to create maps based on network data. When we compared the two study periods, we identified a changing pattern in descriptive structure, collaboration and research trends. Based on the identified emergent themes of the last decade, we propose that future research focuses on the functional and medicinal properties of avocado, postharvest management and its biological control, plant cultivars and diseases, and physicochemical properties of avocado and its by-products. Further bibliographic support revealed that, in addition to the fruit pulp, non-edible parts of Persea americana (bark, leaves, peel, seeds, and stem), and oil have remarkable concentrations of bioactive compounds with potential biological activity for health benefits.
Citation: Rahimah Zakaria, Patricia Vit, Adi Wijaya, Asma Hayati Ahmad, Zahiruddin Othman, Bruno Mezzetti. A bibliometric review of Persea americana Mill. (Lauraceae): A green gold in agroindustry[J]. AIMS Agriculture and Food, 2022, 7(4): 831-854. doi: 10.3934/agrfood.2022051
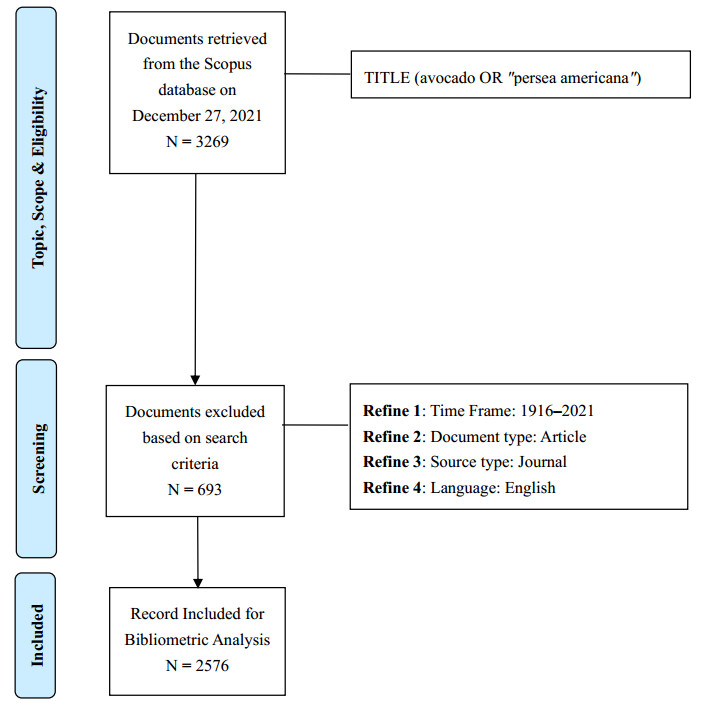
Avocado's global acceptance has grown, resulting in expanding cultivation, agricultural development, and significant marketing efforts. Publicizing avocado also targets its by-products' nutritional and functional benefits. This is the first bibliometric analysis for avocado. It aims to provide a descriptive structure to identify collaborative patterns and emerging themes in avocado research. Based on the search string used in the article title, the study retrieved 2576 documents from the Scopus database for further analysis. For comparison, we separated the data into two study periods: 1916–2011 and 2012–2021. BibliometriX and VOSviewer software were used to examine the descriptive structure and collaborative patterns, as well as to create maps based on network data. When we compared the two study periods, we identified a changing pattern in descriptive structure, collaboration and research trends. Based on the identified emergent themes of the last decade, we propose that future research focuses on the functional and medicinal properties of avocado, postharvest management and its biological control, plant cultivars and diseases, and physicochemical properties of avocado and its by-products. Further bibliographic support revealed that, in addition to the fruit pulp, non-edible parts of Persea americana (bark, leaves, peel, seeds, and stem), and oil have remarkable concentrations of bioactive compounds with potential biological activity for health benefits.

| [1] |
Chen H, Morrell PL, Ashwort VETM, et al. (2009) Tracing the geographic origins of major avocado cultivars. J Hered 100: 56–65. https://doi.org/10.1093/jhered/esn068 doi: 10.1093/jhered/esn068

|
| [2] | Ranade SS, Thiagarajan P (2015) A Review on Persea Americana Mill. (Avocado)—Its fruit and oil. Int J Pharmtech Res 8: 72–77. |
| [3] | FAO (2020) Major tropical fruits: Market review 2019. Economic and Social Development—Markets and Trade. Rome, 1–10. Available from: https://www.fao.org/3/cb0834en/cb0834en.pdf. |
| [4] | https://www.atlasbig.com/en-gb/countries-by-avocado-production |
| [5] |
Hausch BH, Arpaia ML, Campisi Pinto S, et al. (2021) Sensory characterization of two California-grown avocado varieties (Persea americana Mill.) over the harvest season by descriptive analysis and consumer tests. J Food Sci 86: 4134–4147. https://doi.org/10.1111/1750-3841.15867 doi: 10.1111/1750-3841.15867
|
| [6] |
Cheng FW, Ford NA, Taylor MK (2021) US older adults that consume avocado or guacamole have better cognition than non-consumers: National Health and Nutrition Examination Survey 2011–2014. Front Nutr 8: 746453. https://doi.org/10.3389/fnut.2021.746453 doi: 10.3389/fnut.2021.746453
|
| [7] |
Taylor MK, Swerdlow RH, Burns JM, et al. (2019) An experimental ketogenic diet for Alzheimer disease was nutritionally dense and rich in vegetables and avocado. Curr Dev Nutr 3: nzz003. https://doi.org/10.1093/cdn/nzz003 doi: 10.1093/cdn/nzz003
|
| [8] |
Othman NA, Abdul Manaf M, Harith S, et al. (2018) Influence of avocado purée as a fat replacer on nutritional, fatty acid, and organoleptic properties of low-fat muffins. J Am Coll Nutr 37: 583–588. https://doi.org/10.1080/07315724.2018.1451408 doi: 10.1080/07315724.2018.1451408
|
| [9] |
Wang W, Bostic TR, Gu L. (2010) Antioxidant capacities, procyanidins and pigments in avocados of different strains and cultivars. Food Chem 122: 1193–1198. https://doi.org/10.1016/j.foodchem.2010.03.114 doi: 10.1016/j.foodchem.2010.03.114
|
| [10] |
Araújo RG, Rodriguez-Jasso RM, Ruia HA, et al. (2018) Avocado by-products: Nutritional and functional properties. Trends Food Sci Technol 80: 51–60. https://doi.org/10.1016/j.tifs.2018.07.027 doi: 10.1016/j.tifs.2018.07.027
|
| [11] |
Marcos CN, Carro MD, Fernández-Yepes JE, et al. (2020) Utilization of avocado and mango fruit wastes in multi-nutrient blocks for goats feeding: In vitro evaluation. Animals 10: 2279. https://doi.org/10.3390/ani10122279 doi: 10.3390/ani10122279
|
| [12] |
Seshoka ML, Fourie PJ, Kanengoni AT, et al. (2020) Dietary inclusion of ensiled avocado oil cake affects growth, nutrient digestion, and carcass characteristics of pigs. Arq Bras Psicol 50: 847–854. https://doi.org/10.4314/sajas.v50i6.11 doi: 10.4314/sajas.v50i6.11
|
| [13] |
Amado DAV, Helmann GAB, Detoni AM, et al. (2019) Antioxidant and antibacterial activity and preliminary toxicity analysis of four varieties of avocado (Persea americana Mill.). Braz J Food Technol 22: 1–11. https://doi.org/10.1590/1981-6723.04418 doi: 10.1590/1981-6723.04418
|
| [14] |
Rodríguez-Martínez B, Ferreira-Santos P, Gullón B, et al. (2021) Exploiting the potential of bioactive molecules extracted by ultrasounds from avocado peels—food and nutraceutical applications. Antioxidants 10: 1475. https://doi.org/10.3390/antiox10091475 doi: 10.3390/antiox10091475
|
| [15] |
Paniagua S, Reyes S, Lima F, et al. (2021) Combustion of avocado crop residues: Effect of crop variety and nature of nutrients. Fuel 291: 119660. https://doi.org/10.1016/j.fuel.2020.119660 doi: 10.1016/j.fuel.2020.119660
|
| [16] |
Sommaruga R, Eldridge HM (2021) Avocado production: water footprint and socio-economic implications. EuroChoices 20: 48–53. https://doi.org/10.1111/1746-692X.12289 doi: 10.1111/1746-692X.12289
|
| [17] | OECD (2017) Water risk hotspots for agriculture, OECD studies on water (OECD Publishing: Paris). Available from: https://doi.org/10.1787/9789264279551-en. |
| [18] | FAO (Food and Agriculture Organization) (2013) Food wastage footprint: Impacts on natural resources, accessed: 07.10.2014. |
| [19] | Hansen O (2017) Deforestation caused by illegal avocado farming: A case study on the effectiveness of Mexico's payment for ecosystem services program. IARL 49: 89–128. |
| [20] |
Lawrence D, Coe M, Walker W, et al. (2022) The unseen effects of deforestation: biophysical effects on climate. Front For Glob Change 5: 756115. https://doi.org/10.3389/ffgc.2022.756115 doi: 10.3389/ffgc.2022.756115
|
| [21] | California Department of Food and Agriculture (CDFA) (2013) Climate Change Consortium for Specialty Crops: Impacts and Strategies for Resilience. |
| [22] |
Pranckute R (2021) Web of Science (WoS) and Scopus: The titans of bibliographic information in today's academic world. Publications 9: 12. https://doi.org/10.3390/publications9010012 doi: 10.3390/publications9010012
|
| [23] |
Zhu J, Liu W (2020) A Tale of Two Databases: The use of Web of Science and Scopus in academic papers. Scientometrics 123: 321–335. https://doi.org/10.1007/s11192-020-03387-8 doi: 10.1007/s11192-020-03387-8
|
| [24] |
Page MJ, McKenzie JE, Bossuyt PM, et al. (2021) The PRISMA 2020 statement: an updated guideline for reporting systematic reviews. BMJ 372: n71. https://doi.org/10.1136/bmj.n71 doi: 10.1136/bmj.n71
|
| [25] |
Aria M, Cuccurullo C (2017) Bibliometrix: An R-tool for comprehensive science mapping analysis. J Informetr 11: 959–975. https://doi.org/10.1016/j.joi.2017.08.007 doi: 10.1016/j.joi.2017.08.007
|
| [26] | Van Eck NJ, Waltman L (2021) VOSviewer Manual. Manual for VOSviewer version 1.6.17. Leiden, Netherlands: Universiteit Leiden & CWTS Meaningful metrics. Available from: https://www.vosviewer.com/documentation/Manual_VOSviewer_1.6.17.pdf. |
| [27] |
Moral-Muñoz JA, Herrera-Viedma E, Santisteban-Espejo A, et al. (2020) Software tools for conducting bibliometric analysis in science: An up-to-date review. Prof Inferm 29. https://doi.org/10.3145/epi.2020.ene.03 doi: 10.3145/epi.2020.ene.03
|
| [28] |
Yin M, Xu C, Ma J, et al. (2021) Bibliometric analysis and visualization of current research trends in the treatment of cervical spondylotic myelopathy. Global Spine J 11: 988–998. https://doi.org/10.1177/2192568220948832 doi: 10.1177/2192568220948832
|
| [29] | van Zyl J, Groenewald JA (1986) SAAGA 9: 67–71. |
| [30] | OECD/FAO (2021) OECD-FAO Agricultural Outlook 2021–2029, FAO, Rome/OECD Publishing, Paris. Retrieved from: https://doi.org/10.1787/19428846-en. |
| [31] |
Krumreich FD, Borges CD, Mendonça CRB, et al. (2018) Bioactive compounds and quality parameters of avocado oil obtained by different processes. Food Chem 257: 376–381. https://doi.org/10.1016/j.foodchem.2018.03.048 doi: 10.1016/j.foodchem.2018.03.048
|
| [32] |
Tremocoldi MA, Rosalen PL, Franchin M, et al. (2018) Exploration of avocado by-products as natural sources of bioactive compounds. PLoS One 13: e0192577. https://doi.org/10.1371/journal.pone.0192577 doi: 10.1371/journal.pone.0192577
|
| [33] |
Salazar-López NJ, Domínguez-Avila JA, Yahia EM, et al. (2020) Avocado fruit and by-products as potential sources of bioactive compounds. Food Res Int 138(PtA): 109774. https://doi.org/10.1016/j.foodres.2020.109774 doi: 10.1016/j.foodres.2020.109774
|
| [34] |
Ramos-Aguilar AL, Ornelas-Paz J, Tapia-Vargas LM, et al. (2021) Comparative study on the phytochemical and nutrient composition of ripe fruit of Hass and Hass type avocado cultivars. J Food Compos Anal 97: 103796. https://doi.org/10.1016/j.jfca.2020.103796 doi: 10.1016/j.jfca.2020.103796
|
| [35] |
Rico-Londono JF, Buitrago-Patino DJ, Agudelo-Laverde LM (2021) Combination of methods as alternative to maintain the physical-chemical properties and microbiological content of Hass avocado pulp during storage. Food Biosci 44(Part A): 101372. https://doi.org/10.1016/j.fbio.2021.101372 doi: 10.1016/j.fbio.2021.101372
|
| [36] |
Kämper W, Trueman SJ, Tahmasbian I, et al. (2020) Rapid determination of nutrient concentrations in Hass avocado fruit by vis/NIR hyperspectral imaging of flesh or skin. Remote Sens 12: 3409. https://doi.org/10.3390/rs12203409 doi: 10.3390/rs12203409
|
| [37] |
Vinha AF, Sousa C, Soares MO, et al. (2021) Avocado and its by-products: natural sources of nutrients, phytochemical compounds and functional properties. Curr Res Agric Food Sci 1. https://doi.org/10.9734/bpi/crafs/v1 doi: 10.9734/bpi/crafs/v1
|
| [38] |
Velderrain-Rodríguez GR, Quero J, Osada J, et al. (2021) Phenolic-rich extracts from avocado fruit residues as functional food ingredients with antioxidant and antiproliferative properties. Biomolecules 11: 977. https://doi.org/10.3390/biom11070977 doi: 10.3390/biom11070977
|
| [39] |
Bhuyan DJ, Alsherbiny MA, Perera S, et al. (2019) The odyssey of bioactive compounds in avocado (Persea americana) and their health benefits. Antioxidants 8: 426. https://doi.org/10.3390/antiox8100426 doi: 10.3390/antiox8100426
|
| [40] |
Gupta E, Mishra P (2021) Functional food with some health benefits, so called superfood: A review. Curr Nutr Food Sci 17: 144–166. https://doi.org/10.2174/1573401316999200717171048 doi: 10.2174/1573401316999200717171048
|
| [41] |
Kumoro AC, Alhanif M, Wardhani DH (2020) A critical review on tropical fruits seeds as prospective sources of nutritional and bioactive compounds for functional foods development: A case of Indonesian exotic fruits. Int J Food Sci 2020: 4051475. https://doi.org/10.1155/2020/4051475 doi: 10.1155/2020/4051475
|
| [42] |
Cerda-Opazo P, Gotteland M, Oyarzun-Ampuero FA, et al. (2021) Design, development and evaluation of nanoemulsion containing avocado peel extract with anticancer potential: A novel biological active ingredient to enrich food. Food Hydrocoll 111: 106370. https://doi.org/10.1016/j.jksus.2018.10.010 doi: 10.1016/j.jksus.2018.10.010
|
| [43] |
Figueroa JG, Borrás-Linares I, Del Pino-García R, et al. (2021) Functional ingredient from avocado peel: Microwave-assisted extraction, characterization and potential applications for the food industry. Food Chem 352: 129300. https://doi.org/10.1016/j.foodchem.2021.129300 doi: 10.1016/j.foodchem.2021.129300
|
| [44] |
Krawęcka A, Libera J, Latoch A (2021) The use of the probiotic Lactiplantibacillus plantarum 299v in the technology of non-dairy ice cream based on avocado. Foods 10: 2492. https://doi.org/10.3390/foods10102492 doi: 10.3390/foods10102492
|
| [45] |
Velderrain-Rodríguez GR, Salvia-Trujillo L, Martín-Belloso O (2021) Lipid digestibility and polyphenols bioaccessibility of oil-in-water emulsions containing avocado peel and seed extracts as affected by the presence of low methoxyl pectin. Foods 10: 2193. https://doi.org/10.3390/foods10092193 doi: 10.3390/foods10092193
|
| [46] |
Campos D, Teran-Hilares F, Chirinos R, et al. (2020) Bioactive compounds and antioxidant activity from harvest to edible ripeness of avocado cv. Hass (Persea americana) throughout the harvest seasons. Int J Food Sci Technol 55: 2208–2218. https://doi.org/10.1111/ijfs.14474 doi: 10.1111/ijfs.14474
|
| [47] |
Corrales-García JE, del Rosario García-Mateos M, Martínez-Lopez E, et al. (2019) Anthocyanin and oil contents, fatty acids profiles and antioxidant activity of Mexican landrace avocado fruits. Plant Foods Human Nutr 74: 210–215. https://doi.org/10.1007/s11130-019-00721-1 doi: 10.1007/s11130-019-00721-1
|
| [48] |
Morais DR, Rotta EM, Sargi SC, et al. (2015) Antioxidant activity, phenolics and UPLC-ESI(-)-MS of extracts from different tropical fruits parts and processed peels. Food Res Int 77: 392–399. https://doi.org/10.1016/j.foodres.2015.08.036 doi: 10.1016/j.foodres.2015.08.036
|
| [49] |
Wang M, Zheng Y, Khuong T, et al. (2012) Effect of harvest date on the nutritional quality and antioxidant capacity in 'Hass' avocado during storage. Food Chem 135: 694–698. https://doi.org/10.1016/j.foodchem.2012.05.022 doi: 10.1016/j.foodchem.2012.05.022
|
| [50] |
Pacheco LS, Bradley RD, Denenberg JO, et al. (2021) Effects of different allotments of avocados on the nutritional status of families: A cluster randomized controlled trial. Nutrients 13: 4021. https://doi.org/10.3390/nu13114021 doi: 10.3390/nu13114021
|
| [51] |
Escalante-Araiza F, Gutiérrez-Salmeán G (2021) Traditional Mexican foods as functional agents in the treatment of cardiometabolic risk factors. Crit Rev Food Sci Nutr 61: 1353–1364. https://doi.org/10.1080/10408398.2020.1758028 doi: 10.1080/10408398.2020.1758028
|
| [52] |
Guan VX, Neale EP, Probst YC (2021) Consumption of avocado and associations with nutrient, food and anthropometric measures in a representative survey of Australians: a secondary analysis of the 2011-2012 National Nutrition and Physical Activity Survey. Br J Nutr 29: 1–8. https://doi.org/10.1017/S0007114521003913 doi: 10.1017/S0007114521003913
|
| [53] |
Naveh E, Werman MJ, Sabo E, et al. (2002) Defatted avocado pulp reduces body weight and total hepatic fat but increases plasma cholesterol in male rats fed diets with cholesterol. J Nutr 132: 2015–2018. https://doi.org/10.1093/jn/132.7.2015 doi: 10.1093/jn/132.7.2015
|
| [54] |
Idris S, Ndukwe G, Gimba C (2009) Preliminary phytochemical screening and antimicrobial activity of seed extracts of Persea americana (avocado pear). Bayero J Pure Appl Sci 2: 173–176. https://doi.org/10.4314/bajopas.v2i1.58538 doi: 10.4314/bajopas.v2i1.58538
|
| [55] |
Dabas D, Shegog RM, Ziegler GR, et al. (2013) Avocado (Persea americana) seed as a source of bioactive phytochemicals. Curr Pharm Des 19: 6133–6140. https://doi.org/10.2174/1381612811319340007 doi: 10.2174/1381612811319340007
|
| [56] | Alkhalaf MI, Alansari WS, Ibrahim EA, et al. (2019) Anti-oxidant, anti-inflammatory and anti-cancer activities of avocado (Persea americana) fruit and seed extract. J King Saud Univ Sci 31: 1358–1362. https://doi.org/1 |
| [57] |
Athaydes BR, Alves GM, Assis AD, et al. (2019) Avocado seeds (Persea americana Mill.) prevents indomethacin-induced gastric ulcer in mice. Food Res Int 119: 751–760. https://doi.org/10.1016/j.foodres.2018.10.057 doi: 10.1016/j.foodres.2018.10.057
|
| [58] |
Wang L, Tao L, Hao L, et al. (2020) A moderate-fat diet with one avocado per day increases plasma antioxidants and decreases the oxidation of small, dense LDL in adults with overweight and obesity: a randomized controlled trial. J Nutr 150: 276–284. https://doi.org/10.1093/jn/nxz231 doi: 10.1093/jn/nxz231
|
| [59] |
Bill M, Sivakumar D, Thompson AK, et al. (2014) Avocado fruit quality management during the postharvest supply chain. Food Rev Int 30: 169–202. https://doi.org/10.1080/87559129.2014.907304 doi: 10.1080/87559129.2014.907304
|
| [60] | Sabbadini S, Capocasa F, Battino M, et al. (2021) Improved nutritional quality in fruit tree species through traditional and biotechnological approaches. Trends Food Sci Technol 117: 125–138. |
| [61] |
Calderón-Vázquez C, Durbin ML, Ashworth VETM, et al. (2013) Quantitative genetic analysis of three important nutritive traits in the fruit of avocado. J Am Soc Hortic Sci 138: 283–289. https://doi.org/10.21273/JASHS.138.4.283 doi: 10.21273/JASHS.138.4.283
|
| [62] |
Tienda S, Vida C, Lagendijk E, et al. (2020) Soil application of a formulated biocontrol rhizobacterium, Pseudomonas chlororaphis PCL1606, induces soil suppressiveness by impacting specific microbial communities. Front Microbiol 11: 1874. https://doi.org/10.3389/fmicb.2020.01874 doi: 10.3389/fmicb.2020.01874
|
| [63] |
Tzec-Interián JA, Desgarennes D, Carrión G, et al. (2020) Characterization of plant growth-promoting bacteria associated with avocado trees (Persea americana Miller) and their potential use in the biocontrol of Scirtothrips perseae (avocado thrips). PLoS One 15: e0231215. https://doi.org/10.1371/journal.pone.0231215 doi: 10.1371/journal.pone.0231215
|
| [64] |
van den Berg N, Swart V, Backer R, et al. (2021) Advances in understanding defense mechanisms in Persea americana against Phytophthora cinnamomi. Front Plant Sci 12: 636339. https://doi.org/10.3389/fpls.2021.636339 doi: 10.3389/fpls.2021.636339
|
| [65] |
Juma I, Geleta M, Nyomora A, et al. (2020) Genetic diversity of avocado from the southern highlands of Tanzania as revealed by microsatellite markers. Hereditas 157: 40. https://doi.org/10.1186/s41065-020-00150-0 doi: 10.1186/s41065-020-00150-0
|
| [66] |
Rubinstein M, Eshed R, Rozen A, et al. (2019) Genetic diversity of avocado (Persea americana Mill.) germplasm using pooled sequencing. BMC Genomics 20: 379. https://doi.org/10.1186/s12864-019-5672-7 doi: 10.1186/s12864-019-5672-7
|
| [67] |
Kiggundu N, Migliaccio KW, Schaffer B, et al. (2012) Water savings, nutrient leaching, and fruit yield in a young avocado orchard as affected by irrigation and nutrient management. Irrig Sci 30: 275–286. https://doi.org/10.1007/s00271-011-0280-6 doi: 10.1007/s00271-011-0280-6
|
| [68] |
Atucha A, Merwin IA, Brown MG, et al. (2013) Soil erosion, runoff and nutrient losses in an avocado (Persea americana Mill) hillside orchard under different groundcover management systems. Plant Soil 368: 393–406. https://doi.org/10.1007/s11104-012-1520-0 doi: 10.1007/s11104-012-1520-0
|
| [69] |
Campisi-Pinto S, Zheng Y, Rolshausen PE, et al. (2017) Optimal nutrient concentration ranges of 'Hass' avocado cauliflower stage inflorescences—potential diagnostic tool to optimize tree nutrient status and increase yield. HortScience 52: 1707–1715. https://doi.org/10.21273/HORTSCI12437-17 doi: 10.21273/HORTSCI12437-17
|
| [70] |
Lovatt CJ (2013) Properly timing foliar-applied fertilizers increases efficacy: A review and update on timing foliar nutrient applications to citrus and avocado. HortTechnology 23: 536–541. https://doi.org/10.21273/HORTTECH.23.5.536 doi: 10.21273/HORTTECH.23.5.536
|
| [71] |
Silber A, Naor A, Cohen H, et al. (2018) Avocado fertilization: Matching the periodic demand for nutrients. Sci Hortic 241: 231–240. https://doi.org/10.1016/J.SCIENTA.2018.06.094 doi: 10.1016/J.SCIENTA.2018.06.094
|
| [72] |
Salazar-García S, González-Durán IJ, Ibarra-Estrada ME (2015) Identification of the appropriate leaf sampling period for nutrient analysis in 'Hass' avocado. HortScience 50: 130–136. https://doi.org/10.21273/HORTSCI.50.1.130 doi: 10.21273/HORTSCI.50.1.130
|
| [73] |
Alvarez-Acosta C, Marrero-Dominguez A, Gallo-Llobet L, et al. (2019) Effects of NaCl and NaHCO3 stress on morphological growth and nutrient metabolism on selected avocados (Persea americana Mill.). J Plant Nutr 42: 164–177. https://doi.org/10.1080/01904167.2018.1551490 doi: 10.1080/01904167.2018.1551490
|
| [74] |
Tzatzani TT, Kavroulakis N, Doupis G, et al. (2020) Nutritional status of 'Hass' and 'Fuerte' avocado (Persea americana Mill.) plants subjected to high soil moisture. J Plant Nutr 43: 327–334. https://doi.org/10.1080/01904167.2019.1683192 doi: 10.1080/01904167.2019.1683192
|
| [75] | Salazar-García S, Mellado-Vázquez A, Ibarra-Estrada ME, et al. (2021) Nutrient removal by Mendez avocado fruit. Rev Fitotec Mex 44: 151–159. |
| [76] |
Beyer CP, Cuneo IF, Alvaro JE, et al. (2021) Evaluation of aerial and root plant growth behavior, water and nutrient use efficiency and carbohydrate dynamics for Hass avocado grown in a soilless and protected growing system. Sci Hortic 277: 109830. https://doi.org/10.1016/j.scienta.2020.109830 doi: 10.1016/j.scienta.2020.109830
|
| [77] |
Reddy M, Moodley R, Jonnalagadda SB (2014) Elemental uptake and distribution of nutrients in avocado mesocarp and the impact of soil quality. Environ Monit Assess 186: 4519–4529. https://doi.org/10.1007/s10661-014-3716-7 doi: 10.1007/s10661-014-3716-7
|
| [78] |
Abdulridha J, Ampatzidis Y, Ehsani R, et al. (2018) Evaluating the performance of spectral features and multivariate analysis tools to detect laurel wilt disease and nutritional deficiency in avocado. Comput Electron Agric 15: 203–211. https://doi.org/10.1016/j.compag.2018.10.016 doi: 10.1016/j.compag.2018.10.016
|
| [79] |
Hariharan J, Fuller J, Ampatzidis Y, et al. (2019) Finite difference analysis and bivariate correlation of hyperspectral data for detecting laurel wilt disease and nutritional deficiency in avocado. Remote Sens 11: 1748. https://doi.org/10.3390/rs11151748 doi: 10.3390/rs11151748
|
| [80] |
Saucedo JR, Ploetz RC, Konkol JL, et al. (2018) Nutritional symbionts of a putative vector, Xyleborus bispinatus, of the laurel wilt pathogen of avocado Raffaelea lauricola. Symbiosis 75: 29–38. https://doi.org/10.1007/s13199-017-0514-3 doi: 10.1007/s13199-017-0514-3
|
| [81] |
Ramírez-Gil JG, Henao-Rojas JC, Morales-Osorio JG (2021) Postharvest diseases and disorders in avocado cv. Hass and their relationship to preharvest management practices. Heliyon 7: e05905. https://doi.org/10.1016/j.heliyon.2021.e05905 doi: 10.1016/j.heliyon.2021.e05905
|
| [82] |
Ramírez-Gil JG, Castañeda-Sánchez D, Morales-Osorio JG (2021) Edaphic factors associated with the development of avocado wilt complex and implementation of a GIS tool for risk visualization. Sci Hortic 288: 110316. https://doi.org/10.1016/j.scienta.2021.110316 doi: 10.1016/j.scienta.2021.110316
|
| [83] |
Kamilaris A, Kartakoullis A, Prenafeta-Boldú FX (2017) A review on the practice of big data analysis in agriculture. Comput Electron Agric 143: 23–37. https://doi.org/10.1016/j.compag.2017.09.037 doi: 10.1016/j.compag.2017.09.037
|
| [84] | Karmas A, Tzotsos A, Karantzalos K (2016) Geospatial big data for environmental and agricultural applications. Springer International Publishing. |
| [85] |
Ramírez-Gil JG, Morales-Osorio JG (2018) Microbial dynamics in the soil and presence of the avocado wilt complex in plots cultivated with avocado cv. Hass under ENSO phenomena (El Niño-La Niña). Sci Hortic 240: 273–280. https://doi.org/10.1016/j.scienta.2018.06.047 doi: 10.1016/j.scienta.2018.06.047
|


Figures(5) / Tables(6)

Rahimah Zakaria, Patricia Vit, Adi Wijaya, Asma Hayati Ahmad, Zahiruddin Othman, Bruno Mezzetti. A bibliometric review of Persea americana Mill. (Lauraceae): A green gold in agroindustry[J]. AIMS Agriculture and Food, 2022, 7(4): 831-854. doi: 10.3934/agrfood.2022051


 DownLoad: