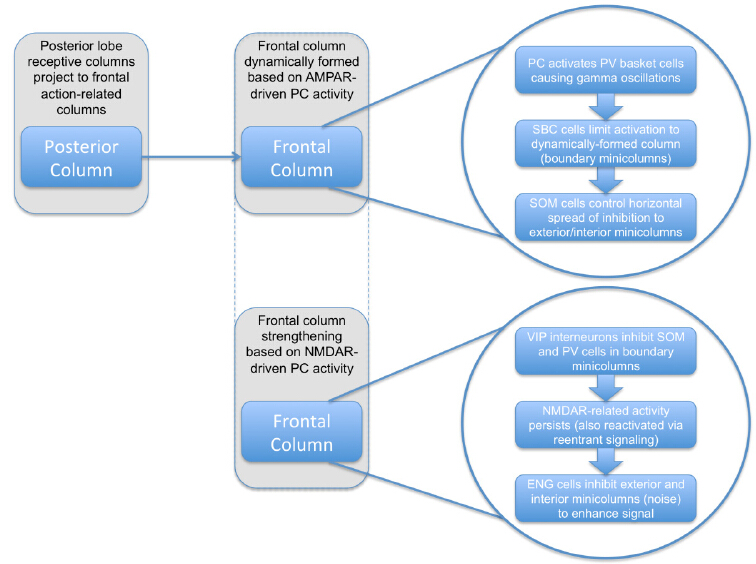
The role of gamma-band synchronization and NMDA receptors in cognitive functions and neuropsychiatric disorders has received increased attention over the past two decades, with significant controversy about their roles. The role of the cortical column as a basic unit in cortical processing has also been debated. The current paper presents the theoretical argument that the dynamically formed column is the binary unit (bit) involved in all cortical processing and memory, and that gamma-band synchronization is required for columnar formation. Moreover, the role of NMDA receptors is explained as allowing the consolidation of synchronized boundary minicolumns that serve as the bit, as well as strengthening the connections among the circuit of columns that are involved with any given memory. Following a discussion of the microcircuitry that may be involved, there is a brief discussion on how the serious neuropsychiatric disorders of schizophrenia, autism, and Alzheimer’s disease can be conceptualized as disorders of disrupted column formation. The arguments presented provide a theoretical basis for future research to determine the validity of this novel view.
Citation: Robert A. Moss, Jarrod Moss. The Role of Dynamic Columns in Explaining Gamma-band Synchronization and NMDA Receptors in Cognitive Functions[J]. AIMS Neuroscience, 2014, 1(1): 65-88. doi: 10.3934/Neuroscience.2014.1.65
The role of gamma-band synchronization and NMDA receptors in cognitive functions and neuropsychiatric disorders has received increased attention over the past two decades, with significant controversy about their roles. The role of the cortical column as a basic unit in cortical processing has also been debated. The current paper presents the theoretical argument that the dynamically formed column is the binary unit (bit) involved in all cortical processing and memory, and that gamma-band synchronization is required for columnar formation. Moreover, the role of NMDA receptors is explained as allowing the consolidation of synchronized boundary minicolumns that serve as the bit, as well as strengthening the connections among the circuit of columns that are involved with any given memory. Following a discussion of the microcircuitry that may be involved, there is a brief discussion on how the serious neuropsychiatric disorders of schizophrenia, autism, and Alzheimer’s disease can be conceptualized as disorders of disrupted column formation. The arguments presented provide a theoretical basis for future research to determine the validity of this novel view.

| [1] |
Gray CM, Singer W. (1989) Stimulus-specific neuronal oscillations in orientation columns of cat visual cortex. Proc Natl Acad Sci 86: 1698-1702. doi: 10.1073/pnas.86.5.1698

|
| [2] |
Yang J-W, An S, Sun J-J, Reyes-Puerta V, Kindler J, Berger T, Kilb W, Luhmann HJ. (2013) Thalamic Network Oscillations Synchronize Ontogenetic Columns in the Newborn Rat Barrel Cortex. Cereb Cortex 23: 1299-1316. doi: 10.1093/cercor/bhs103
|
| [3] |
Steriade M, Amzica F. (1996) Intracortical and corticothalamic coherency of fast spontaneous oscillations. Proc Natl Acad Sci 93: 2533-2538. doi: 10.1073/pnas.93.6.2533
|
| [4] |
Singer W. (1999) Neuronal synchrony: a versatile code for the definition of relations? Neuron 24:49-65. doi: 10.1016/S0896-6273(00)80821-1
|
| [5] |
Fries P. (2009) Neuronal Gamma-Band Synchronization as a Fundamental Process in Cortical Computation. Annu Rev Neurosci 32: 209-224. doi: 10.1146/annurev.neuro.051508.135603
|
| [6] |
Ray S, Maunsell, JHR. (2010) Differences in Gamma Frequencies across Visual Cortex Restrict Their Possible Use in Computation. Neuron 67: 885-896. doi: 10.1016/j.neuron.2010.08.004
|
| [7] |
Jia X, Xing D Kohn A. (2013) No Consistent Relationship between Gamma Power and Peak Frequency in Macaque Primary Visual Cortex. J Neurosci 33: 17-25. doi: 10.1523/JNEUROSCI.1687-12.2013
|
| [8] |
Burns SP, Xing D, Shapley RM. (2011) Is Gamma-Band Activity in the Local Field Potential of V1 Cortex a “Clock” or Filtered Noise? J Neurosci 31: 9658-9664. doi: 10.1523/JNEUROSCI.0660-11.2011
|
| [9] |
Merker B. (2013) Cortical gamma oscillations: the functional key is activation, not cognition. Neurosci Biobehav Rev 37: 401-417. doi: 10.1016/j.neubiorev.2013.01.013
|
| [10] |
Guo W, Chambers AR, Darrow KN, et al. (2012) Robustness of Cortical Topography across Fields, Laminae, Anesthetic States, and Neurophysiological Signal Types. J Neurosci 32:9159-9172. doi: 10.1523/JNEUROSCI.0065-12.2012
|
| [11] | Mountcastle VB. (1957) Modality and topographic properties of single neurons of cat's somatic sensory cortex. J Neurophysiol 20: 408-434. |
| [12] |
Mountcastle VB. (1997) The columnar organization of the neocortex. Brain 120: 701-722. doi: 10.1093/brain/120.4.701
|
| [13] |
Horton JC Adams DL. (2005) The cortical column: a structure without a function. Philos Trans R Soc B Biol Sci 360: 837-862. doi: 10.1098/rstb.2005.1623
|
| [14] | Moss RA. (2006) Of bits and logic: Cortical columns in learning and memory. J Mind Behav 27:215-246. |
| [15] | Moss RA, Hunter BP, Shah D Havens TL. (2012) A Theory of Hemispheric Specialization Based on Cortical Columns. J Mind Behav 33: 141-172. |
| [16] | Moss RA. (2013) Psychotherapy and the Brain: The Dimensional Systems Model and Clinical Biopsychology. J Mind Behav 34: 63-89. |
| [17] | Moss RA. (2013) Gamma-band Synchronization & Cortical Columns. Neuropsychotherapist 3:126-127. |
| [18] | Luria AR. (1966) Higher cortical functions in man. New York: Basic Books. |
| [19] | Lezak MD, Howieson DB, Loring DW and Hannay HJ. (2004) Neuropsychological Assessment 4 Eds., Oxford: Oxford University Press. |
| [20] | Calvin W. (1995) Cortical columns, modules, and Hebbian cell assemblies. In Handbook of brain theory and neural networks, Arbib MA. Author. Cambridge, MA: MIT Press. 269-275. |
| [21] |
Tulving E, Thomson DM. (1973) Encoding specificity and retrieval processes in episodic memory. Psychol Rev 80: 352-373. doi: 10.1037/h0020071
|
| [22] |
Rissman J Wagner AD. (2012) Distributed representations in memory: Insights from functional brain imaging. Annu Rev Psychol 63: 101-128. doi: 10.1146/annurev-psych-120710-100344
|
| [23] |
Polyn SM, Natu VS, Cohe JD and Norman KA. (2005) Category-specific cortical activity precedes retrieval during memory search. Science 310: 1963-1966. doi: 10.1126/science.1117645
|
| [24] | Gazzaniga MS. (2002) Consciousness. In Encyclopedia of the human brain, Ramachandran VS, Eds. New York: Academic Press, 31-35. |
| [25] |
Moss RA. (2007) Negative emotional memories in clinical treatment: Theoretical considerations. J Psychother Integr 17: 209-224. doi: 10.1037/1053-0479.17.2.209
|
| [26] |
Olshausen BA Field DJ. (2004) Sparse coding of sensory inputs. Curr Opin Neurobiol 14:481-487. doi: 10.1016/j.conb.2004.07.007
|
| [27] |
Song S, Sjöström PJ, Reigl M, Nelson S Chklovskii DB. (2005) Highly Nonrandom Features of Synaptic Connectivity in Local Cortical Circuits. PLoS Biol 3: e68. doi: 10.1371/journal.pbio.0030068
|
| [28] |
Perin R, Berger TK Markram H. (2011) A synaptic organizing principle for cortical neuronal groups. Proc Natl Acad Sci 108: 5419-5424. doi: 10.1073/pnas.1016051108
|
| [29] |
Feldmeyer D, Brecht M, Helmchen F, Petersen CCH, Poulet JFA, Staiger JF, Luhmann HJ Schwarz C. (2013) Barrel cortex function. Prog Neurobiol 103: 3-27. doi: 10.1016/j.pneurobio.2012.11.002
|
| [30] |
Avermann M, Tomm, C, Mateo C, Gerstner W Petersen CCH. (2012) Microcircuits of excitatory and inhibitory neurons in layer 2/3 of mouse barrel cortex. J Neurophysiol 107: 3116-3134. doi: 10.1152/jn.00917.2011
|
| [31] |
Crochet S, Poulet JF, Kremer Y, Petersen CC. (2011) Synaptic Mechanisms Underlying Sparse Coding of Active Touch. Neuron 69: 1160-1175. doi: 10.1016/j.neuron.2011.02.022
|
| [32] |
Kerr JN, de Kock CP, Greenberg DS, Bruno RM, Sakmann B, Helmchen F. (2007) Spatial Organization of Neuronal Population Responses in Layer 2/3 of Rat Barrel Cortex. J Neurosci 27:13316-13328. doi: 10.1523/JNEUROSCI.2210-07.2007
|
| [33] |
Lefort S, Tomm C, Floyd Sarria JC, Petersen CC. (2009) The Excitatory Neuronal Network of the C2 Barrel Column in Mouse Primary Somatosensory Cortex. Neuron 61: 301-316. doi: 10.1016/j.neuron.2008.12.020
|
| [34] |
O'Connor DH, Peron SP, Huber D, Svoboda K. (2010) Neural Activity in Barrel Cortex Underlying Vibrissa-Based Object Localization in Mice. Neuron 67: 1048-1061. doi: 10.1016/j.neuron.2010.08.026
|
| [35] |
Yassin L, Benedetti BL, Jouhanneau JS, Wen JA, Poulet JF, Barth AL. (2010) An Embedded Subnetwork of Highly Active Neurons in the Neocortex. Neuron 68: 1043-1050. doi: 10.1016/j.neuron.2010.11.029
|
| [36] |
Ohki K, Chung S, Ch'ng YH, Kara P, Reid RC. (2005) Functional imaging with cellular resolution reveals precise micro-architecture in visual cortex. Nature 433: 597-603. doi: 10.1038/nature03274
|
| [37] | Bruno RM, Khatri V, Land PW, Simons DJ. (2003) Thalamocortical angular tuning domains within individual barrels of rat somatosensory cortex. J Neurosci 23: 9565-9574. |
| [38] |
Favorov OV, Diamond ME, Whitsel BL. (1987) Evidence for a mosaic representation of the body surface in area 3b of the somatic cortex of cat. Proc Natl Acad Sci 84: 6606-6610. doi: 10.1073/pnas.84.18.6606
|
| [39] |
Packer AM, Yuste R. (2011) Dense, Unspecific Connectivity of Neocortical Parvalbumin-Positive Interneurons: A Canonical Microcircuit for Inhibition? J Neurosci 31:13260-13271. doi: 10.1523/JNEUROSCI.3131-11.2011
|
| [40] |
Fino E, Packer AM, Yuste R. (2013) The logic of inhibitory connectivity in the neocortex. The Neuroscientist 19: 228-237. doi: 10.1177/1073858412456743
|
| [41] |
Berger TK, Silberberg G, Perin R, Markram H. (2010) Brief Bursts Self-Inhibit and Correlate the Pyramidal Network. PLoS Biol 8: e1000473. doi: 10.1371/journal.pbio.1000473
|
| [42] |
Börgers C, Talei Franzesi G, LeBeau FEN, Boyden ES, Kopell NJ. (2012) Minimal Size of Cell Assemblies Coordinated by Gamma Oscillations. PLoS Comput Biol 8: e1002362. doi: 10.1371/journal.pcbi.1002362
|
| [43] |
Börgers C, Epstein S, Kopell NJ. (2005) Background gamma rhythmicity and attention in cortical local circuits: A computational study. Proc Natl Acad Sci USA 102: 7002-7007. doi: 10.1073/pnas.0502366102
|
| [44] |
Hirata Y, and Sawaguchi T. (2008) Functional columns in the primate prefrontal cortex revealed by optical imaging in vitro. Neurosci Res 61: 1-10. doi: 10.1016/j.neures.2008.01.003
|
| [45] |
Khazipov R, Minlebaev M Valeeva G. (2013) Early gamma oscillations. Neuroscience 250:240-252. doi: 10.1016/j.neuroscience.2013.07.019
|
| [46] |
Minlebaev M, Colonnese M, Tsintsadze T, Sirota A, Khazipov R. (2011) Early Gamma Oscillations Synchronize Developing Thalamus and Cortex. Science 334: 226-229. doi: 10.1126/science.1210574
|
| [47] |
Vicente R, Gollo LL, Mirasso CR, Fischer I Pipa G. (2008) Dynamical relaying can yield zero time lag neuronal synchrony despite long conduction delays. Proc Natl Acad Sci 105:17157-17162. doi: 10.1073/pnas.0809353105
|
| [48] |
Gruber T Müller MM. (2002) Effects of picture repetition on induced gamma band responses, evoked potentials, and phase synchrony in the human EEG. Cogn Brain Res 13: 377-392. doi: 10.1016/S0926-6410(01)00130-6
|
| [49] | Ahmed OJ Cash SS. (2013) Finding synchrony in the desynchronized EEG: the history and interpretation of gamma rhythms. Front Integr Neurosci 7: 58. |
| [50] |
Isaacson JS, Scanziani M. (2011) How Inhibition Shapes Cortical Activity. Neuron 72: 231-243. doi: 10.1016/j.neuron.2011.09.027
|
| [51] | Uhlhaas P, Pipa G, Lima B, Melloni L, Neuenschwander S, Nikolić D, Singer W, Uhlhaas PJ, Pipa G, Lima B, et al. (2009) Neural synchrony in cortical networks: history, concept and current status. Front Integr Neurosci 3: 17. |
| [52] |
Amzica F Steriade M. (1996) Progressive cortical synchronization of ponto-geniculo-occipital potentials during rapid eye movement sleep. Neuroscience 72: 309-314. doi: 10.1016/0306-4522(96)00012-7
|
| [53] | Loebel A, Nelken I Tsodyks M. (2007) Processing of sounds by population spikes in a model of primary auditory cortex. Front Neurosci 1: 1. |
| [54] |
Bathellier B, Ushakova L Rumpel S. (2012) Discrete Neocortical Dynamics Predict Behavioral Categorization of Sounds. Neuron 76: 435-449. doi: 10.1016/j.neuron.2012.07.008
|
| [55] |
Roberts MJ, Lowet E, Brunet NM, Ter Wal M, Tiesinga P, Fries P De Weerd P. (2013) Robust Gamma Coherence between Macaque V1 and V2 by Dynamic Frequency Matching. Neuron 78:523-536. doi: 10.1016/j.neuron.2013.03.003
|
| [56] |
Ince RAA, Panzeri S Kayser C. (2013) Neural Codes Formed by Small and Temporally Precise Populations in Auditory Cortex. J Neurosci 33: 18277-18287. doi: 10.1523/JNEUROSCI.2631-13.2013
|
| [57] |
Bragin A, Almajano J, Kheiri F, Engel JJ. (2014) Functional Connectivity in the Brain Estimated by Analysis of Gamma Events. PLoS ONE 9: e85900. doi: 10.1371/journal.pone.0085900
|
| [58] |
Buzsáki G, Wang XJ. (2012) Mechanisms of Gamma Oscillations. Annu Rev Neurosci 35:203-225. doi: 10.1146/annurev-neuro-062111-150444
|
| [59] |
Wang L, Liu X, Guise KG, Knight RT, Ghajar J Fan J. (2010) Effective Connectivity of the Fronto-parietal Network during Attentional Control. J Cogn Neurosci 22: 543-553. doi: 10.1162/jocn.2009.21210
|
| [60] |
Douglas RJ Martin KAC. (2004) Neuronal Circuits of the Neocortex. Annu Rev Neurosci 27:419-451. doi: 10.1146/annurev.neuro.27.070203.144152
|
| [61] |
Tiesinga P Sejnowski TJ. (2009) Cortical Enlightenment: Are Attentional Gamma Oscillations Driven by ING or PING? Neuron 63: 727-732. doi: 10.1016/j.neuron.2009.09.009
|
| [62] |
Wester JC Contreras D. (2012) Columnar Interactions Determine Horizontal Propagation of Recurrent Network Activity in Neocortex. J Neurosci 32: 5454-5471. doi: 10.1523/JNEUROSCI.5006-11.2012
|
| [63] | Amzica F Steriade M. (1995) Short- and long-range neuronal synchronization of the slow. (< 1 Hz) cortical oscillation. J Neurophysiol 73: 20-38. |
| [64] |
Rutishauser U, Slotine JJ Douglas RJ. (2012) Competition Through Selective Inhibitory Synchrony. Neural Comput 24: 2033-2052. doi: 10.1162/NECO_a_00304
|
| [65] |
Gonzalez-Burgos G Lewis DA. (2012) NMDA Receptor Hypofunction, Parvalbumin-Positive Neurons, and Cortical Gamma Oscillations in Schizophrenia. Schizophr Bull 38: 950-957. doi: 10.1093/schbul/sbs010
|
| [66] |
Wang H, Hu Y Tsien JZ. (2006) Molecular and systems mechanisms of memory consolidation and storage. Prog Neurobiol 79: 123-135. doi: 10.1016/j.pneurobio.2006.06.004
|
| [67] |
Shimizu E, Tang YP, Rampon C Tsien J Z. (2000) NMDA Receptor-Dependent Synaptic Reinforcement as a Crucial Process for Memory Consolidation. Science 290: 1170-1174. doi: 10.1126/science.290.5494.1170
|
| [68] | Luczak A and MacLean JN. (2012) Default activity patterns at the neocortical microcircuit level. Front Integr Neurosci 6: 30. |
| [69] |
Bermudez Contreras EJ, Schjetnan AGP, Muhammad A, Bartho P, McNaughton BL, Kolb B, Gruber AJ Luczak A. (2013) Formation and Reverberation of Sequential Neural Activity Patterns Evoked by Sensory Stimulation Are Enhanced during Cortical Desynchronization. Neuron 79:555-566. doi: 10.1016/j.neuron.2013.06.013
|
| [70] |
Fukushima M, Saunders RC, Leopold DA, Mishkin M Averbeck BB. (2012) Spontaneous High-Gamma Band Activity Reflects Functional Organization of Auditory Cortex in the Awake Macaque. Neuron 74: 899-910. doi: 10.1016/j.neuron.2012.04.014
|
| [71] |
Chen X, Rochefort NL, Sakmann B Konnerth A. (2013) Reactivation of the Same Synapses during Spontaneous Up States and Sensory Stimuli. Cell Rep 4: 31-39. doi: 10.1016/j.celrep.2013.05.042
|
| [72] | Shlosberg D, Buskila Y, Abu-Ghanem Y Amitai Y. (2012) Spatiotemporal alterations of cortical network activity by selective loss of NOS-expressing interneurons. Front Neural Circuits 6: 3. |
| [73] |
Peyrache A, Dehghani N, Eskandar EN, Madsen JR, Anderson WS, Donoghue JA, Hochberg LR, Halgren E, Cash SS Destexhe A. (2012) Spatiotemporal dynamics of neocortical excitation and inhibition during human sleep. Proc Natl Acad Sci 109: 1731-1736. doi: 10.1073/pnas.1109895109
|
| [74] |
Pi HJ, Hangya B, Kvitsiani D, Sanders, JI, Huang ZJ Kepecs A. (2013) Cortical interneurons that specialize in disinhibitory control. Nature 503: 521-524. doi: 10.1038/nature12676
|
| [75] |
Jiang X, Wang G, Lee AJ, Stornetta RL Zhu JJ. (2013) The organization of two new cortical interneuronal circuits. Nat Neurosci 16: 210-218. doi: 10.1038/nn.3305
|
| [76] |
Lee CK Huguenard JR. (2011) Martinotti Cells: Community Organizers. Neuron 69: 1042-1045. doi: 10.1016/j.neuron.2011.03.003
|
| [77] |
Buchanan KA, Blackman AV, Moreau AW, Elgar D, Costa RP, Lalanne T, Tudor JAA, Oyrer J and Sjöström PJ. (2012) Target-Specific Expression of Presynaptic NMDA Receptors in Neocortical Microcircuits. Neuron 75: 451-466. doi: 10.1016/j.neuron.2012.06.017
|
| [78] |
Moss, R A. (2013) A Clinical Biopsychological Theory of Loss-Related Depression. J Neuropsychother 1: 56-65. doi: 10.12744/ijnpt.2013.0056-0065
|
| [79] |
Huang, Y-J, Lin, C-H, Lane, H-Y, Tsai, G E. (2012) NMDA Neurotransmission Dysfunction in Behavioral and Psychological Symptoms of Alzheimer's Disease. Curr Neuropharmacol 10:272-285. doi: 10.2174/157015912803217288
|
| [80] |
Snyder EM, Nong Y, Almeida CG, Paul S, Moran T, Choi EY, Nairn AC, Salter MW, Lombroso,PJ, Gouras GK, et al. (2005) Regulation of NMDA receptor trafficking by amyloid-β. Nat Neurosci 8: 1051-1058. doi: 10.1038/nn1503
|
| [81] |
Stam CJ, van Walsum, A M van C, Pijnenburg YA, Berendse HW, de Munck JC, Scheltens P, van Dijk BW. (2002) Generalized synchronization of MEG recordings in Alzheimer's disease: evidence for involvement of the gamma band. J Clin Neurophysiol 19: 562-574. doi: 10.1097/00004691-200212000-00010
|
| [82] |
Gandal MJ, Edgar JC, Ehrlichman RS, Mehta M, Roberts TPL, Siegel SJ. (2010) Validating γ Oscillations and Delayed Auditory Responses as Translational Biomarkers of Autism. Biol Psychiatry 68: 1100-1106. doi: 10.1016/j.biopsych.2010.09.031
|
| [83] |
Tarabeux J, Kebir O, Gauthier J, Hamdan FF, Xiong L, Piton A, Spiegelman D, Henrion É Millet, B Fathalli, F et al. (2011) Rare mutations in N-methyl-D-aspartate glutamate receptors in autism spectrum disorders and schizophrenia. Transl Psychiatry 1: e55. doi: 10.1038/tp.2011.52
|
| [84] |
Chance SA, Casanova MF, Switala AE, Crow TJ. (2008) Auditory cortex asymmetry, altered minicolumn spacing and absence of ageing effects in schizophrenia. Brain 131: 3178-3192. doi: 10.1093/brain/awn211
|
| [85] |
Di Rosa E, Crow TJ, Walker MA, Black G, Chance SA. (2009) Reduced neuron density, enlarged minicolumn spacing and altered ageing effects in fusiform cortex in schizophrenia. Psychiatry Res 166: 102-115. doi: 10.1016/j.psychres.2008.04.007
|
| [86] |
Casanova MF, Kooten IAJ van, Switala AE, Engeland H van, Heinsen H, Steinbusch HWM, Hof PR, Trippe J, Stone J, Schmitz C. (2006) Minicolumnar abnormalities in autism. Acta Neuropathol (Berl) 112: 287-303. doi: 10.1007/s00401-006-0085-5
|
| [87] | Courchesne E, Mouton PR, Calhoun ME, Ahrens-Barbeau C, Hallet MJ, Barnes CC, Pierce K, Semendeferi K (2013). An Overabundance of Prefrontal Cortex Neurons Underlies Early Brain Overgrowth in Autism. Neurostereology Unbiased Stereol Neural Syst: 73-83. |
| [88] |
Chance SA, Casanova MF, Switala AE, Crow TJ Esiri MM. (2006) Minicolumn thinning in temporal lobe association cortex but not primary auditory cortex in normal human ageing. Acta Neuropathol (Berl) 111: 459-464. doi: 10.1007/s00401-005-0014-z
|
| [89] |
Chance SA, Clover L, Cousijn H, Currah L, Pettingill R Esiri MM. (2011) Microanatomical Correlates of Cognitive Ability and Decline: Normal Ageing, MCI, and Alzheimer's Disease. Cereb Cortex 21: 1870-1878. doi: 10.1093/cercor/bhq264
|
| [90] |
Courchesne E and Pierce K. (2005) Why the frontal cortex in autism might be talking only to itself: local over-connectivity but long-distance disconnection. Curr Opin Neurobiol 15:225-230. doi: 10.1016/j.conb.2005.03.001
|
| [91] |
Cho RY, Konecky RO, Carter CS. (2006) Impairments in frontal cortical γ synchrony and cognitive control in schizophrenia. Proc Natl Acad Sci 103: 19878-19883. doi: 10.1073/pnas.0609440103
|
Figures(1) / Tables(2)

Robert A. Moss, Jarrod Moss. The Role of Dynamic Columns in Explaining Gamma-band Synchronization and NMDA Receptors in Cognitive Functions[J]. AIMS Neuroscience, 2014, 1(1): 65-88. doi: 10.3934/Neuroscience.2014.1.65


 DownLoad: