Despite successive Basel reforms, capital adequacy ratios continue to receive disproportionate regulatory emphasis relative to the broader CAMELS supervisory framework—an emphasis repeatedly criticized as insufficient to capture the structural determinants of institutional efficiency. This study introduces and empirically validates the concept of an empirically benchmarked relative financial structure: a multidimensional framework comprised of the holistic configuration of financial ratios that collectively determine the U.S. depository institution performance. Using 7136 institution-year observations from the Federal Deposit Insurance Corporation (FDIC) database, representing 81.2% of the total U.S. depository institution assets over the period January 2000 to September 2020, a sequential two-stage methodology is employed. In the first stage, an Ordinary Least Squares (OLS) regression with backward elimination identifies 28 financial ratios significantly predicting Return on Equity (ROE), Return on Assets (ROA), and Net Interest Margin (NIM), with model fit ranging from 69.4% to 82.2% of the explained variance (28–39% after excluding mechanically related predictors; Section 4.1). In the second stage, an input-oriented Data Envelopment Analysis (DEA) under Variable Returns to Scale (VRS) generates efficiency scores for all institution-year observations. The study yields four principal findings: first, retained earnings, net loans and leases, and total liabilities are the dominant structural determinants of profitability, collectively accounting for 26.9% of the combined contribution share; second, efficient institutions systematically record higher non-interest expenses than inefficient—a descriptive pattern that diverges from, rather than directly tests, the cost-minimization efficiency paradigm, since a non-interest expense is not a DEA input in this profitability-oriented specification—while core capital ratios exhibit a non-monotonic relationship with efficiency; third, the efficiency ordering Large > Small > Medium > Giant is consistent with diseconomies of scale and suggests the primacy of structural composition over size, though a formal scale-efficiency decomposition was not conducted; and fourth, savings banks and savings associations record persistently lower efficiencies, associated with the mortgage concentration and structural rigidity. An empirically grounded monitoring model with calibrated empirical benchmark margins and limiting thresholds for 28 financial ratios—with benchmark patterns observed consistently across the institutional sizes and charter types examined—is proposed as a practical performance-monitoring tool, with early-warning applications identified as a direction for future validation.
Citation: Jalal Hafeth Ahmad Abu-alrop. Empirically benchmarked relative financial structure and bank efficiency: DEA evidence from U.S. depository institutions (2000–2020)[J]. Innovation Economics, 2026, 1(2): 164-185. doi: 10.3934/InnoEcon2026009
Despite successive Basel reforms, capital adequacy ratios continue to receive disproportionate regulatory emphasis relative to the broader CAMELS supervisory framework—an emphasis repeatedly criticized as insufficient to capture the structural determinants of institutional efficiency. This study introduces and empirically validates the concept of an empirically benchmarked relative financial structure: a multidimensional framework comprised of the holistic configuration of financial ratios that collectively determine the U.S. depository institution performance. Using 7136 institution-year observations from the Federal Deposit Insurance Corporation (FDIC) database, representing 81.2% of the total U.S. depository institution assets over the period January 2000 to September 2020, a sequential two-stage methodology is employed. In the first stage, an Ordinary Least Squares (OLS) regression with backward elimination identifies 28 financial ratios significantly predicting Return on Equity (ROE), Return on Assets (ROA), and Net Interest Margin (NIM), with model fit ranging from 69.4% to 82.2% of the explained variance (28–39% after excluding mechanically related predictors; Section 4.1). In the second stage, an input-oriented Data Envelopment Analysis (DEA) under Variable Returns to Scale (VRS) generates efficiency scores for all institution-year observations. The study yields four principal findings: first, retained earnings, net loans and leases, and total liabilities are the dominant structural determinants of profitability, collectively accounting for 26.9% of the combined contribution share; second, efficient institutions systematically record higher non-interest expenses than inefficient—a descriptive pattern that diverges from, rather than directly tests, the cost-minimization efficiency paradigm, since a non-interest expense is not a DEA input in this profitability-oriented specification—while core capital ratios exhibit a non-monotonic relationship with efficiency; third, the efficiency ordering Large > Small > Medium > Giant is consistent with diseconomies of scale and suggests the primacy of structural composition over size, though a formal scale-efficiency decomposition was not conducted; and fourth, savings banks and savings associations record persistently lower efficiencies, associated with the mortgage concentration and structural rigidity. An empirically grounded monitoring model with calibrated empirical benchmark margins and limiting thresholds for 28 financial ratios—with benchmark patterns observed consistently across the institutional sizes and charter types examined—is proposed as a practical performance-monitoring tool, with early-warning applications identified as a direction for future validation.

| [1] |
Abu−Alrop J (2025) Assessing and forecasting the efficiency of Russian banks (2000–2026): A DEA, panel data, and Monte Carlo simulation approach. Russ J Econ 11: 76–92. https://doi.org/10.32609/j.ruje.11.144303 doi: 10.32609/j.ruje.11.144303
|
| [2] |
Acharya V, Engle R, Pierret D (2014) Testing macroprudential stress tests: The risk of regulatory risk weights. J Monet Econ 65: 36–53. https://doi.org/10.1016/j.jmoneco.2014.04.014 doi: 10.1016/j.jmoneco.2014.04.014
|
| [3] |
Admati A, Hellwig M (2013) The bankers' new clothes: What's wrong with banking and what to do about it. Princeton University Press, Princeton. https://doi.org/10.1515/9780691251714 |
| [4] |
Aggarwal R, Jacques KT (2001) The impact of FDICIA and prompt corrective action on bank capital and risk. J Bank Financ 25: 1139–1160. https://doi.org/10.1016/S0378−4266(00)00125−4 doi: 10.1016/S0378−4266(00)00125−4
|
| [5] |
Allen F, Santomero AM (2001) What do financial intermediaries do? J Bank Financ 25: 271–294. https://doi.org/10.1016/S0378−4266(99)00129−6 doi: 10.1016/S0378−4266(99)00129−6
|
| [6] |
Banker RD, Charnes A, Cooper WW (1984) Some models for estimating technical and scale inefficiencies in data envelopment analysis. Manage Sci 30: 1078–1092. https://doi.org/10.1287/mnsc.30.9.1078 doi: 10.1287/mnsc.30.9.1078
|
| [7] |
(BCBS) Basel Committee on Banking Supervision (2010) Basel III: A global regulatory framework for more resilient banks and banking systems. Bank for International Settlements, Basel. |
| [8] |
Beatty A, Liao S (2011) Do delays in expected loss recognition affect banks' willingness to lend? J Account Econ 52: 1–20. https://doi.org/10.1016/j.jacceco.2011.02.002 doi: 10.1016/j.jacceco.2011.02.002
|
| [9] |
Behn M, Haselmann R, Vig V (2025) Model−based capital regulation: Where do we stand and where should we go from here? Annu Rev Financ Econ 17: 93–111. https://doi.org/10.1146/annurev−financial−082123−110117 doi: 10.1146/annurev−financial−082123−110117
|
| [10] |
Berger AN, DeYoung R (1997) Problem loans and cost efficiency in commercial banks. J Bank Financ 21: 849–870. https://doi.org/10.1016/S0378−4266(97)00003−4 doi: 10.1016/S0378−4266(97)00003−4
|
| [11] |
Berger AN, Hancock D, Humphrey DB (1993) Bank efficiency derived from the profit function. J Bank Financ 17: 317–347. https://doi.org/10.1016/0378−4266(93)90035−C doi: 10.1016/0378−4266(93)90035−C
|
| [12] |
Berger AN, Humphrey DB (1997) Efficiency of financial institutions: International survey and directions for future research. Eur J Oper Res 98: 175–212. https://doi.org/10.1016/S0377−2217(96)00342−6 doi: 10.1016/S0377−2217(96)00342−6
|
| [13] |
Berger AN, Mester LJ (1997) Inside the black box: What explains differences in the efficiencies of financial institutions? J Bank Financ 21: 895–947. https://doi.org/10.1016/S0378−4266(97)00010−1 doi: 10.1016/S0378−4266(97)00010−1
|
| [14] |
Berger AN, Udell GF (2002) Small business credit availability and relationship lending. Econ J 112: F32–F53. https://doi.org/10.1111/1468−0297.00682 doi: 10.1111/1468−0297.00682
|
| [15] |
Borio C, Drehmann M (2009) Assessing the risk of banking crises–revisited. BIS Q Rev, 29–46. |
| [16] |
Bushman RM, Williams CD (2012) Accounting discretion, loan loss provisioning, and discipline of banks' risk−taking. J Account Econ 54: 1–18. https://doi.org/10.1016/j.jacceco.2012.04.002 doi: 10.1016/j.jacceco.2012.04.002
|
| [17] |
Charnes A, Cooper WW, Rhodes E (1978) Measuring the efficiency of decision making units. Eur J Oper Res 2: 429–444. https://doi.org/10.1016/0377−2217(78)90138−8 doi: 10.1016/0377−2217(78)90138−8
|
| [18] |
Coelli TJ, Prasado Rao DS, O'Donnell CJ, et al. (2005) An introduction to efficiency and productivity analysis, 2nd Eds., Springer, New York. https://doi.org/10.1007/b136381 |
| [19] |
Cook WD, Zhu J (2008) Data envelopment analysis: Modeling operational processes and measuring productivity. CreateSpace, Seattle. |
| [20] |
Cooper WW, Seiford LM, Tone K (2007) Data envelopment analysis: A comprehensive text with models, applications, references and DEA−solver software, 2nd Eds., Springer, New York. https://doi.org/10.1007/978-0-387-45283-8 |
| [21] |
Demirguc−Kunt A, Huizinga H (1999) Determinants of commercial bank interest margins and profitability: Some international evidence. World Bank Econ Rev 13: 379–408. https://doi.org/10.1093/wber/13.2.379 doi: 10.1093/wber/13.2.379
|
| [22] |
DeYoung R, Roland KP (2001) Product mix and earnings volatility at commercial banks: Evidence from a degree of total leverage model. J Financ Intermed 10: 54–84. https://doi.org/10.1006/jfin.2000.0305 doi: 10.1006/jfin.2000.0305
|
| [23] |
Diamond DW, Rajan RG (2000) A theory of bank capital. J Financ 55: 2431–2465. https://doi.org/10.1111/0022−1082.00296 doi: 10.1111/0022−1082.00296
|
| [24] |
Diego ART, Kumbhakar S (2014) Profit efficiency of U. S. commercial banks: A decomposition (Working Paper No. 13−18). Documentos de trabajo Economía y Finanzas. Available from: https://ssrn.com/abstract = 2393182 |
| [25] |
Ding D, Sickles RC (2018) Frontier efficiency, capital structure, and portfolio risk: An empirical analysis of U. S. banks. BRQ Bus Res Q 21: 262–277. https://doi.org/10.1016/j.brq.2018.09.002 |
| [26] |
Dyson RG, Allen R, Camanho AS, et al. (2001) Pitfalls and protocols in DEA. Eur J Oper Res 132: 245–259. https://doi.org/10.1016/S0377−2217(00)00149−1 doi: 10.1016/S0377−2217(00)00149−1
|
| [27] |
Eisenbeis RA, Kwan HSH (1996) An analysis of inefficiencies in banking: A stochastic cost frontier approach. FRBSF Econ Rev 2: 16–26. |
| [28] |
Farrell MJ (1957) The measurement of productive efficiency. J R Stat Soc Ser A 120: 253–281. https://doi.org/10.2307/2343100 |
| [29] |
Fiordelisi F, Marques−Ibanez D, Molyneux P (2011) Efficiency and risk in European banking. J Bank Financ 35: 1315–1326. https://doi.org/10.1016/j.jbankfin.2010.10.005 doi: 10.1016/j.jbankfin.2010.10.005
|
| [30] |
Golany B, Roll Y (1989) An application procedure for DEA. Omega 17: 237–250. https://doi.org/10.1016/0305−0483(89)90029−7 doi: 10.1016/0305−0483(89)90029−7
|
| [31] |
Haldane AG (2012) The dog and the frisbee. Paper presented at the Federal Reserve Bank of Kansas City's 366th Economic Policy Symposium. Bank of England. |
| [32] |
Hoffman PS (2010) Capital structure and performance in the US banking industry. SSRN. Available from: https://ssrn.com/abstract = 1617830 |
| [33] |
Hollingsworth B, Smith P (2003) Use of ratios in data envelopment analysis. Appl Econ Lett 10: 733–735. https://doi.org/10.1080/1350485032000133381 doi: 10.1080/1350485032000133381
|
| [34] |
Hughes JP, Mester LJ (2013) Who said large banks don't experience scale economies? Evidence from a risk−return−driven cost function. J Financ Intermed 22: 559–585. https://doi.org/10.1016/j.jfi.2013.06.004 doi: 10.1016/j.jfi.2013.06.004
|
| [35] |
Huguenin JM (2012) Data envelopment analysis (DEA): A pedagogical guide for decision makers in the public sector. Swiss Graduate School of Public Administration (IDHEAP), Lausanne. |
| [36] |
Hussain ME, Hassan KM (2012) Competition, risk taking and efficiency in the US commercial banks prior to 2008 financial crisis. SSRN. Available from: https://doi.org/10.2139/ssrn.2003066 |
| [37] |
Joaquim F, Carlos Miguel O, José Silva N (2024) Portuguese banks efficiency: A data envelopment analysis. Procedia Comput Sci 237: 277–288. https://doi.org/10.1016/j.procs.2024.05.106 doi: 10.1016/j.procs.2024.05.106
|
| [38] |
Josef S, Jiri P, Vojtech S (2025) Modelling IRB risk−weighted assets: Looking beyond stress tests. Econ Notes 54: 1–29. https://doi.org/10.1111/ecno.70010 doi: 10.1111/ecno.70010
|
| [39] |
Koetter M, Kolari JW, Spierdijk L (2012) Enjoying the quiet life under deregulation? Evidence from adjusted Lerner indices for U. S. banks. Rev Econ Stat 94: 462–480. https://doi.org/10.1162/REST_a_00155 doi: 10.1162/REST_a_00155
|
| [40] |
Kweh QL, Lu WM, Tone K, et al. (2024) Evaluating the resource management and profitability efficiencies of US commercial banks from a dynamic network perspective. Financ Innov 10: 19. https://doi.org/10.1186/s40854−023−00531−0 doi: 10.1186/s40854−023−00531−0
|
| [41] |
Landis JR, Koch GG (1977) The measurement of observer agreement for categorical data. Biometrics 33: 159–174. https://doi.org/10.2307/2529310 doi: 10.2307/2529310
|
| [42] |
Myers SC, Majluf NS (1984) Corporate financing and investment decisions when firms have information that investors do not have. J Financ Econ 13: 187–221. https://doi.org/10.1016/0304−405X(84)90023−0 doi: 10.1016/0304−405X(84)90023−0
|
| [43] |
Olesen OB, Petersen NC, Podinovski VV (2015) Efficiency analysis with ratio measures. Eur J Oper Res 245: 446–462. https://doi.org/10.1016/j.ejor.2015.03.013 doi: 10.1016/j.ejor.2015.03.013
|
| [44] |
Rogers KE (1998) Nontraditional activities and the efficiency of US commercial banks. J Bank Financ 22: 467–482. https://doi.org/10.1016/S0378−4266(98)00020−X doi: 10.1016/S0378−4266(98)00020−X
|
| [45] |
Roshanthi D (2021) Capital regulation and bank risk−taking: New global evidence. Account Financ 61: 847–884. https://doi.org/10.1111/acfi.12595 doi: 10.1111/acfi.12595
|
| [46] |
Roy S (2024) The recent lawsuit by U. S. banks against supervisory stress testing: A model risk perspective. SSRN. https://doi.org/10.2139/ssrn.5071502 |
| [47] |
Saif Ullah, Majeed A, Popp J (2023) Determinants of bank's efficiency in an emerging economy: A data envelopment analysis approach. PLOS ONE 18: e0281663. https://doi.org/10.1371/journal.pone.0281663 doi: 10.1371/journal.pone.0281663
|
| [48] |
Sealey CW, Lindley JT (1977) Inputs, outputs, and a theory of production and cost at depository financial institutions. J Financ 32: 1251–1266. https://doi.org/10.1111/j.1540−6261.1977.tb03324.x doi: 10.1111/j.1540−6261.1977.tb03324.x
|
| [49] |
Seiford L, Zhu J (1999) Profitability and marketability of the top 55 U. S. commercial banks. Manage Sci 45: 1270–1288. https://doi.org/10.1287/mnsc.45.9.1270 doi: 10.1287/mnsc.45.9.1270
|
| [50] |
Simoens M, Vander Vennet R (2021) Bank performance in Europe and the US: A divergence in market−to−book ratios. Financ Res Lett 40: 101672. https://doi.org/10.1016/j.frl.2020.101672 doi: 10.1016/j.frl.2020.101672
|
| [51] |
Worthington AC (2000) Technical efficiency and technological change in Australian building societies. Abacus 36: 180–197. https://doi.org/10.1111/1467−6281.00059 doi: 10.1111/1467−6281.00059
|
| [52] |
Yeh LT (2025) Constructing a robust data envelopment analysis model to evaluate the profitability efficiency of banks with financial loss. Appl Econ 57: 917–933. https://doi.org/10.1080/00036846.2024.2309469 doi: 10.1080/00036846.2024.2309469
|
Figures(6) / Tables(4)
Jalal Hafeth Ahmad Abu-alrop. Empirically benchmarked relative financial structure and bank efficiency: DEA evidence from U.S. depository institutions (2000–2020)[J]. Innovation Economics, 2026, 1(2): 164-185. doi: 10.3934/InnoEcon2026009

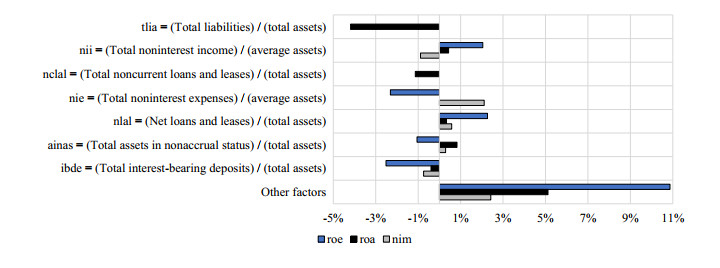
Directional impact of key financial ratios on profitability indicators (ROE, ROA, NIM), 2000 to September 2020. Source: Compiled by the author
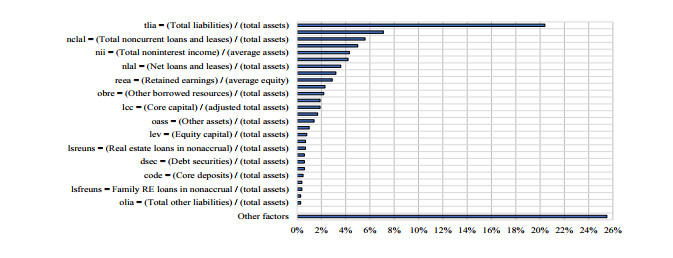
Absolute percentage impact of each financial ratio on combined profitability indicators. Source: Compiled by the author. Note: Bars show each ratio's combined contribution share, calculated as the sum of its absolute contribution to the sample−mean value of ROE, ROA, and NIM (see Section 4.1), expressed as a percentage of the total across all 28 ratios
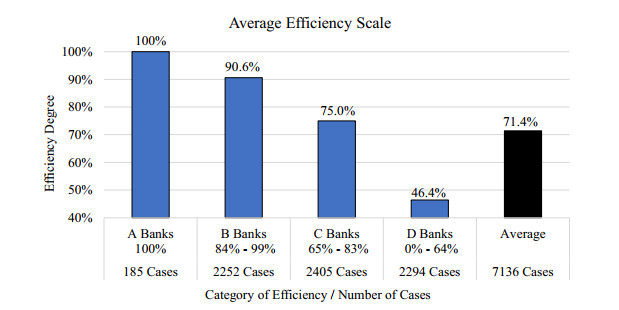
Classification of U.S. depository institutions by efficiency group. Source: Compiled by the author.
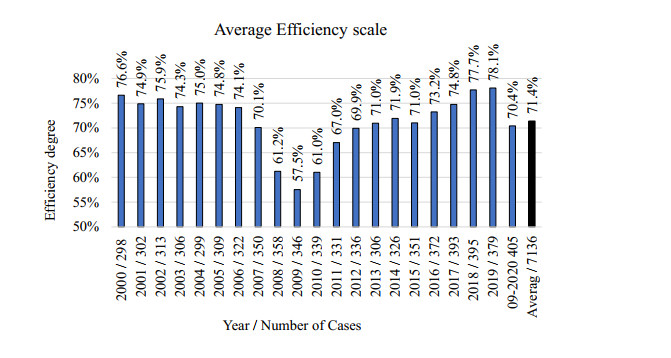
Average efficiency of U.S. depository institutions by year, DEA results (2000–September 2020). Source: Compiled by the author
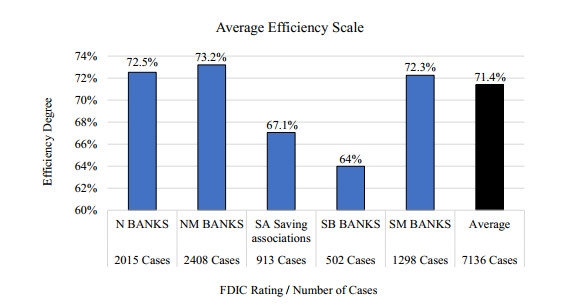
Average efficiency of U.S. depository institutions by FDIC charter classification. Source: Compiled by the author
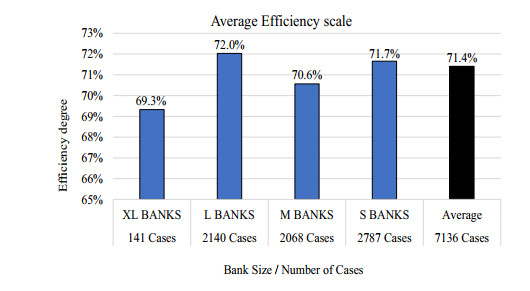
Average efficiency of U.S. depository institutions by asset size. Source: Compiled by the author



 DownLoad: