Upon activation, helper T (Th) cells produce cytokines such as IL-17A and IFNγ, which may exacerbate inflammatory disease and disorders. Adrenergic drugs are emerging as immunomodulatory agents to treat pro-inflammatory diseases, but their function is not completely understood. Th Cells express the β2-adrenergic receptor (β2AR) that is encoded by ADRB2. Agonists of the β2AR decrease IFNγ but can increase IL-17A from Th cells. We compared a β2AR agonist to an inverse-agonist, and assessed the influence of ADRB2 polymorphisms on IL-17A and IFNγ responses.
Peripheral blood mononuclear cells (PBMCs) from venous blood of healthy human participants were cultured with T cell activators anti-CD3 and anti-CD28 antibodies. Terbutaline, a β2AR agonist or nebivolol, a β1AR antagonist and β2AR inverse-agonist, were added in vitro. Cytokines IL-17A and IFNγ were measured using enzyme-linked immunosorbent assay. Genomic ADRB2 and its immediate upstream region were sequenced using Sanger's method. Cytokine response to drug was analyzed based on ADRB2 polymorphisms.
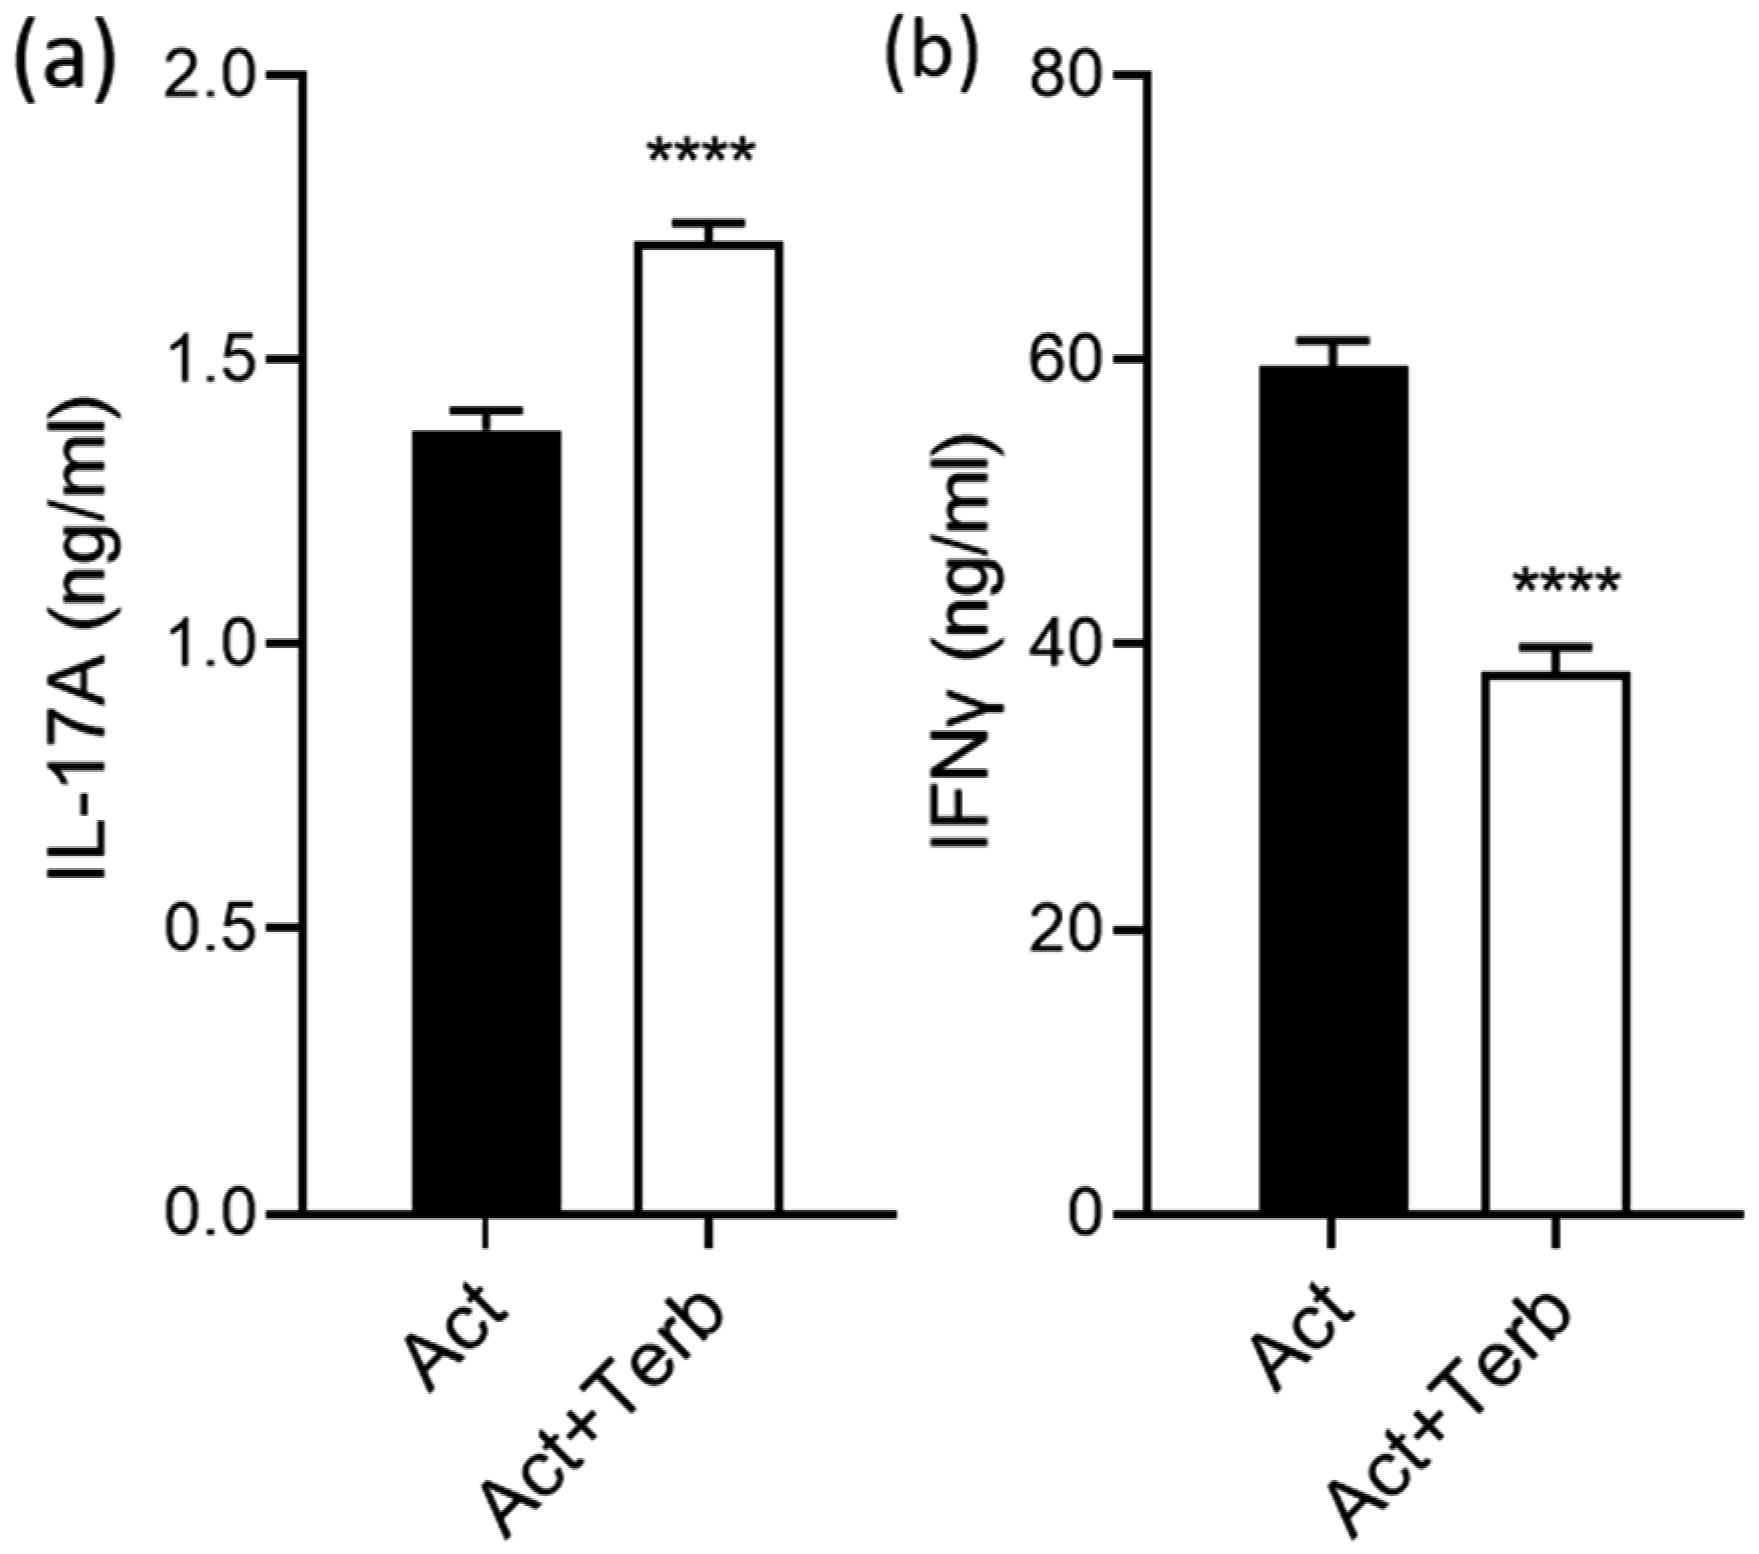
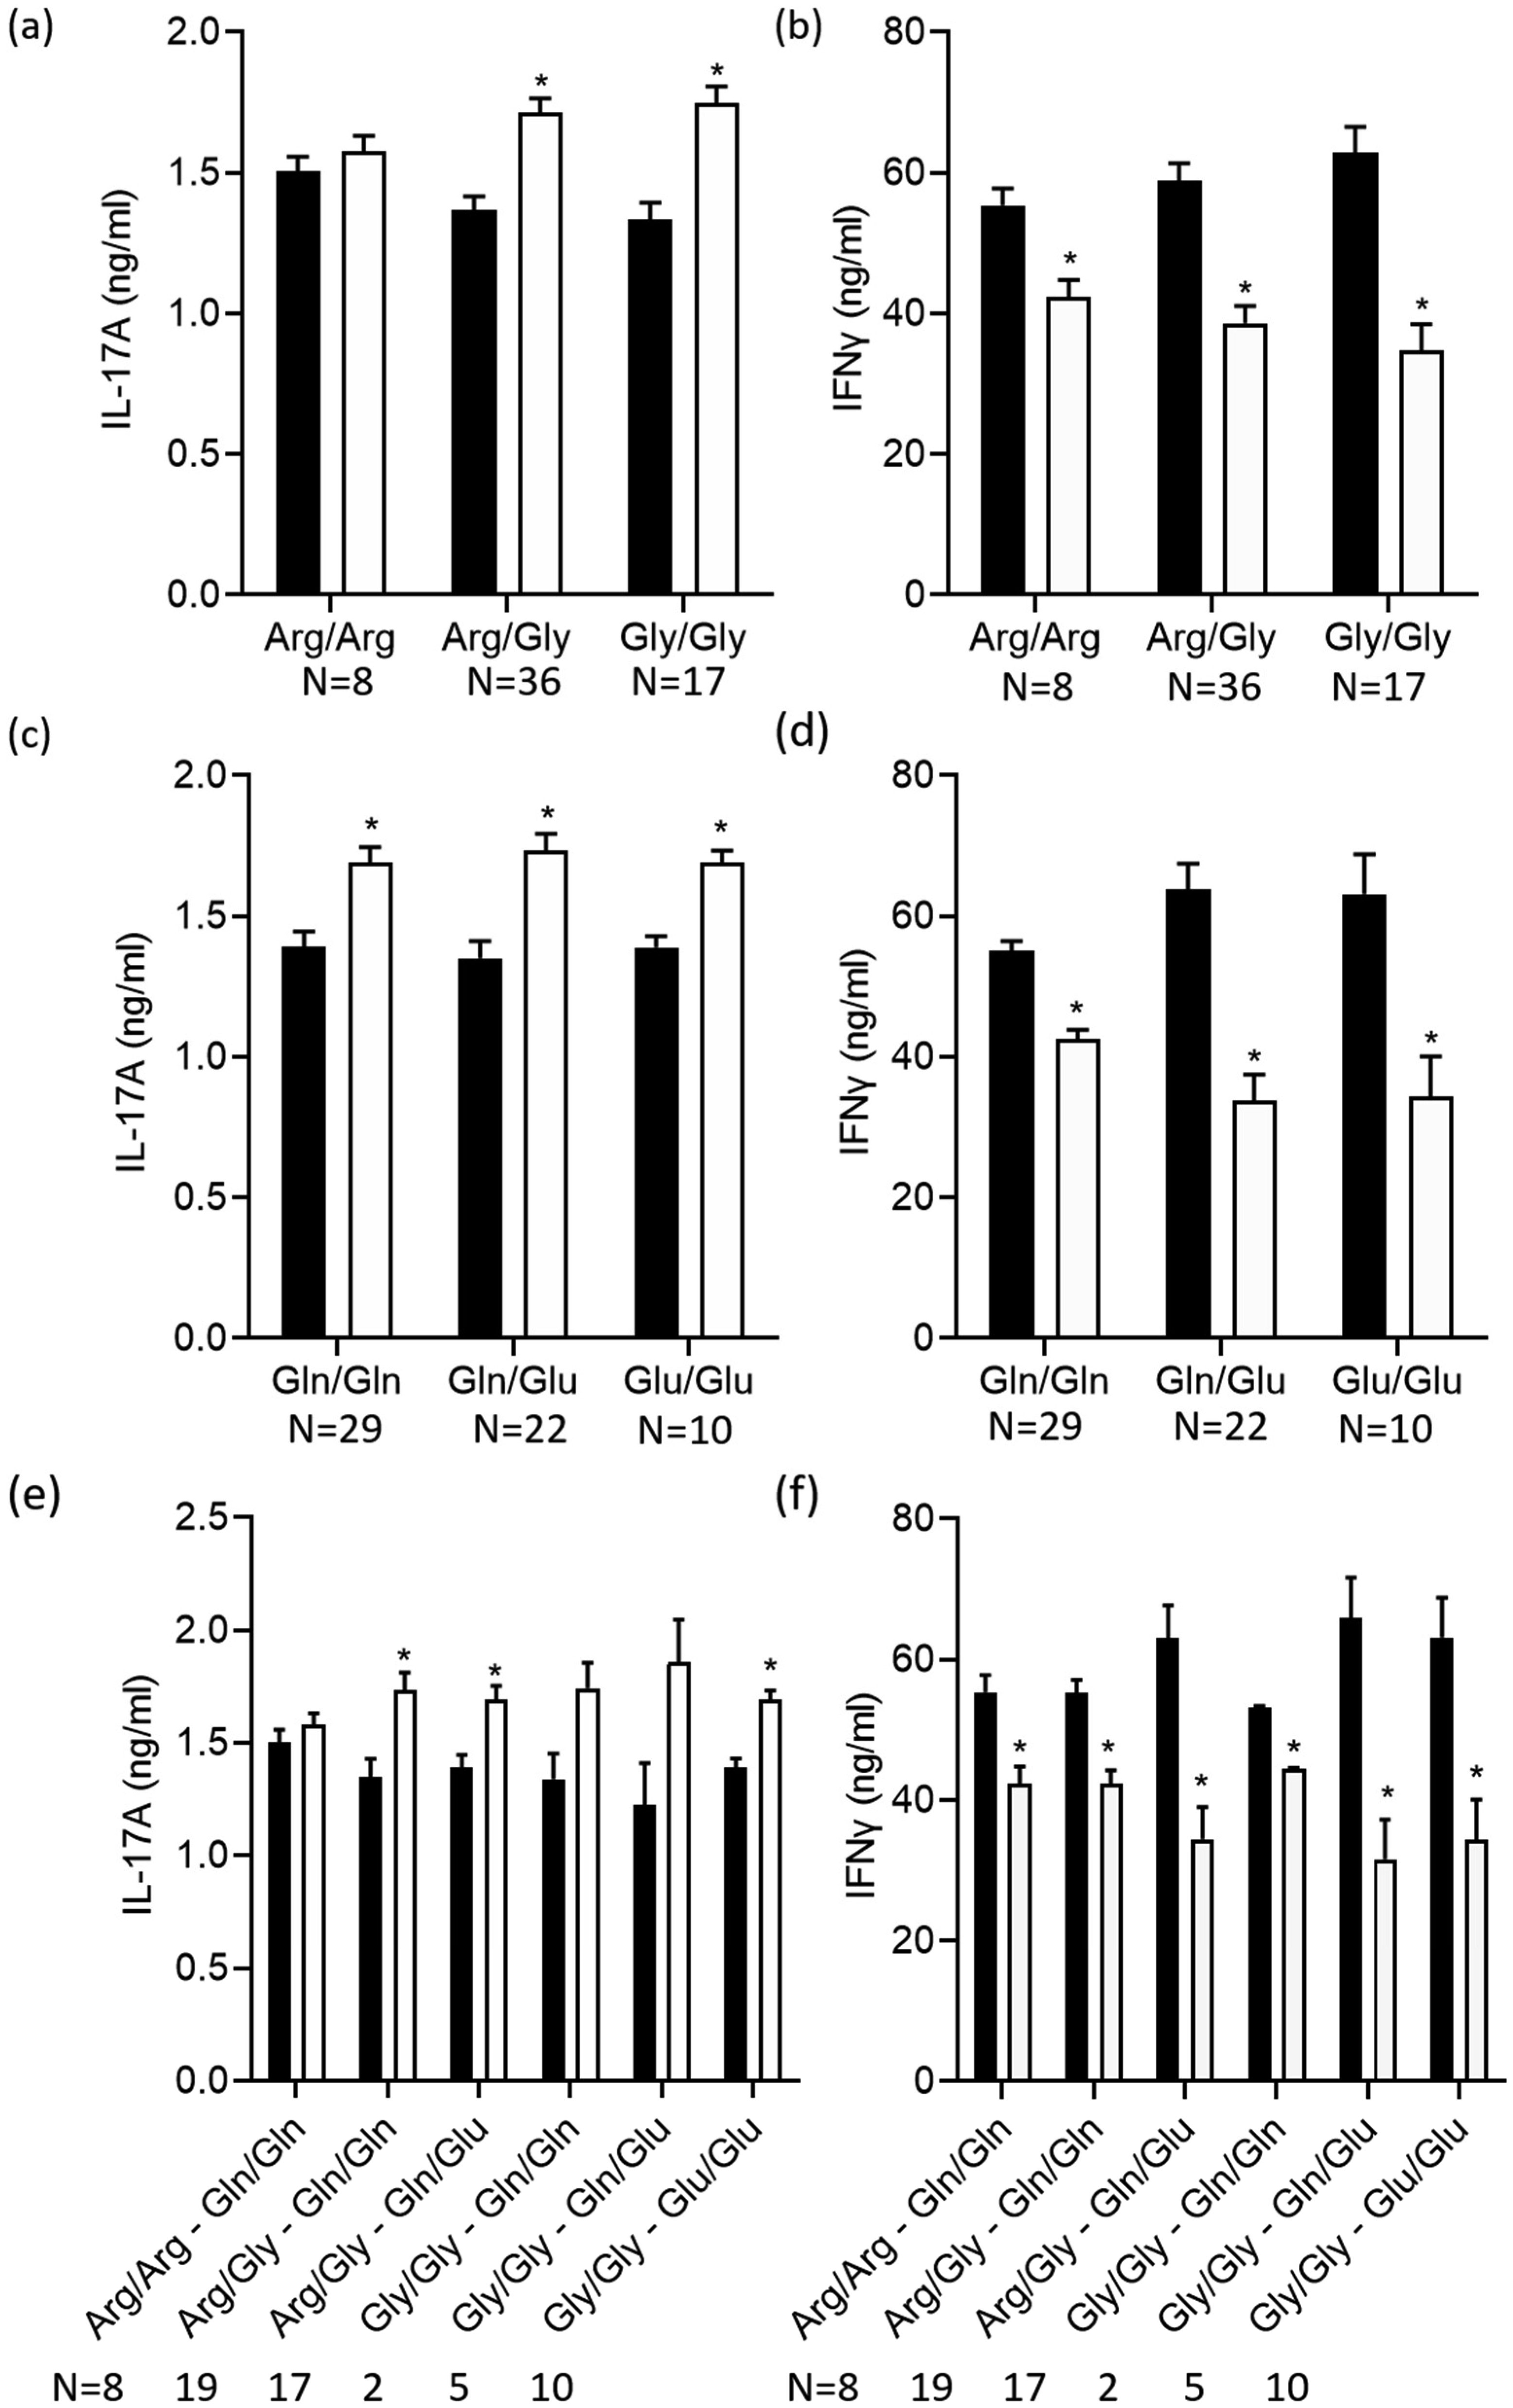
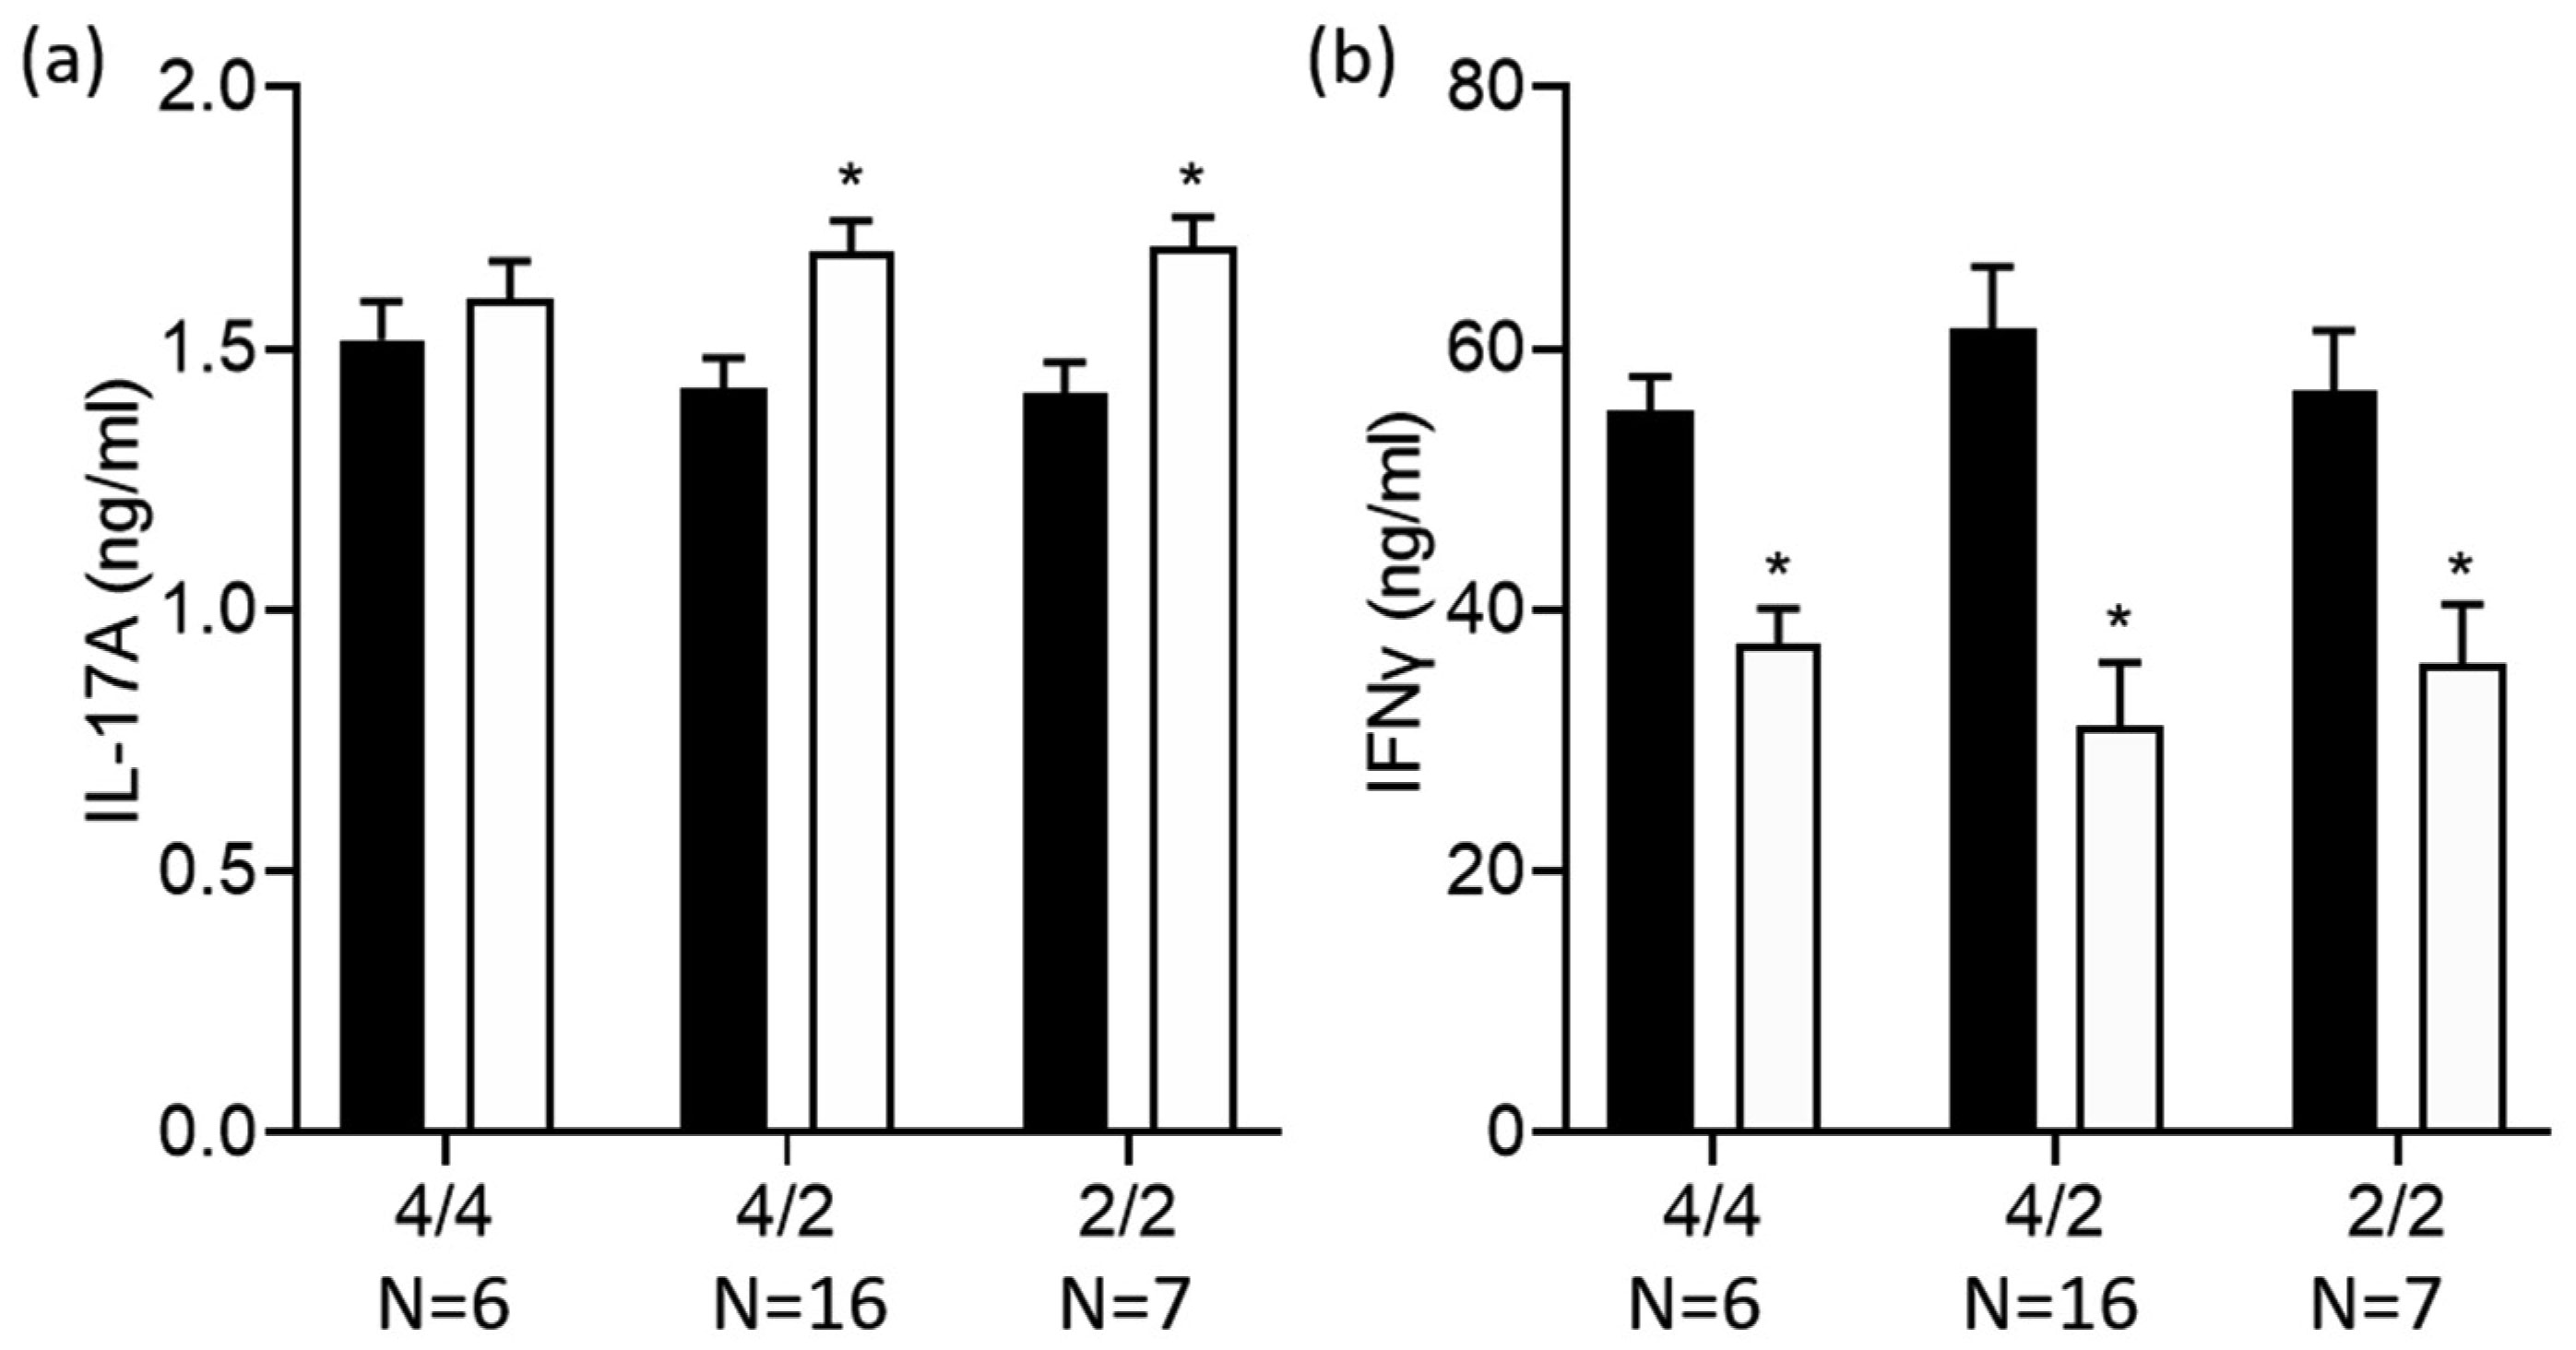
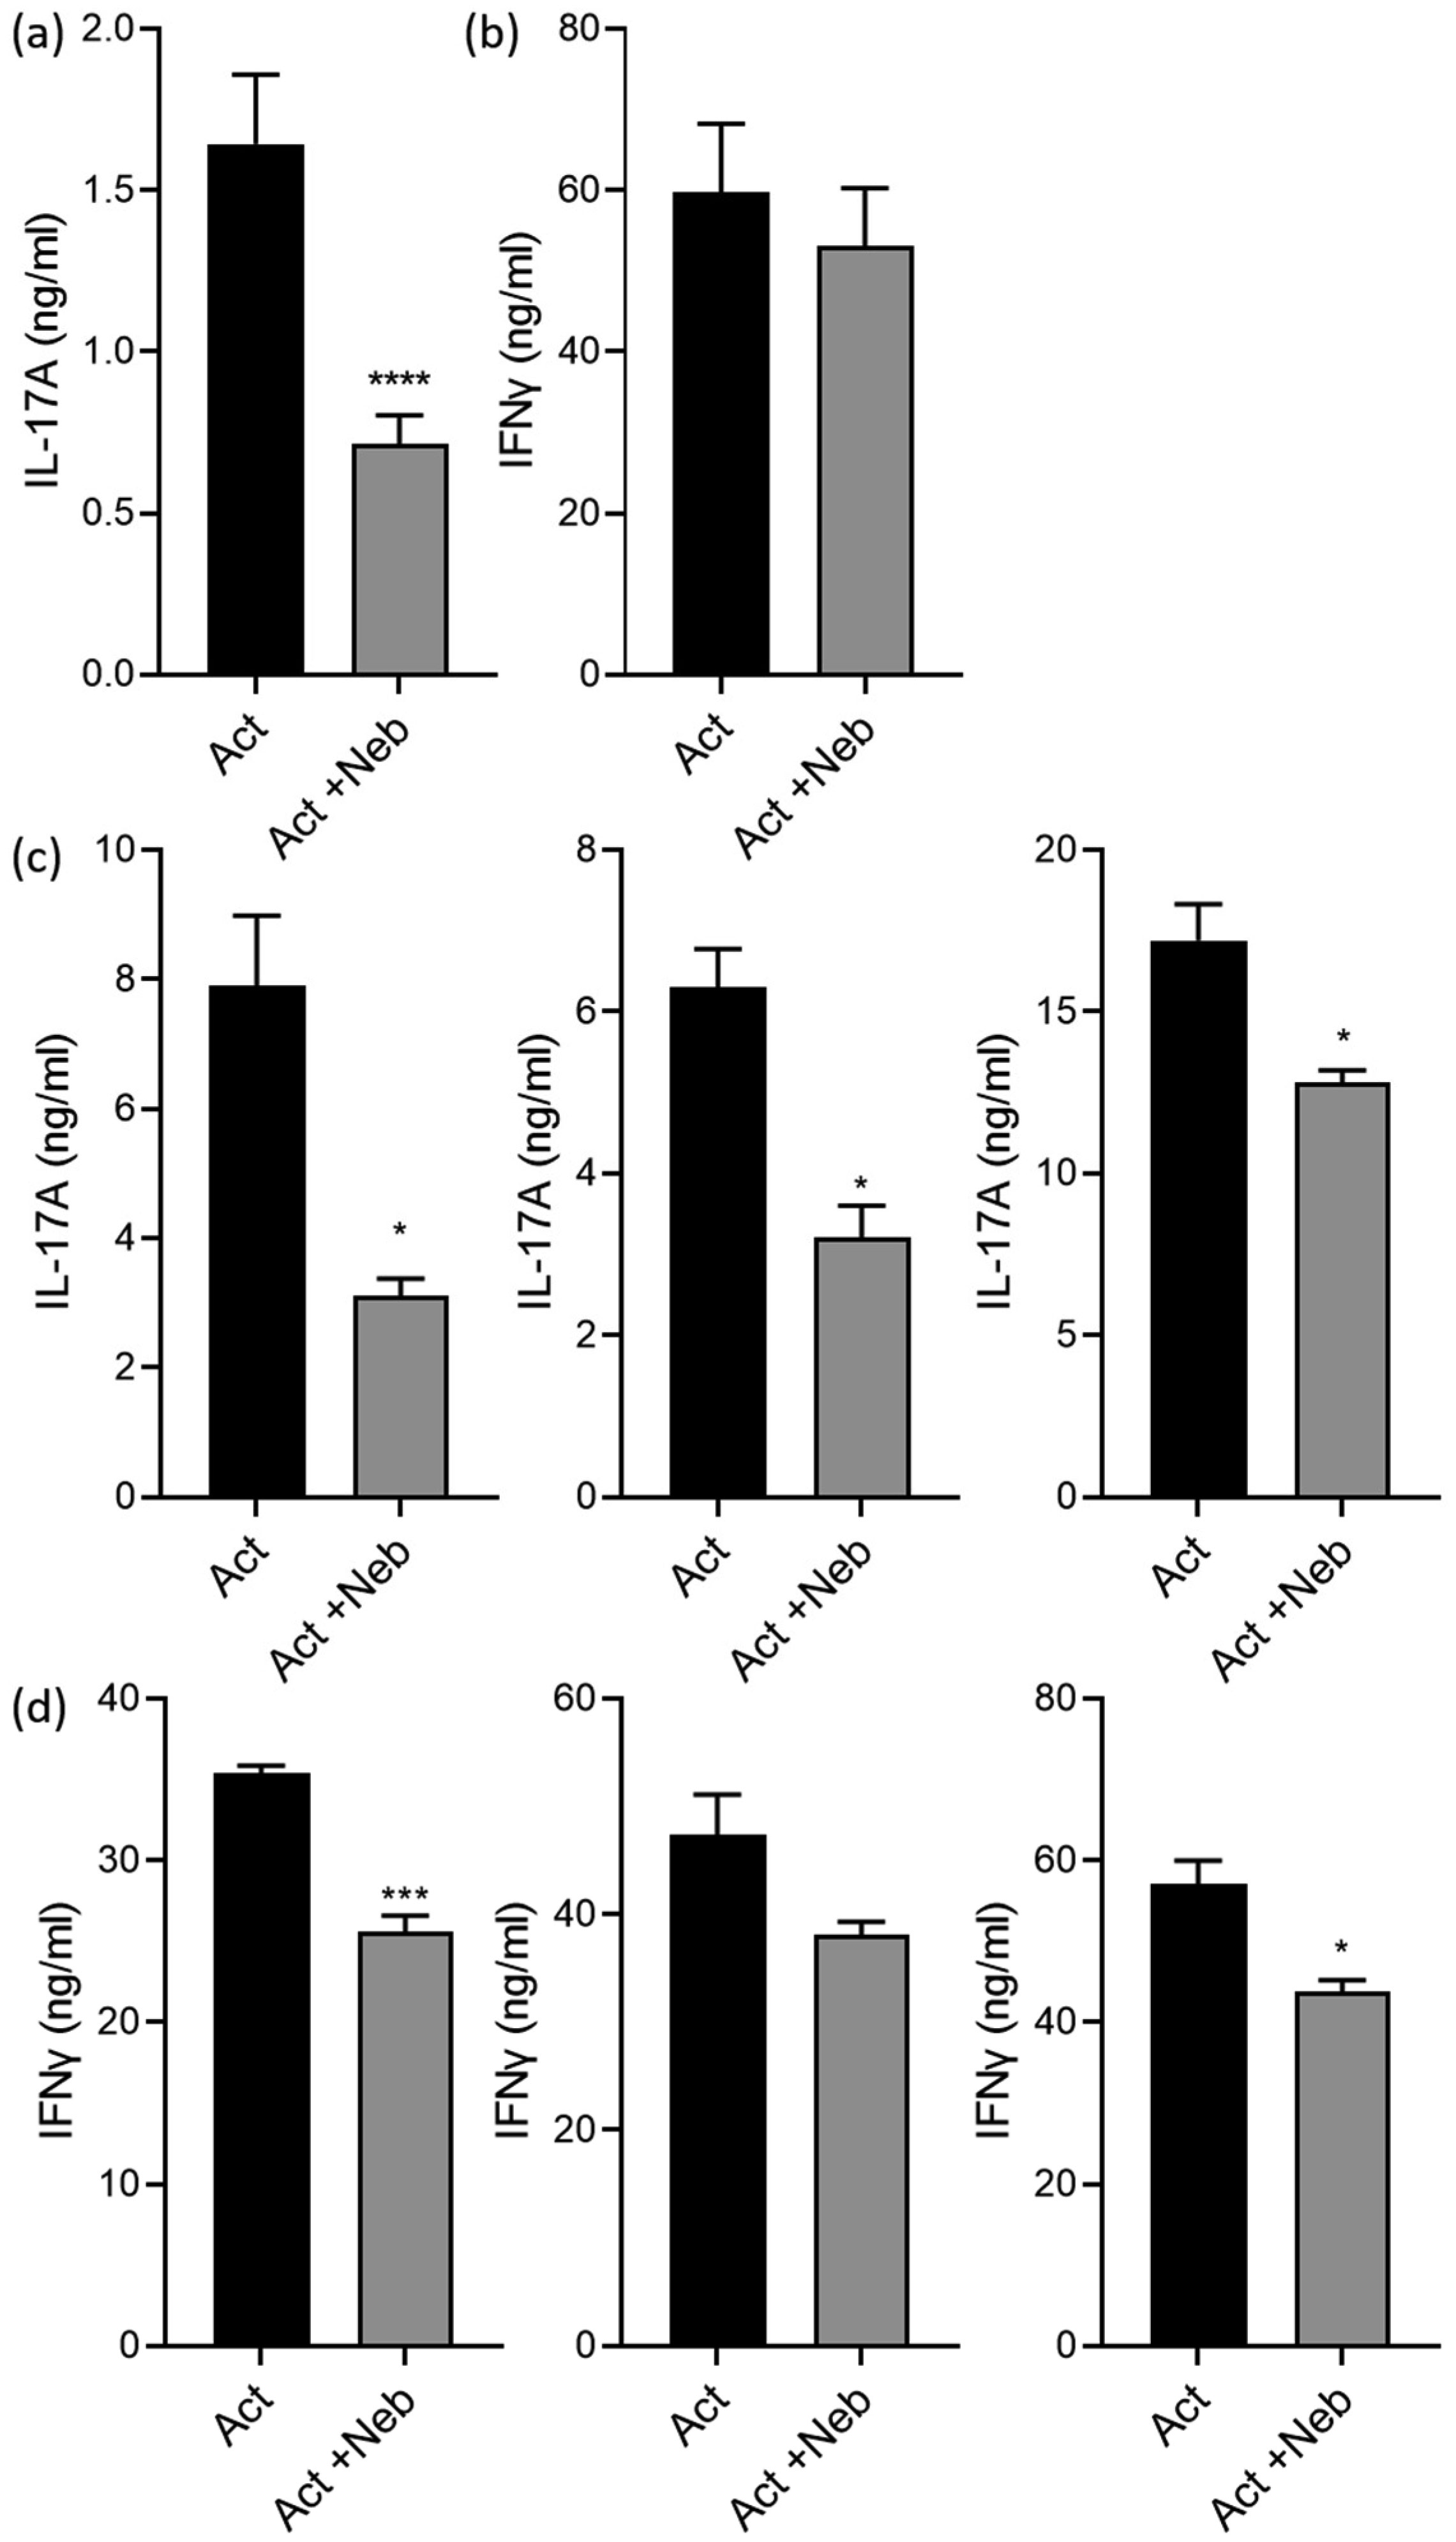
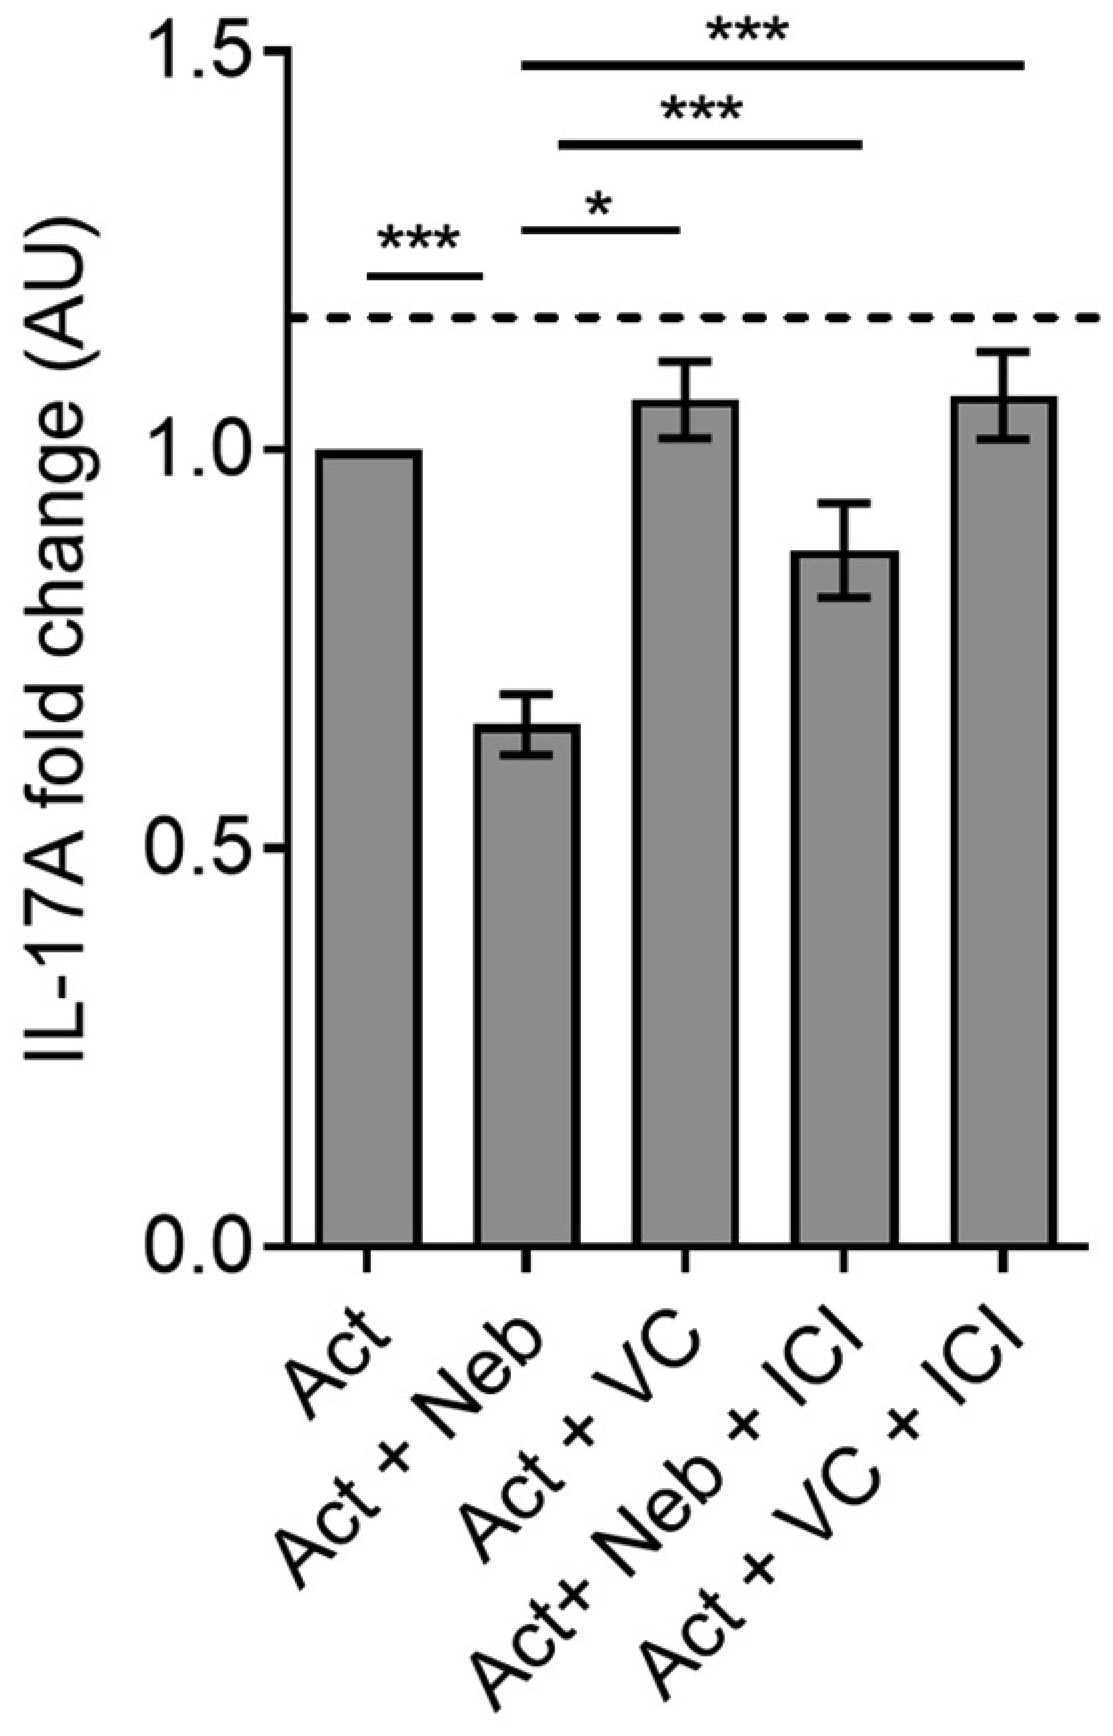
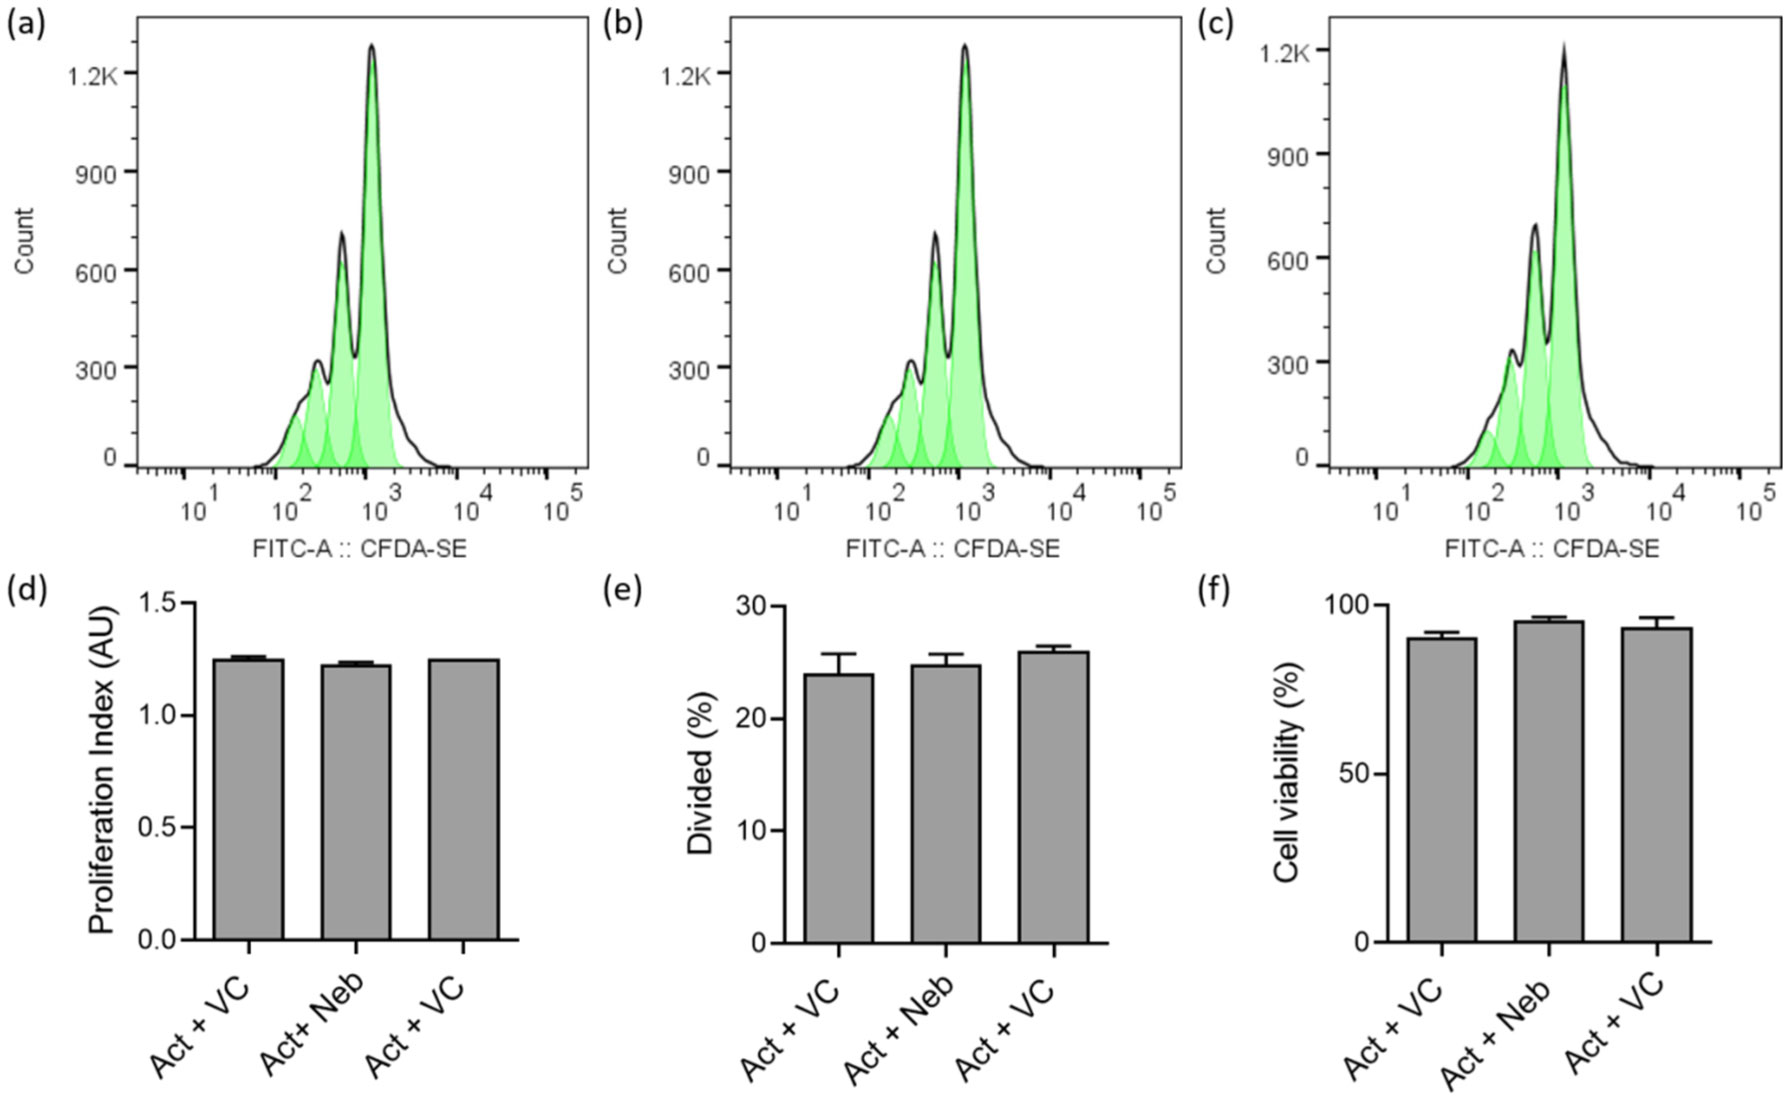
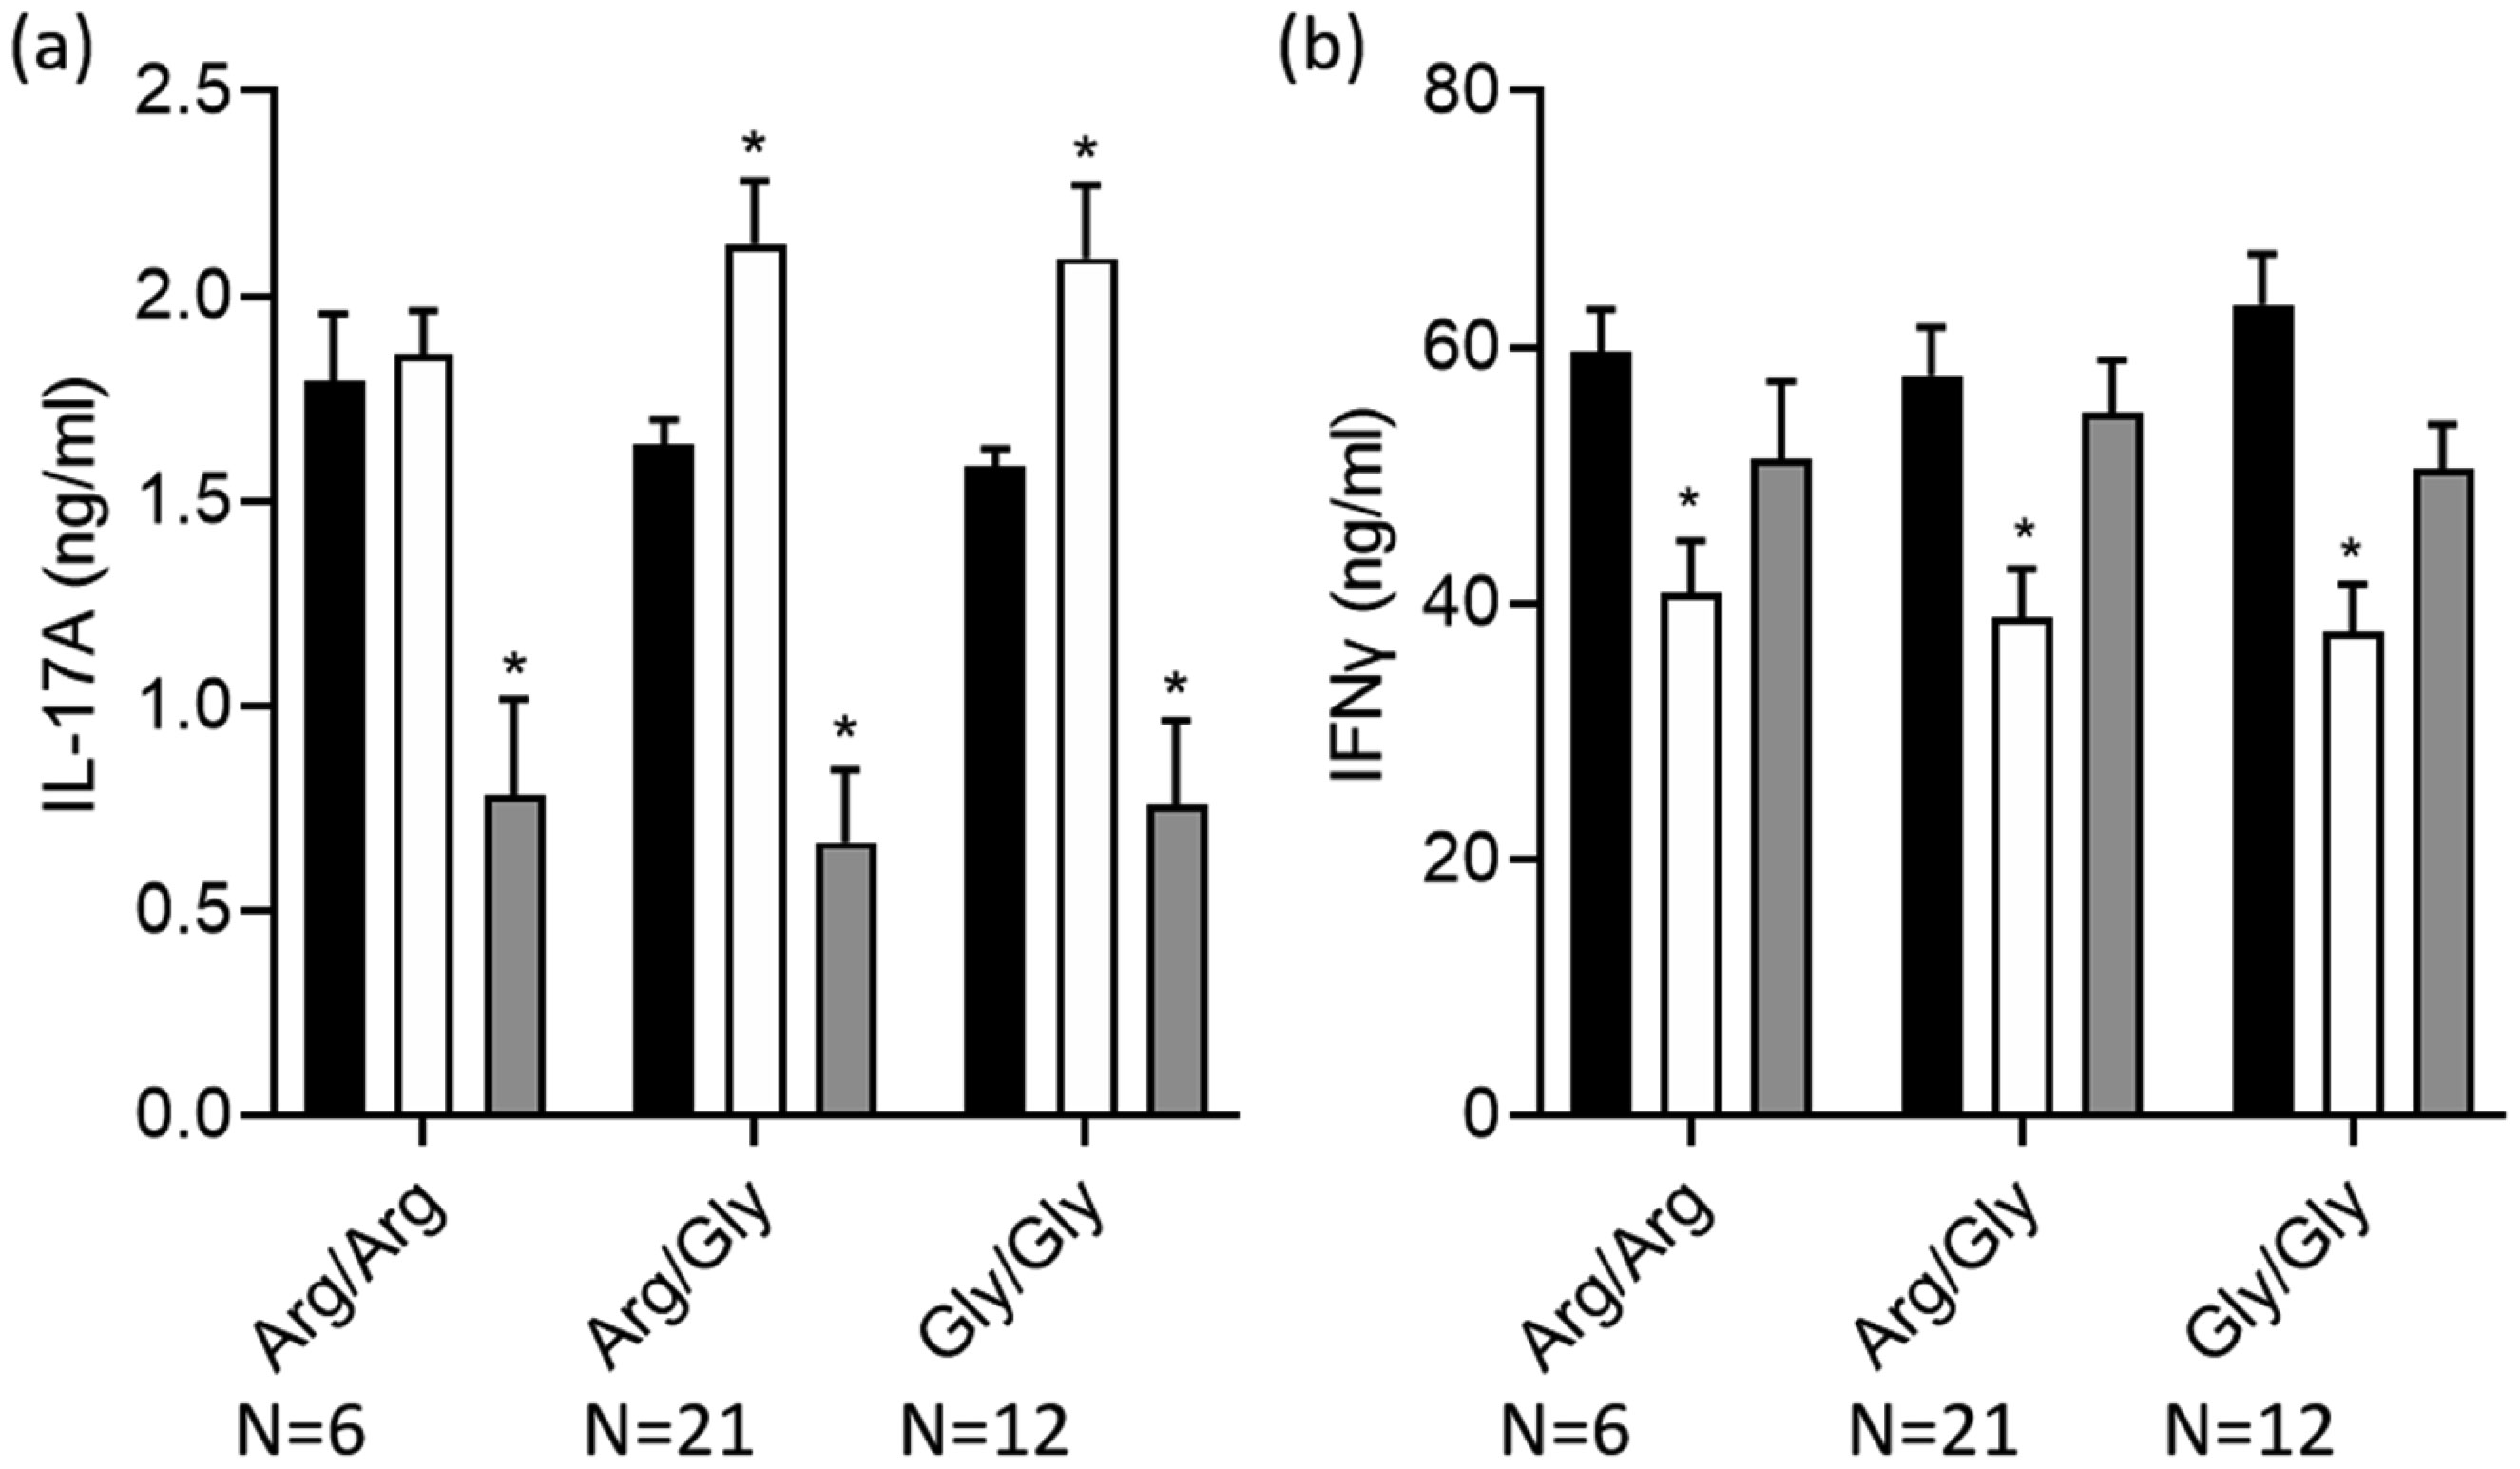
Terbutaline consistently inhibited IFNγ from activated PBMC samples. In contrast, it increased IL-17A in PBMC homozygous for Gly16 codon of ADRB2. Nebivolol inhibited IL-17A and IFNγ from activated Th cells. When applied to activated-PBMCs, nebivolol inhibited IL-17A but did not significantly inhibit IFNγ although a trend was observed. The ability of nebivolol to inhibit IL-17A was attenuated by a β2AR-specific antagonist. Cellular proliferation and viability was not significantly changed by nebivolol. Nebivolol suppressed IL-17A in all of the samples regardless of ADRB2 polymorphisms.
This data demonstrates that terbutaline inhibited IFNγ, however, it increased IL-17A in samples with the common Gly16 polymorphism of ADRB2. Nebivolol inhibited IL-17A regardless of ADRB2 polymorphisms. Thus, nebivolol is a strong candidate for treating inflammatory diseases or disorders where IL-17A exacerbates symptoms.
Citation: Catalina Marysol Carvajal Gonczi, Fadi Touma, Tina Daigneault, Chelsea Pozzebon, Kelly Burchell-Reyes, Peter J. Darlington. Modulation of IL-17A and IFNγ by β2-adrenergic agonist terbutaline and inverse-agonist nebivolol, influence of ADRB2 polymorphisms[J]. AIMS Allergy and Immunology, 2021, 5(4): 222-239. doi: 10.3934/Allergy.2021017
Upon activation, helper T (Th) cells produce cytokines such as IL-17A and IFNγ, which may exacerbate inflammatory disease and disorders. Adrenergic drugs are emerging as immunomodulatory agents to treat pro-inflammatory diseases, but their function is not completely understood. Th Cells express the β2-adrenergic receptor (β2AR) that is encoded by ADRB2. Agonists of the β2AR decrease IFNγ but can increase IL-17A from Th cells. We compared a β2AR agonist to an inverse-agonist, and assessed the influence of ADRB2 polymorphisms on IL-17A and IFNγ responses.
Peripheral blood mononuclear cells (PBMCs) from venous blood of healthy human participants were cultured with T cell activators anti-CD3 and anti-CD28 antibodies. Terbutaline, a β2AR agonist or nebivolol, a β1AR antagonist and β2AR inverse-agonist, were added in vitro. Cytokines IL-17A and IFNγ were measured using enzyme-linked immunosorbent assay. Genomic ADRB2 and its immediate upstream region were sequenced using Sanger's method. Cytokine response to drug was analyzed based on ADRB2 polymorphisms.
Terbutaline consistently inhibited IFNγ from activated PBMC samples. In contrast, it increased IL-17A in PBMC homozygous for Gly16 codon of ADRB2. Nebivolol inhibited IL-17A and IFNγ from activated Th cells. When applied to activated-PBMCs, nebivolol inhibited IL-17A but did not significantly inhibit IFNγ although a trend was observed. The ability of nebivolol to inhibit IL-17A was attenuated by a β2AR-specific antagonist. Cellular proliferation and viability was not significantly changed by nebivolol. Nebivolol suppressed IL-17A in all of the samples regardless of ADRB2 polymorphisms.
This data demonstrates that terbutaline inhibited IFNγ, however, it increased IL-17A in samples with the common Gly16 polymorphism of ADRB2. Nebivolol inhibited IL-17A regardless of ADRB2 polymorphisms. Thus, nebivolol is a strong candidate for treating inflammatory diseases or disorders where IL-17A exacerbates symptoms.

| [1] | Kotake S, Udagawa N, Takahashi N, et al. (1999) IL-17 in synovial fluids from patients with rheumatoid arthritis is a potent stimulator of osteoclastogenesis. J Clin Invest 103: 1345-1352. |
| [2] | Shah K, Lee WW, Lee SH, et al. (2010) Dysregulated balance of Th17 and Th1 cells in systemic lupus erythematosus. Arthritis Res Ther 12: R53. |
| [3] | Tzartos JS, Friese MA, Craner MJ, et al. (2008) Interleukin-17 production in central nervous system-infiltrating T cells and glial cells is associated with active disease in multiple sclerosis. Am J Pathol 172: 146-155. |
| [4] | Khoury SJ, Healy BC, Kivisakk P, et al. (2010) A randomized controlled double-masked trial of albuterol add-on therapy in patients with multiple sclerosis. Arch Neurol 67: 1055-1061. |
| [5] | Kobilka BK, Dixon RA, Frielle T, et al. (1987) cDNA for the human beta 2-adrenergic receptor: a protein with multiple membrane-spanning domains and encoded by a gene whose chromosomal location is shared with that of the receptor for platelet-derived growth factor. P Natl Acad Sci USA 84: 46-50. |
| [6] | Baker JG (2005) The selectivity of β-adrenoceptor antagonists at the human β1, β2 and β3 adrenoceptors. Brit J Pharmacol 144: 317-322. |
| [7] | Olawi N, Krüger M, Grimm D, et al. (2019) Nebivolol in the treatment of arterial hypertension. Basic Clin Pharmacol Toxicol 125: 189-201. |
| [8] | Erickson CE, Gul R, Blessing CP, et al. (2013) The β-blocker nebivolol is a GRK/β-arrestin biased agonist. PloS One 8: e71980. |
| [9] | Ignarro LJ (2008) Different pharmacological properties of two enantiomers in a unique β-blocker, nebivolol. Cardiovasc Ther 26: 115-134. |
| [10] | Theron AJ, Steel HC, Tintinger GR, et al. (2013) Can the anti-inflammatory activities of β2-agonists be harnessed in the clinical setting? Drug Des Devel Ther 7: 1387-1398. |
| [11] | Gonczi CMC, Shafiei MT, East A, et al. (2017) Reciprocal modulation of helper Th1 and Th17 cells by the β2-adrenergic receptor agonist drug terbutaline. FEBS J 284: 3018-3028. |
| [12] | Kohm AP, Sanders VM (2001) Norepinephrine and beta 2-adrenergic receptor stimulation regulate CD4+ T and B lymphocyte function in vitro and in vivo. Pharmacol Rev 53: 487-525. |
| [13] | McAlees JW, Smith LT, Erbe RS, et al. (2011) Epigenetic regulation of beta2-adrenergic receptor expression in TH1 and TH2 cells. Brain Behav Immun 25: 408-415. |
| [14] | Sanders VM, Baker RA, Ramer-Quinn DS, et al. (1997) Differential expression of the beta2-adrenergic receptor by Th1 and Th2 clones: implications for cytokine production and B cell help. J Immunol 158: 4200-4210. |
| [15] | Agarwal SK, Marshall GD (2000) Beta-adrenergic modulation of human type-1/type-2 cytokine balance. J Allergy Clin Immun 105: 91-98. |
| [16] | Ramer-Quinn DS, Baker RA, Sanders VM (1997) Activated T helper 1 and T helper 2 cells differentially express the beta-2-adrenergic receptor: a mechanism for selective modulation of T helper 1 cell cytokine production. J Immunol 159: 4857-4867. |
| [17] | Johnatty SE, Abdellatif M, Shimmin L, et al. (2002) Beta 2 adrenergic receptor 5′ haplotypes influence promoter activity. Brit J Pharmacol 137: 1213-1216. |
| [18] | Cagliani R, Fumagalli M, Pozzoli U, et al. (2009) Diverse evolutionary histories for β-adrenoreceptor genes in humans. Am J Hum Genet 85: 64-75. |
| [19] | Drysdale CM, McGraw DW, Stack CB, et al. (2000) Complex promoter and coding region beta 2-adrenergic receptor haplotypes alter receptor expression and predict in vivo responsiveness. P Natl Acad Sci USA 97: 10483-10488. |
| [20] | Johnson M (2006) Molecular mechanisms of β2-adrenergic receptor function, response, and regulation. J Allergy Clin Immun 117: 18-24. |
| [21] | Israel E, Drazen JM, Liggett SB, et al. (2000) The effect of polymorphisms of the beta(2)-adrenergic receptor on the response to regular use of albuterol in asthma. Am J Resp Crit Care 162: 75-80. |
| [22] | Israel E, Chinchilli VM, Ford JG, et al. (2004) Use of regularly scheduled albuterol treatment in asthma: genotype-stratified, randomised, placebo-controlled cross-over trial. Lancet 364: 1505-1512. |
| [23] | Taylor DR, Drazen JM, Herbison GP, et al. (2000) Asthma exacerbations during long term beta agonist use: influence of beta(2) adrenoceptor polymorphism. Thorax 55: 762-767. |
| [24] | Oostendorp J, Postma DS, Volders H, et al. (2005) Differential desensitization of homozygous haplotypes of the β2-adrenergic receptor in lymphocytes. Am J Resp Crit Care 172: 322-328. |
| [25] | Shafiei MT, Gonczi CMC, Rahman MS, et al. (2014) Detecting glycogen in peripheral blood mononuclear cells with periodic acid schiff staining. J Vis Exp 94: 1-8. |
| [26] | Mexhitaj I, Nyirenda MH, Li R, et al. (2019) Abnormal effector and regulatory T cell subsets in paediatric-onset multiple sclerosis. Brain 142: 617-632. |
| [27] | Loftus GR, Masson MEJ (1994) Using confidence intervals in within-subject designs. Psychon Bull Rev 1: 476-490. |
| [28] | Sanders VM, Baker RA, Ramer-Quinn DS, et al. (1997) Differential expression of the beta2-adrenergic receptor by Th1 and Th2 clones: implications for cytokine production and B cell help. J Immunol 158: 4200-4210. |
| [29] | Riether C, Kavelaars A, Wirth T, et al. (2011) Stimulation of β2-adrenergic receptors inhibits calcineurin activity in CD4(+) T cells via PKA-AKAP interaction. Brain Behav Immun 25: 59-66. |
| [30] | Alcorn JF, Crowe CR, Kolls JK (2010) Th17 Cells in asthma and COPD. Annu Rev Physiol 72: 495-516. |
| [31] | Newcomb DC, Peebles RS (2013) Th17-mediated inflammation in asthma. Curr Opin Immunol 25: 755-760. |
| [32] | Hofmann SR, Mäbert K, Kapplusch F, et al. (2019) cAMP response element modulator α induces dual specificity protein phosphatase 4 to promote effector T cells in juvenile-onset lupus. J Immunol 203: 2807-2816. |
| [33] | Durelli L, Conti L, Clerico M, et al. (2009) T-helper 17 cells expand in multiple sclerosis and are inhibited by interferon-beta. Ann Neurol 65: 499-509. |
| [34] | Darlington PJ, Touil T, Doucet JS, et al. (2013) Diminished Th17 (not Th1) responses underlie multiple sclerosis disease abrogation after hematopoietic stem cell transplantation. Ann Neurol 73: 341-354. |
| [35] | Bacher P, Hohnstein T, Beerbaum E, et al. (2019) Human anti-fungal Th17 immunity and pathology rely on cross-reactivity against Candida albicans. Cell 176: 1340-1355. |
| [36] | Montgomery CP, Daniels M, Zhao F, et al. (2014) Protective immunity against recurrent Staphylococcus aureus skin infection requires antibody and interleukin-17A. Infect Immun 82: 2125-2134. |
| [37] | Shahane G, Parsania C, Sengupta D, et al. (2014) Molecular insights into the dynamics of pharmacogenetically important N-terminal variants of the human β2-adrenergic receptor. PLoS Comput Biol 10: e1004006. |
| [38] | Bhosale S, Nikte SV, Sengupta D, et al. (2019) Differential dynamics underlying the Gln27Glu population variant of the β2-adrenergic receptor. J Membr Biol 252: 499-507. |
| [39] | Darlington PJ, Stopnicki B, Touil T, et al. (2018) Natural killer cells regulate Th17 cells after autologous hematopoietic stem cell Transplantation for relapsing remitting multiple sclerosis. Front Immunol 9: 834. |
| [40] | Beng H, Zhang H, Jayachandra R, et al. (2018) Enantioselective resolution of Rac-terbutaline and evaluation of optically pure R-terbutaline hydrochloride as an efficient anti-asthmatic drug. Chirality 30: 759-768. |
 allergy-05-04-017-s001.pdf allergy-05-04-017-s001.pdf |
 |
Figures(7) / Tables(4)

Catalina Marysol Carvajal Gonczi, Fadi Touma, Tina Daigneault, Chelsea Pozzebon, Kelly Burchell-Reyes, Peter J. Darlington. Modulation of IL-17A and IFNγ by β2-adrenergic agonist terbutaline and inverse-agonist nebivolol, influence of ADRB2 polymorphisms[J]. AIMS Allergy and Immunology, 2021, 5(4): 222-239. doi: 10.3934/Allergy.2021017


 DownLoad: