Four solar dryers were tested for dehydrating mango slices. The design of the dryers included setups allowing direct exposure of the fruit to the sun, with fans (DF) or without fans (DnoF), as well as setups that provided shade to the fruits, with fans (IF) and without fans (InoF). Mango slices dried in the open sun (OS) were used as a control. Parameters measured included air temperature, humidity, fruit weight loss, and dried mango analysis for water content, water activity, and microbial count. The setups DF and IF dried the mango slices approximately 40 hours faster than OS, while DnoF took approximately 74 hours and did not dry the mango to the microbial-safety zone of 0.6 of water activity. Microbiological analysis (Enterobacteriaceae, lactic acid bacteria, mould, and yeast) showed no significant differences except for total aerobic plate count, which, despite the difference, its values remained under the safe consumption limit of 4 CFU/g. The economic evaluation suggests a potential revenue of 980 USD for smallholder farmers in Mozambique using DF and IF setups from the first year. This study advocates for solar dryers to reduce post-harvest losses and increase income in rural Mozambique.
Citation: Paula Viola Salvador, Randi Phinney, Karolina Östbring, Lucas Tivana, Marilyn Rayner, Federico Gómez Galindo, Henrik Davidsson. Minimizing post-harvest waste of mango in rural Mozambique—The effect of different solar setups in mango drying[J]. AIMS Agriculture and Food, 2025, 10(1): 58-73. doi: 10.3934/agrfood.2025004
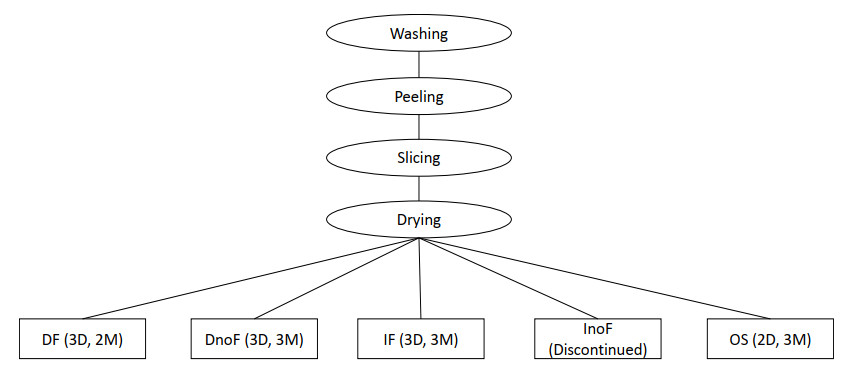
Four solar dryers were tested for dehydrating mango slices. The design of the dryers included setups allowing direct exposure of the fruit to the sun, with fans (DF) or without fans (DnoF), as well as setups that provided shade to the fruits, with fans (IF) and without fans (InoF). Mango slices dried in the open sun (OS) were used as a control. Parameters measured included air temperature, humidity, fruit weight loss, and dried mango analysis for water content, water activity, and microbial count. The setups DF and IF dried the mango slices approximately 40 hours faster than OS, while DnoF took approximately 74 hours and did not dry the mango to the microbial-safety zone of 0.6 of water activity. Microbiological analysis (Enterobacteriaceae, lactic acid bacteria, mould, and yeast) showed no significant differences except for total aerobic plate count, which, despite the difference, its values remained under the safe consumption limit of 4 CFU/g. The economic evaluation suggests a potential revenue of 980 USD for smallholder farmers in Mozambique using DF and IF setups from the first year. This study advocates for solar dryers to reduce post-harvest losses and increase income in rural Mozambique.

| [1] |
Oniang'o R, Allotey J, Malaba SJ (2004) Contribution of Indigenous Knowledge and Practices in Food Technology to the Attainment of Food Security in Africa. J Food Sci 69: 87–91. http://doi.org/10.1111/j.1365-2621.2004.tb13346.x doi: 10.1111/j.1365-2621.2004.tb13346.x

|
| [2] |
Kiremire BT, Musinguzi E, Kikafunda JK, et al. (2010) Effects of vegetable drying techniques on nutrient content: a case study of south-western Uganda. Afr J Food, Agric, Nutr Dev 10: 2587–2600. https://doi.org/10.4314/ajfand.v10i5.56341 doi: 10.4314/ajfand.v10i5.56341
|
| [3] |
Porat R, Lichter A, Terry, LA et al. (2018) Postharvest losses of fruit and vegetables during retail and in consumers' homes: Quantifications, causes, and means of prevention. Postharvest Biol Technol 139: 135–149. https://doi.org/10.1016/j.postharvbio.2017.11.019 doi: 10.1016/j.postharvbio.2017.11.019
|
| [4] | FAO (2011) Global food losses and food waste—Extent, causes and prevention. Food and Agriculture Organization. Rome, Italy. Available from: https://www.fao.org/4/mb060e/mb060e.pdf. |
| [5] | Phinney R, Rayner M, Sjöholm I, et al. (2015) Solar assisted pervaporation (SAP) for preserving and utilizing fruits in developing countries. 3rd Southern African Solar Energy Conference, South Africa, 11–13. Available from: http://repository.up.ac.za/dspace/bitstream/handle/2263/49551/Phinney_Solar_2015.pdf?sequence=1&isAllowed=y. |
| [6] | FAOSTAT. Available from: https://www.fao.org/faostat/en/#data/QCL. |
| [7] |
Mongi RJ (2023) Physicochemical properties, microbial loads and shelf life prediction of solar dried mango (Mangifera indica) and pineapple (Ananas comosus) in Tanzania. J Agric Food Res 11: 1–9. https://doi.org/10.1016/j.jafr.2023.100522 doi: 10.1016/j.jafr.2023.100522
|
| [8] |
Rickman JC, Bruhn CM, Barrett DM (2007) Nutritional comparison of fresh, frozen, and canned fruits and vegetables Ⅱ. Vitamin A and carotenoids, vitamin E, minerals and fiber. J Sci Food Agric 87: 1185–1196. https://doi.org/10.1002/jsfa.2824 doi: 10.1002/jsfa.2824
|
| [9] | Chaignon J, Davidsson H (2017) Modeling of a solar dryer for food preservation in developing countries. Proceedings of SWC2017/SHC2017, 1–11. https://doi.org/10.18086/swc.2017.30.01 |
| [10] | Davidsson H, Olsson J, Phinney R, et al. (2017) Towards a homogenous drying rate using a solar fruit dryer. Proceedings of SWC2017/SH2017, 1–7. https://doi.org/10.18086/swc.2017.24.01 |
| [11] | Deslandes E, Samuelsson P (2017) Testing of solar fruit driers in laboratory and in Mozambique. [masterxs thesis]. Lund: Lund University. Available from: http://lup.lub.lu.se/student-papers/record/8925639. |
| [12] |
Ekechukwu OV, Norton B (1999) Review of solar-energy drying systems Ⅱ: An overview of solar drying technology. Energy Convers Manage 40: 615–655. https://doi.org/10.1016/s0196-8904(98)00093-4 doi: 10.1016/s0196-8904(98)00093-4
|
| [13] |
Chitrakar B, Zhang M, Adhikari B (2018) Dehydrated foods: Are they microbiologically safe? Crit Rev Food Sci Nutr 59: 2734–2745. https://doi.org/10.1080/10408398.2018.1466265 doi: 10.1080/10408398.2018.1466265
|
| [14] | Visavale GL (2012). Principles, classification and selection of solar dryers. In: Hii CL, Jangam SV, Ong SP, et al. (Eds.), Solar drying: Fundamentals, applications and innovations, Singapore: TPR Group Publication, 1–50. Available from: https://www.arunmujumdar.com/file/Publications/books/Solar%20Drying_Fundamentals_Applications_and_Innovations.pdf. |
| [15] |
Oliveira SM, Brandão TRS, Silva, CLM (2015) Influence of drying processes and pretreatments on nutritional and bioactive characteristics of dried vegetables: A review. Food Eng Rev 8: 134–163. https://doi.org/10.1007/s12393-015-9124-0 doi: 10.1007/s12393-015-9124-0
|
| [16] |
Radhakrishnan GG, Sattanathan M, Radhakrishnan RKG, et al. (2024) Phase-change material-based solar dryer: An experimental investigation for drying mango pulp. Solar Energy 277: 112716. https://doi.org/10.1016/j.solener.2024.112716 doi: 10.1016/j.solener.2024.112716
|
| [17] | Gatea AA (2011) Performance evaluation of a mixed-mode solar dryer for evaporating moisture in beans. J Agric Biotechnology Sustainable Dev 3: 65–71. Available from: http://www.academicjournals.org/JABSD. |
| [18] | AOAC (Association of Official Analytical Chemists) (1990) Official Methods of Analysis, 15th ed. Arlington, USA. |
| [19] | ISO (2008) Water quality—Determination of pH (ISO 10523: 2008) Switzerland: International Organization for standardization. |
| [20] | Umogbai VI, Iorter HA (2013) Design, construction and performance evaluation of a passive solar dryer for maize cobs. Afr J Food Sci Technol 4: 110–115. Available from: http://www.interesjournals.org/AJFST. |
| [21] | Boxwell, M (2019) Solar angle calculator. In: Boxwell M (Ed.), Solar Electricity Handbook, 13th Eds., London: Greenstream Publishing. |
| [22] |
Tiwari S, Tiwari GN, Al-Helal IM (2016) Performance analysis of photovoltaic-thermal (PVT) mixed mode greenhouse solar dryer. Solar Energy 133: 421–428. https://doi.org/10.1016/j.solener.2016.04.033 doi: 10.1016/j.solener.2016.04.033
|
| [23] | Tapia MS, Alzamora SM, Chirife J (2020) Effects of water activity (aw) on microbial stability as a hurdle in food preservation. In: Barosa-Cánovas GV, Fontana Jr AJ, Schmidt S, et al. (Eds.), Water Activity in Foods, 2nd Eds., New Jersey: John Willey & Sons, Inc, 323–355. https://doi.org/10.1002/9781118765982.ch14 |
| [24] | Labuza T, Shafiur Rahman M (2007) Water activity and food preservation. In: Rahman MS (Ed.), Handbook of Food Preservation, 2nd Eds., Florida: CRC Press, 447–476. https://doi.org/10.1201/9781420017373.ch20 |
| [25] | AOAC (Association of Official Analytical Chemists) (2005) Official Methods of Analysis, 18th ed. USA, Gaithersburg. |
| [26] | ISO (2005) Milk and milk products—Quality control in microbiological laboratories—Part 2: Determination of reliability of colony counts of parallel plates and subsequent dilution steps. Switzerland: International Organization for standardization (ISO) and International Dairy Federation (IDF). https://doi.org/10.3403/30093800u |
| [27] |
Rabha DK, Muthukumar P (2017) Performance studies on a forced convection solar dryer integrated with a paraffin wax-based latent heat storage system. Solar Energy 149: 214–226. https://doi.org/10.1016/j.solener.2017.04.012 doi: 10.1016/j.solener.2017.04.012
|
| [28] |
Phiney R, Tivana DL, Sjöholm I, et al. (2019) Concentration of citrus fruit juices in membrane pouches with solar energy Part 1: How solar drying setup and juice pretreatment determine the drying flux. J Food Proc Eng 43: 1–21. https://doi.org/10.1111/jfpe.13377 doi: 10.1111/jfpe.13377
|
| [29] |
Naveenkumar R, Ravichandran M, Harish R, et al. (2023) Comprehensive review on ideas, designs and current techniques in solar dryer for food applications. Environ Sci Pollut Res 30: 93435–93461. https://doi.org/10.1007/s11356-023-28951-6 doi: 10.1007/s11356-023-28951-6
|
| [30] |
Gebre GD, Keneni YG, Gebremariam SN, et al. (2024) Drying kinetics and mathematical modeling of seeds of two mango varieties at different temperatures and with different pretreatments. Biofuels, Bioprod Biorefin 18: 899–926. https://doi.org/10.1002/bbb.2611 doi: 10.1002/bbb.2611
|
| [31] | Authority NF (2009) Microbiological quality guide for ready-to-eat foods: a guide to interpreting microbiological results. NSW/FA/CP028/0906 32: 08–017. Available from: Microbiological quality guide for ready-to-eat foods. |
| [32] | Willey JM, Sherwood LM, Woolverton CJ (2008) Microbial growth. In: Willey JM, Sherwood LM, Woolverton CJ (Eds.), Prescott, Harley, and Klein's microbiology, 7th Eds., New York: McGraw-Hill, 119–148. Available from: Prescott Microbiology 7th Edition.pdf. |
| [33] |
Farrell J, Rose A (1967) Temperature effects on microorganisms. Ann Rev Microbiol 21: 101–120. https://doi.org/10.1146/annurev.mi.21.100167.000533 doi: 10.1146/annurev.mi.21.100167.000533
|


Figures(4) / Tables(4)

Paula Viola Salvador, Randi Phinney, Karolina Östbring, Lucas Tivana, Marilyn Rayner, Federico Gómez Galindo, Henrik Davidsson. Minimizing post-harvest waste of mango in rural Mozambique—The effect of different solar setups in mango drying[J]. AIMS Agriculture and Food, 2025, 10(1): 58-73. doi: 10.3934/agrfood.2025004


 DownLoad: