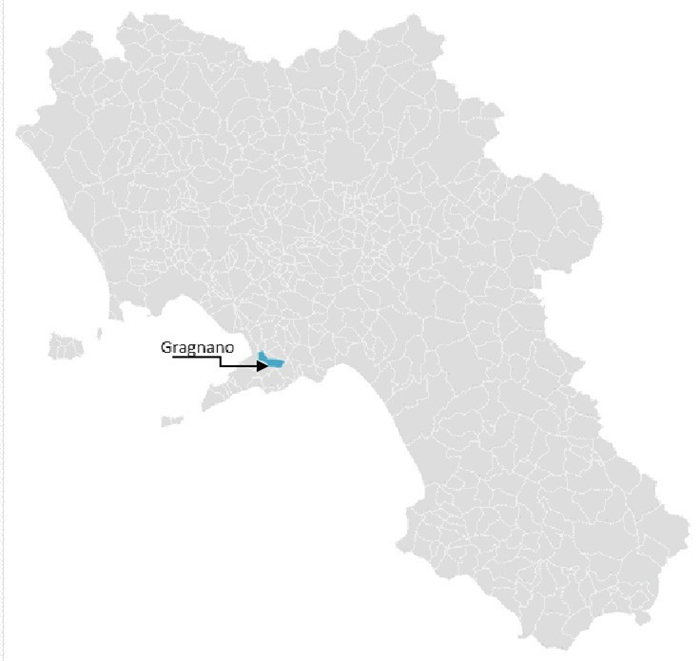
The scholarly community has been paying more attention to the issue of the revitalization of the historical conservation of cities and their alteration in the wake of Southern Italy's growing urbanization. Experts and scholars are beginning to understand the need for collaborative urban regeneration initiatives, protecting historical and cultural elements, upholding cultural identities, and establishing development districts. The Valley of the Mills of Gragnano, the subject of the proposed case study, is a complex issue that requires the consideration of several factors in addition to urban regeneration. These factors include the need to identify a system of multiple actions to regenerate the area, considering the current requirements for mitigating environmental risk in areas with cultural heritage, and suggesting monitoring and public participation actions for preservation. The complexity of the Valley of the Mills renovation is understood; it goes beyond the simple structural and architectural restoration of the buildings. In other cities similar to Gragnano where industrial, historical archeology and naturalistic significance run the risk of adversely affecting an extremely significant area from a historical and cultural perspective due to naturalistic and anthropogenic impacts, the article's goal is to present the case study of Gragnano as an example of a sustainable and moral urban renewal strategy. This research work aims to be proposed as a policy development guide for policy makers at local and regional levels for the development of the area.
Citation: Irina Di Ruocco. A political concept for the Gragnano Valley of Mills (Valle dei Mulini). Urban redevelopment of cultural-industrial heritage[J]. Urban Resilience and Sustainability, 2023, 1(4): 278-308. doi: 10.3934/urs.2023018
The scholarly community has been paying more attention to the issue of the revitalization of the historical conservation of cities and their alteration in the wake of Southern Italy's growing urbanization. Experts and scholars are beginning to understand the need for collaborative urban regeneration initiatives, protecting historical and cultural elements, upholding cultural identities, and establishing development districts. The Valley of the Mills of Gragnano, the subject of the proposed case study, is a complex issue that requires the consideration of several factors in addition to urban regeneration. These factors include the need to identify a system of multiple actions to regenerate the area, considering the current requirements for mitigating environmental risk in areas with cultural heritage, and suggesting monitoring and public participation actions for preservation. The complexity of the Valley of the Mills renovation is understood; it goes beyond the simple structural and architectural restoration of the buildings. In other cities similar to Gragnano where industrial, historical archeology and naturalistic significance run the risk of adversely affecting an extremely significant area from a historical and cultural perspective due to naturalistic and anthropogenic impacts, the article's goal is to present the case study of Gragnano as an example of a sustainable and moral urban renewal strategy. This research work aims to be proposed as a policy development guide for policy makers at local and regional levels for the development of the area.

| [1] | European Commission (2019) A European green deal, striving to be the first climate-neutral continent. Available from: https://ec.europa.eu/info/strategy/priorities-2019-2024/european-green-deal_en. |
| [2] | United Nations (2015) United Nations (UN) Paris Climate Agreement, Paris, France. |
| [3] | European Commission (2020) A renovation wave for Europe—Greening our buildings, creating jobs, improving lives. COM/2020/662 Final. Available from: https://energy.ec.europa.eu/topics/energy-efficiency/energy-efficient-buildings/renovation-wave_en. |
| [4] | European Commission (2020) New European Bauhaus. Available from: https://europa.eu/new-european-bauhaus/index_en. |
| [5] | European Parliament (2010) Directive 2010/31/EU of the European parliament and of the council of 19 May 2010 on the energy performance of buildings. Available from: https://eur-lex.europa.eu/legal-content/EN/ALL/; ELX_SESSIONID = FZMjThLLzfxmmMCQGp2Y1s2d3TjwtD8QS3pqdkhXZbwqGwlgY9KN!2064651424?uri = CELEX: 32010L0031. |
| [6] | European Parliament (2018) Directive 2018/844 of the European parliament and of the council of 30 May 2018 amending directive 2010/31/EU on the energy performance of buildings and directive 2012/27/EU on energy efficiency. Available from: https://eur-lex.europa.eu/legal-content/EN/TXT/?uri = uriserv%3AOJ.L_.2018.156.01.0075.01.ENG. |
| [7] | European Parliament (2018) Directive (EU) 2018/2002 of the European parliament and of the council of 11 December 2018 amending directive 2012/27/EU on energy efficiency. Available from: https://eur-lex.europa.eu/legal-content/EN/TXT/?uri = uriserv: OJ.L_.2018.328.01.0210.01.ENG. |
| [8] | European Parliament (2018) Directive 2012/27/EU of the European parliament and of the council of 25 October 2012 on energy efficiency, amending directives 2009/125/EC and 2010/30/EU and repealing directives 2004/8/EC and 2006/32/EC. Available from: https://eur-lex.europa.eu/legal-content/EN/TXT/?qid = 1399375464230 & uri = CELEX: 32012L0027. |
| [9] | United Nations. The sustainable development agenda. Available from: https://www.un.org/sustainabledevelopment/development-agenda/. |
| [10] | International Centre for the Study of Preservation and Restoration of Cultural Property (ICCROM) (2016) A Guide to Risk Management of Cultural Heritage. Sharjah, United Arab Emirates. Available from: https://www.iccrom.org/sites/default/files/Guide-to-Risk-Managment_English.pdf. |
| [11] | United Nations. Transforming our world: The 2030 agenda for sustainable development. Available from: https://sustainabledevelopment.un.org/content/documents/21252030%20Agenda%20for%20Sustainable%20Development%20web.pdf. |
| [12] | Standard EN 16883-2017, Conservation of cultural heritage—Guidelines for improving the energy performance of historic buildings. Comitè Européen de Normalization (CEN): Bruxelles, Belgium, 2017. Available from: https://standards.iteh.ai/catalog/standards/cen/189eac8d-14e1-4810-8ebd-1e852b3effa3/en-16883-2017. |
| [13] | European Commission (2015) In-Depth report: Indicators for sustainable cities. Available from: https://op.europa.eu/en/publication-detail/-/publication/eb3235cf-8f50-11e5-983e-01aa75ed71a1. |
| [14] |
Steinberg F (1996) Conservation and rehabilitation of urban heritage in developing countries. Habitat Int 20: 463–475. https://doi.org/10.1016/0197-3975(96)00012-4 doi: 10.1016/0197-3975(96)00012-4

|
| [15] |
Di Ruocco G, Sicignano E, Galizia I (2017) Strategy of sustainable development of an industrial archaeology. Procedia Eng 180: 1664–1674. https://doi.org/10.1016/j.proeng.2017.04.329 doi: 10.1016/j.proeng.2017.04.329
|
| [16] |
Di Ruocco G, Sicignano E, Fiore P, et al. (2017) Sustainable reuse of disused railway. Procedia Eng 180: 1643–1652. https://doi.org/10.1016/j.proeng.2017.04.327 doi: 10.1016/j.proeng.2017.04.327
|
| [17] | Ricci L, Mariano C (2023) Territorial governance and climate adaptation. Towards an environmental perspective of urban regeneration. World Heritage and Dwelling on Earth Le Vie dei Mercanti_XXI International Forum, Gangemi editore, 439–449. Available from: https://iris.uniroma1.it/handle/11573/1680704. |
| [18] | Camera dei deputati, istituto di ricerca CRESME (2022) Le politiche di rigenerazione urbana, Prospettive E Possibili Impatti. (Italian) Available from: https://documenti.camera.it/leg18/dossier/pdf/am0036d.pdf?_1659609150626. |
| [19] | Italian Government (2021) The national recovery and resilience plan. Available from: https://www.mef.gov.it/en/focus/The-National-Recovery-and-Resilience-Plan-NRRP/. |
| [20] | Ricci L, Mariano C (2022) Urban regeneration, climate adaptation and territorial governance. Integrating urbanism and ecology in the plan. In: Abitare La Terra., ISSN 1592-8608, 78: 11–14. Available from: https://iris.uniroma1.it/handle/11573/1656178. |
| [21] | The Valley of Mills. Available from: https://www.valledeimulinigragnano.it/. |
| [22] |
Xia X, Zhang Y, Zhang Y, et al. (2022) The spatial pattern and influence mechanism of urban vitality: A case study of Changsha, China. Front Env Sci 10: 942577. https://doi.org/10.3389/fenvs.2022.942577 doi: 10.3389/fenvs.2022.942577
|
| [23] | Xie J, Heath T (2017) Heritage-led Urban Regeneration in China. UK: Routledge. Available from: https://sc.panda985.com/#v = onepage & q = Xie%20J%2C%20Heath%20T%20(2017)%20Heritage-led%20urban%20regeneration%20in%20China.%20England%2C%20UK%3A%20Routledge. & f = false. |
| [24] |
Xie S, Gu K, Zhang X (2020) Urban conservation in China in an international context: Retrospect and prospects. Habitat Int 95: 102098. https://doi.org/10.1016/j.habitatint.2019.102098 doi: 10.1016/j.habitatint.2019.102098
|
| [25] | Calabrò F, Iannone L, Pellicanò R (2021) The historical and environmental heritage for the attractiveness of cities. The case of the Umbertine Forts of Pentimele in Reggio Calabria, Italy. In: Bevilacqua, C., Calabrò, F., Della Spina, L., Smart Innovation, Systems and Technologies, 178. Springer, Cham. https://doi.org/10.1007/978-3-030-48279-4_188 |
| [26] |
Chen X, Zhu H, Yuan Z (2020) Contested memory amidst rapid urban transition: The cultural politics of urban regeneration in Guangzhou, China. Cities 102: 102755. https://doi.org/10.1016/j.cities.2020.102755 doi: 10.1016/j.cities.2020.102755
|
| [27] |
Chen J, Judd B, Hawken S (2016) Adaptive reuse of industrial heritage for cultural purposes in Beijing, Shanghai and Chongqing. Struct Surv 34: 331–350. https://doi.org/10.1108/SS-11-2015-0052 doi: 10.1108/SS-11-2015-0052
|
| [28] | Martone M (2023) Vanished landscapes. New scenarios for dwelling on earth with the awareness of the past for a sustainable future. The ancient Vallis regia, now Lake Barrea. Intervento presentato al convegno XXI International Forum. World heritage and dwelling on earth, 56–62. Available from: https://iris.uniroma1.it/retrieve/f00e45cc-2011-4893-a3d3-5cd2436e780b/Martone_Vanished-landscapes._2023.pdf. |
| [29] | Messina B, Giordano C (2023) BIM methodologies to support the regeneration of the existing building heritage. Architecture Heritage and Design 12: 377–384. |
| [30] |
Sacco F, Conz E (2023) Corporate heritage communication strategies of iconic Italian brands: A multiple case study. Corp Commun: An Int J 28: 19–43. https://doi.org/10.1108/CCIJ-12-2021-0136 doi: 10.1108/CCIJ-12-2021-0136
|
| [31] | Spieler M (2023) Taste of Naples: Neapolitan Culture, Cuisine, and Cooking. Now York: Rowman & Littlefield. Available from: https://sc.panda985.com/#v = onepage & q = Spieler%20M%20(2023)%20Taste%20of%20Naples%3A%20Neapolitan%20culture%2C%20cuisine%2C%20and%20cooking.%20Rowman%20%26%20Littlefield & f = false. |
| [32] |
Luino F, Gizzi FT, Palmieri W, et al. (2023) Historical memory as an effective and useful tool for proper land use planning: Lessons learnt from some Italian cases. Land 12: 1751. https://doi.org/10.3390/land12091751 doi: 10.3390/land12091751
|
| [33] | Ceniccola G (2017) 'Architetture dell'acqua' e identità culturale. La Valle dei Mulini di Gragnano (Napoli)/'Water architectures' and cultural identity. The Valley of the mills in Gragnano (Naples) 2017. In: Aveta, A., Marino, B.G., Amore, R., La Baia di Napoli. Strategie Per la Conservazione e la Fruizione del Paesaggio Culturale, Napoli: Artstudio Paparo, 214–218. (Italian) Available from: https://www.academia.edu/35741315/_Architetture_dell_acqua_e_identit%C3%A0_culturale_La_Valle_dei_mulini_di_Gragnano_Napoli_Water_architectures_and_cultural_identity_The_Valley_of_the_mills_in_Gragnano_Naples_. |
| [34] |
Quaranta E, Pujol T, Grano MC (2023) The repowering of vertical axis water mills preserving their cultural heritage: Techno-economic analysis with water wheels and Turgo turbines. J Cult Herit Manag S 13: 269–287. https://doi.org/10.1108/JCHMSD-03-2021-0040 doi: 10.1108/JCHMSD-03-2021-0040
|
| [35] |
Rey A, Landi GC, Agliata F, et al. (2023) Managing the tradition and innovation paradox of the agribusiness industry: The impact of the network on operating, financial and social performance. J Intellect Cap 24: 1447–1463. https://doi.org/10.1108/JIC-04-2023-0087 doi: 10.1108/JIC-04-2023-0087
|
| [36] | Building Research Establishment (2023) BREAM communities. Available from: https://www.breeam.com/discover/technical-standards/communities. |
| [37] | Building Research Establishment, BREAM. Available from: https://bregroup.com/products/breeam/. |
| [38] | Building Research Establishment (2017) BREEAM communities. https://tools.breeam.com/filelibrary/BREEAM%20Communities/Introduction_to_BREEAM_Communities.pdf. |
| [39] | Barton H, Grant M, Guise R (2002) Shaping Neighbourhoods: For Local Health and Global Sustainability. London: Routledge. https://doi.org/10.4324/9780203986882 |
| [40] |
Lerario A (2022) The role of built heritage for sustainable development goals: From statement to action. Heritage 5: 2444–2464. https://doi.org/10.3390/heritage5030127 doi: 10.3390/heritage5030127
|
| [41] | Shetabi L (2015) Heritage conservation and environmental sustainability: Revisiting the evaluation criteria for built heritage. Australia ICOMOS Conference: Threads of Conservation, Australia ICOMOS, Adelaide, Australia, 2–21. https://doi.org/10.13140/RG.2.1.4265.6086 |
| [42] |
Serraino M, Lucchi E (2017) Energy efficiency, heritage conservation, and landscape integration: The case study of the San Martino Castle in Parella (Turin, Italy). Energy Procedia 133: 424–434. https://doi.org/10.1016/j.egypro.2017.09.387 doi: 10.1016/j.egypro.2017.09.387
|
| [43] | Rząsa K, Ogryzek M, Kulawiak M (2016) Cultural heritage in spatial planning. 2016 Baltic Geodetic Congress (Geomatics), IEEE, Gdansk, Poland, 85–89. https://doi.org/10.1109/BGC.Geomatics.2016.24 |
| [44] | International Council on Monuments and Sites (2011) The Paris declaration on heritage as a driver of development. Paris, France. Available from: https://www.icomos.org/images/DOCUMENTS/Charters/GA2011_Declaration_de_Paris_EN_20120109.pdf. |
| [45] | Mang P, Reed B (2013) Regenerative development and design. In: Loftness, V., Haase, D., Sustainable Built Environments, Springer, New York. http://dx.doi.org/10.1007/978-1-4614-5828-9_303 |
| [46] |
Zhao Y, Ponzini D, Zhang R (2020) The policy networks of heritage-led development in Chinese historic cities: The case of Xi'an's Big Wild Goose Pagoda area. Habitat Int 96: 102106. https://doi.org/10.1016/j.habitatint.2019.102106 doi: 10.1016/j.habitatint.2019.102106
|
| [47] |
Magdi SA, Ibrahim ME (2023) Towards a compatible methodology for urban heritage sustainable development: A case study of Cairo historical center—Egypt. Int J Adv Eng Bus Sci 4: 144–170. https://doi.org/10.21608/IJAEBS.2023.171887.1066 doi: 10.21608/IJAEBS.2023.171887.1066
|
| [48] | Macchi Cassia C (1991) Il Grande Progetto Urbano. La Forma Della Città e i Desideri Dei Cittadini. Carocci. (Italian) Available from: https://www.ibs.it/grande-progetto-urbano-forma-della-libro-cesare-macchi-cassia/e/9788843008247. |
| [49] |
Lucchi E (2016) Multidisciplinary risk-based analysis for supporting the decision-making process on conservation, energy efficiency, and human comfort in museum buildings. J Cult Herit 22: 1079–1089. https://doi.org/10.1016/j.culher.2016.06.001 doi: 10.1016/j.culher.2016.06.001
|
| [50] | Monclús J (2018) Urban renewal and urban regeneration. In: Díez Medina, C., Monclús, J., Urban Visions, Springer, Cham. https://doi.org/10.1007/978-3-319-59047-9_12 |
| [51] |
Cizler J (2012) Urban regeneration effects on industrial heritage and local community—Case study: Leeds, UK. Sociologija i prostor 50: 223–236. https://doi.org/10.5673/sip.50.2.5 doi: 10.5673/sip.50.2.5
|
| [52] |
Camarda D (2018) Building sustainable futures for post-industrial regeneration: The case of Taranto, Italy. Urban Res Pract 11: 275–283. https://doi.org/10.1080/17535069.2018.1498196 doi: 10.1080/17535069.2018.1498196
|
| [53] |
Lucchi E (2023) Regenerative design of archaeological sites: A pedagogical approach to boost environmental sustainability and social engagement. Sustainability 15: 3783. https://doi.org/10.3390/su15043783 doi: 10.3390/su15043783
|
| [54] | Whole Building Design Guide (WBDG) WDBG historic preservation subcommittee. Available from: www.wdbg.org. |
| [55] | Aveta A, Marino BG, Amore R, et al. (2018) La Baia di Napoli: Strategie integrate per la conservazione e la fruizione del paesaggio culturale. (Italian) Available from: https://www.researchgate.net/publication/322274165_La_Baia_di_Napoli_STRATEGIE_INTEGRATE_PER_LA_CONSERVAZIONE_E_LA_FRUIZIONE_DEL_PAESAGGIO_CULTURALE_a_cura_di_Aldo_Aveta_Bianca_Gioia_Marino_Raffaele_Amore. |
| [56] | Verazzo C, Ruocco G (2017) Il paesaggio culturale della valle dei mulini di Gragnano. Temi distoria e restauro. (Italian) Available from: https://ricerca.unich.it/handle/11564/683717. |
| [57] | Camardo D, Irollo G, Notomista M (2016) Map of the archaeological potential and historical building heritage of the Municipality of Gragnano (NA), Amalfi 2016. Available from: https://www.academia.edu/65349038/D_Camardo_G_Irollo_M_Notomista_Carta_del_potenziale_archeologico_e_del_patrimonio_edilizio_storico_del_Comune_di_Gragnano_NA_Amalfi_2016. |
| [58] | De Majo S, Camardo D, Notomista M, et al. (2018) Gragnano da città dei molini a città dei pastifici. Secoli XVI-XX. In: Fontana, G.L., Stati Generali del Patrimonio Industriale 2018, 5–23. (Italian) Available from: https://www.academia.edu/108811848/F_Caiazzo_D_Camardo_S_De_Majo_M_Notomista_Gragnano_da_citt%C3%A0_dei_mulini_a_citt%C3%A0_dei_pastifici_Secoli_XVI_XXI_in_Giovanni_Luigi_Fontana_a_cura_di_Stati_Generali_del_Patrimonio_Industriale_2018_Venezia_2018_pp_5_23. |
| [59] | Camardo D, Notomista M (2015) Gragnano città della pasta. Lo sviluppo dell'arte bianca e il nuovo assetto urbanistico di Gragnano nel XIX secolo. Rassegna del Centro di Cultura e Storia Amalfitana, 49-50/2015,171–200. (Italian) Available from: https://www.academia.edu/27174701/D_Camardo_M_Notomista_Gragnano_citt%C3%A0_della_pasta_Lo_sviluppo_dellarte_bianca_e_il_nuovo_assetto_urbanistico_di_Gragnano_nel_XIX_secolo_in_Rassegna_del_Centro_di_Cultura_e_Storia_Amlfitana_49_50_2015_pp_171_200. |
| [60] | Magni F (2019) Climate proof planning: L'adattamento in Italia tra sperimentazioni e innovazioni. (Italian) Available from: https://air.iuav.it/handle/11578/279854. |
| [61] | Maarleveld TJ, Guérin U, Egger B (2013) Manual for Activities Directed at Underwater Cultural Heritage: Guidelines to the Annex of the UNESCO 2001 Convention. Unesco. Available from: https://unesdoc.unesco.org/ark: /48223/pf0000220708. |
| [62] | Zanchini E, Musco F (2014) Il clima cambia le città. Strategie di adattamento e mitigazione nella pianificazione urbanistica. (Italian) Available from: https://www.francoangeli.it/Libro/Il-clima-cambia-le-citt%C3%A0-Strategie-di-adattamento-e-mitigazione-nella-pianificazione-urbanistica?Id = 21883. |
| [63] | Baliestreri M (2021) Pianificazione e clima. (Italian) Available from: https://www.francoangeli.it/libro?id = 26144. |
| [64] | Pavia R (2019) Tra suolo e clima. La terra come infrastruttura ambientale. (Italian) Available from: https://www.donzelli.it/libro/9788868438890. |
| [65] | Fazia C, Bellamacina D, Catania GFG, et al. (2023) Urban regeneration in the age of transitions. In: Gervasi, O., Murgante, B., Rocha, A.M.A.C., Garau, C., Scorza, F., Karaca, Y., Torre, C.M., Computational Science and Its Applications—ICCSA 2023 Workshops, ICCSA 2023, Lecture Notes in Computer Science, Springer, Cham, 14107. https://doi.org/10.1007/978-3-031-37114-1_34 |
| [66] |
Brundtland GH (1987) Our common future—Call for action. Environ Conserv 14: 291–294. https://doi.org/10.1017/S0376892900016805 doi: 10.1017/S0376892900016805
|


Figures(14) / Tables(5)
Irina Di Ruocco. A political concept for the Gragnano Valley of Mills (Valle dei Mulini). Urban redevelopment of cultural-industrial heritage[J]. Urban Resilience and Sustainability, 2023, 1(4): 278-308. doi: 10.3934/urs.2023018


 DownLoad: