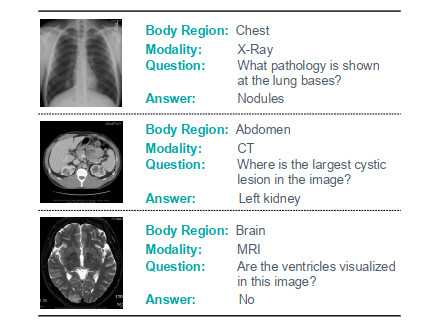
Medical visual question answering (Med-VQA) aims to leverage a pre-trained artificial intelligence model to answer clinical questions raised by doctors or patients regarding radiology images. However, owing to the high professional requirements in the medical field and the difficulty of annotating medical data, Med-VQA lacks sufficient large-scale, well-annotated radiology images for training. Researchers have mainly focused on improving the ability of the model's visual feature extractor to address this problem. However, there are few researches focused on the textual feature extraction, and most of them underestimated the interactions between corresponding visual and textual features. In this study, we propose a corresponding feature fusion (CFF) method to strengthen the interactions of specific features from corresponding radiology images and questions. In addition, we designed a semantic attention (SA) module for textual feature extraction. This helps the model consciously focus on the meaningful words in various questions while reducing the attention spent on insignificant information. Extensive experiments demonstrate that the proposed method can achieve competitive results in two benchmark datasets and outperform existing state-of-the-art methods on answer prediction accuracy. Experimental results also prove that our model is capable of semantic understanding during answer prediction, which has certain advantages in Med-VQA.
Citation: Han Zhu, Xiaohai He, Meiling Wang, Mozhi Zhang, Linbo Qing. Medical visual question answering via corresponding feature fusion combined with semantic attention[J]. Mathematical Biosciences and Engineering, 2022, 19(10): 10192-10212. doi: 10.3934/mbe.2022478
Medical visual question answering (Med-VQA) aims to leverage a pre-trained artificial intelligence model to answer clinical questions raised by doctors or patients regarding radiology images. However, owing to the high professional requirements in the medical field and the difficulty of annotating medical data, Med-VQA lacks sufficient large-scale, well-annotated radiology images for training. Researchers have mainly focused on improving the ability of the model's visual feature extractor to address this problem. However, there are few researches focused on the textual feature extraction, and most of them underestimated the interactions between corresponding visual and textual features. In this study, we propose a corresponding feature fusion (CFF) method to strengthen the interactions of specific features from corresponding radiology images and questions. In addition, we designed a semantic attention (SA) module for textual feature extraction. This helps the model consciously focus on the meaningful words in various questions while reducing the attention spent on insignificant information. Extensive experiments demonstrate that the proposed method can achieve competitive results in two benchmark datasets and outperform existing state-of-the-art methods on answer prediction accuracy. Experimental results also prove that our model is capable of semantic understanding during answer prediction, which has certain advantages in Med-VQA.

| [1] |
Z. Chen, X. Guo, P. Y. M. Woo, Y. Yuan, Super-resolution enhanced medical image diagnosis with sample affinity interaction, IEEE Trans. Med. Imaging, 40 (2021), 1377-1389. https://doi.org/10.1016/j.media.2020.101839 doi: 10.1016/j.media.2020.101839

|
| [2] |
W. A. Al, I. D. Yun, Partial policy-based reinforcement learning for anatomical landmark localization in 3d medical images, IEEE Trans. Med. Imaging, 39 (2019), 1245-1255. https://doi.org/10.1109/TMI.2019.2946345 doi: 10.1109/TMI.2019.2946345
|
| [3] | A. Jungo, R. Meier, E. Ermis, M. Blatti-Moreno, E. Herrmann, R. Wiest, et al., On the effect of inter-observer variability for a reliable estimation of uncertainty of medical image segmentation, in International Conference on Medical Image Computing and Computer-Assisted Intervention, (2018), 682-690. https://doi.org/10.1007/978-3-030-00928-1_77 |
| [4] |
Y. Tang, Y. Tang, Y. Zhu, J. Xiao, R. M. Summers, A disentangled generative model for disease decomposition in chest x-rays via normal image synthesis, Med. Image Anal., 67 (2021), 101839. https://doi.org/10.1016/j.media.2020.101839 doi: 10.1016/j.media.2020.101839
|
| [5] |
H. Abdeltawab, F. Khalifa, F. Taher, N. S. Alghamdi, M. Ghazal, G. Beache, et al., A deep learning-based approach for automatic segmentation and quantification of the left ventricle from cardiac cine MR images, Comput. Med. Imaging Graphics, 81 (2020), 101717. https://doi.org/10.1016/j.compmedimag.2020.101717 doi: 10.1016/j.compmedimag.2020.101717
|
| [6] |
J. Ker, L. Wang, J. Rao, T. Lim, Deep learning applications in medical image analysis, IEEE Access, 6 (2017), 9375-9389. https://doi.org/10.1109/ACCESS.2017.2788044 doi: 10.1109/ACCESS.2017.2788044
|
| [7] |
X. Xie, J. Niu, X. Liu, Z. Chen, S. Tang, S. Yu, A survey on incorporating domain knowledge into deep learning for medical image analysis, Med. Image Anal., 69 (2021), 101985. https://doi.org/10.1016/j.media.2021.101985 doi: 10.1016/j.media.2021.101985
|
| [8] |
C. Li, G. Zhu, X. Wu, Y. Wang, False-positive reduction on lung nodules detection in chest radiographs by ensemble of convolutional neural networks, IEEE Access, 6 (2018), 16060-16067. https://doi.org/10.1109/ACCESS.2018.2817023 doi: 10.1109/ACCESS.2018.2817023
|
| [9] |
D. Bardou, K. Zhang, S. M. Ahmad, Classification of breast cancer based on histology images using convolutional neural networks, IEEE Access, 6 (2018), 24680-24693. https://doi.org/10.1109/ACCESS.2018.2831280 doi: 10.1109/ACCESS.2018.2831280
|
| [10] | S. Antol, A. Agrawal, J. Lu, M. Mitchell, D. Batra, C. L. Zitnick, et al., Vqa: Visual question answering, in IEEE International Conference on Computer Vision, (2015), 2425-2433. https://doi.org/10.1109/ICCV.2015.279 |
| [11] | P. Gao, H. You, Z. Zhang, X. Wang, H. Li, Multi-modality latent interaction network for visual question answering, in IEEE/CVF International Conference on Computer Vision, (2019), 5825-5835. https://doi.org/10.1109/ICCV.2019.00592 |
| [12] | Z. Yu, J. Yu, Y. Cui, D. Tao, Q. Tian, Deep modular co-attention networks for visual question answering, in IEEE/CVF Conference on Computer Vision and Pattern Recognition, (2019), 6274-6283. https://doi.org/10.1109/CVPR.2019.00644 |
| [13] | M. Malinowski, M. Fritz, A multi-world approach to question answering about real-world scenes based on uncertain input, Adv. Neural Inf. Proces. Syst., 2014 (2014), 1682-1690. |
| [14] | M. Ren, R. Kiros, R. Zemel, Exploring models and data for image question answering, Adv. Neural Inf. Proces. Syst., 2015 (2015), 2953-2961. |
| [15] |
R. Krishna, Y. Zhu, O. Groth, J. Johnson, K. Hata, J. Kravitz, et al., Visual genome: Connecting language and vision using crowdsourced dense image annotations, Int. J. Comput. Vision, 123 (2017), 32-73. https://doi.org/10.1007/s11263-016-0981-7 doi: 10.1007/s11263-016-0981-7
|
| [16] | Y. Zhu, O. Groth, M. Bernstein, F. Li, Visual7w: Grounded question answering in images, in IEEE Conference on Computer Vision and Pattern Recognition, (2016), 4995-5004. https://doi.org/10.1109/CVPR.2016.540 |
| [17] | Y. Goyal, T. Khot, D. Summers-Stay, D. Batra, D. Parikh, Making the V in VQA matter: Elevating the role of image understanding in Visual Question Answering, in IEEE Conference on Computer Vision and Pattern Recognition, (2017), 6904-6913. https://doi.org/10.1007/s11263-018-1116-0 |
| [18] | B. Ionescu, H. Müller, R. Péteri, A. B. Abacha, M. Sarrouti, D. Demner-Fushman et al., Overview of the ImageCLEF 2021: Multimedia retrieval in medical, nature, internet and social media applications, in International Conference of the Cross-Language Evaluation Forum for European Languages, Springer, Cham, (2021), 345-370. https://doi.org/10.1007/978-3-030-85251-1_23 |
| [19] |
J. J. Lau, S. Gayen, A. B. Abacha, D. Demner-Fushman, A dataset of clinically generated visual questions and answers about radiology images, Sci. Data, 5 (2018), 180251. https://doi.org/10.1038/sdata.2018.251 doi: 10.1038/sdata.2018.251
|
| [20] | B. Liu, L. M. Zhan, L. Xu, L. Ma, Y. Yang, X. Wu, SLAKE: A semantically-labeled knowledge-enhanced dataset for medical visual question answering, in IEEE International Symposium on Biomedical Imaging, (2021), 1650-1654. https://doi.org/10.1109/ISBI48211.2021.9434010 |
| [21] | A. B. Abacha, S. Gayen, J. J. Lau, S. Rajaraman, D. Demner-Fushman, NLM at ImageCLEF 2018 visual question answering in the medical domain, in Working Notes of CLEF, (2018). |
| [22] | K. He, X. Zhang, S. Ren, J. Sun, Deep residual learning for image recognition, in IEEE Conference on Computer Vision and Pattern Recognition, (2016), 770-778. https://doi.org/10.1109/CVPR.2016.90 |
| [23] | I. Allaouzi, M. B. Ahmed, B. Benamrou, An encoder-decoder model for visual question answering in the medical domain, in Working Notes of CLEF, (2019). |
| [24] | B. Liu, L. Zhan, X. Wu, Contrastive pre-training and representation distillation for medical visual question answering based on radiology images, in International Conference on Medical Image Computing and Computer-Assisted Intervention, (2021), 210-220. https://doi.org/10.1007/978-3-030-87196-3_20 |
| [25] | H. Gong, G. Chen, S. Liu, Y. Yu, G. Li, Cross-modal self-attention with multi-task pre-training for medical visual question answering, in International Conference on Multimedia, (2021), 21-24. https://doi.org/10.1145/3460426.3463584 |
| [26] |
S. Liu, X. Zhang, X. Zhou, J. Yang, BPI-MVQA: a bi-branch model for medical visual question answering, BMC Med. Imaging, 22 (2022), 79. https://doi.org/10.1186/s12880-022-00800-x doi: 10.1186/s12880-022-00800-x
|
| [27] | U. Naseem, M. Khushi, J. Kim, Vision-language transformer for interpretable pathology visual question answering, IEEE J. Biomed. Health Inf., (2022), forthcoming 2022. https://doi.org/10.1109/JBHI.2022.3163751 |
| [28] | J. Li, S. Liu, Lijie at imageclefmed vqa-med 2021: Attention model based on efficient interaction between multimodality, in Working Notes of CLEF, (2021), 1275-1284. |
| [29] | Q. Xiao, X. Zhou, Y. Xiao, K. Zhao, Yunnan university at vqa-med 2021: Pretrained biobert for medical domain visual question answering, in Working Notes of CLEF, (2021), 1405-1411. |
| [30] | N. M. S. Sitara, K. Srinivasan, SSN MLRG at VQA-MED 2021: An approach for VQA to solve abnormality related queries using improved datasets, in Working Notes of CLEF, (2021), 1329-1335. |
| [31] | H. Gong, R. Huang, G. Chen, G. Li, et al., Sysu-hcp at vqa-med 2021: A data-centric model with efficient training methodology for medical visual question answering, in CEUR Workshop Proceedings, (2021), 1613. |
| [32] | Y. Li, Z. Yang, T. Hao, Tam at vqa-med 2021: A hybrid model with feature extraction and fusion for medical visual question answering, in Working Notes of CLEF, (2021), 1295-1304. |
| [33] | A. Al-Sadi, H. A. Al-Theiabat, M. Al-Ayyoub, The inception team at VQA-Med 2020: Pretrained VGG with data augmentation for medical VQA and VQG, in Working Notes of CLEF, (2020). |
| [34] |
K. Gasmi, Hybrid deep learning model for answering visual medical questions, Supercomput., 2022 (2022), 1-18. https://doi.org/10.1007/s11227-022-04474-8 doi: 10.1007/s11227-022-04474-8
|
| [35] | Z. Liao, Q. Wu, C. Shen, A. Van Den Hengel, J. Verjans, AIML at VQA-Med 2020: Knowledge inference via a skeleton-based sentence mapping approach for medical domain visual question answering, in Working Notes of CLEF, (2020). |
| [36] |
S. Hochreiter, J. Schmidhuber, Long short-term memory, Neural Comput., 9 (1997), 1735-1780. https://doi.org/10.1162/neco.1997.9.8.1735 doi: 10.1162/neco.1997.9.8.1735
|
| [37] | K. Cho, B. van Merrienboer, C. Gulcehre, D. Bahdanau, F. Bougares, H. Schwenk, et al., Learning phrase representations using RNN encoder-decoder for statistical machine translation, preprint, arXiv: 1406.1078. |
| [38] | J. Devlin, M. V. Chang, K. Lee, K. B. Toutanova, BERT: Pre-training of deep bidirectional transformers for language understanding, in Proceedings of the 2019 Conference of the North American Chapter of the Association for Computational Linguistics: Human Language Technologies, (2019), 4171-4186. https://doi.org/10.18653/v1/N19-1423 |
| [39] |
J. Lee, W. Yoon, S. Kim, D. Kim, S. Kim, C. So, et al., BioBERT: a pre-trained biomedical language representation model for biomedical text mining, Bioinformatics, 36 (2020), 1234-1240. https://doi.org/10.1093/bioinformatics/btz682 doi: 10.1093/bioinformatics/btz682
|
| [40] | Z. Yang, X. He, J. Gao, L. Deng, A. Smola, Stacked attention networks for image question answering, in IEEE conference on computer vision and pattern recognition, (2016), 21-29. https://doi.org/10.1109/CVPR.2016.10 |
| [41] | J. H. Kim, J. Jun, B. T. Zhang, Bilinear attention networks, Adv. Neural Inf. Process. Syst., 31 (2018), 1571-1581. |
| [42] | A. Fukui, D. H. Park, D. Yang, A. Rohrbach, T. Darrell, M. Rohrbach, Multimodal compact bilinear pooling for visual question answering and visual grounding, preprint, arXiv: 1606.01847. |
| [43] | B. D. Nguyen, T. T. Do, B. X. Nguyen, T. Do, E. Tjiputra, Q. D. Tran, Overcoming data limitation in medical visual question answering, in Medical Image Computing and Computer-Assisted Intervention, Springer, Cham, (2019), 522-530. https://doi.org/10.1007/978-3-030-32251-9_57 |
| [44] | C. Finn, P. Abbeel, S. Levine, Model-agnostic meta-learning for fast adaptation of deep networks, in Proceedings of the 34th International Conference on Machine Learning, (2017), 1126-1135. |
| [45] | J. Masci, U. Meier, D. Cireşan, J. Schmidhuber, Stacked convolutional auto-encoders for hierarchical feature extraction, in International conference on artificial neural networks, (2011), 52-59. https://doi.org/10.1007/978-3-642-21735-7_7 |
| [46] | L. Zhan, B. Liu, L. Fan, J. Chen, X. Wu, Medical visual question answering via conditional reasoning, in The 28th ACM International Conference on Multimedia, (2020), 2345-2354. https://doi.org/10.1145/3394171.3413761 |
| [47] | Y. Khare, V. Bagal, M. Mathew, A. Devi, U. D. Priyakumar, C. V. Jawahar, MMBERT: Multimodal BERT pretraining for improved medical VQA, in IEEE 18th International Symposium on Biomedical Imaging, (2021), 1033-1036. https://doi.org/10.1109/ISBI48211.2021.9434063 |
| [48] | T. Do, B. X. Nguyen, E. Tjiputra, M. Tran, Q. D. Tran, A. Nguyen, Multiple meta-model quantifying for medical visual question answering, in Medical Image Computing and Computer Assisted Intervention, (2021), 64-74. https://doi.org/10.1007/978-3-030-87240-3_7 |
| [49] | S. Gururangan, A. Marasović, S. Swayamdipta, K. Lo, I. Beltagy, D. Downey, et al., Don't stop pretraining: Adapt language models to domains and tasks, preprint, arXiv: 2004.10964. |
| [50] | J. Irvin, P. Rajpurkar, M. Ko, Y. Yu, S. Ciurea-Ilcus, C. Chute, et al., Chexpert: A large chest radiograph dataset with uncertainty labels and expert comparison, in Proceedings of the AAAI Conference on Artificial Intelligence, (2019), 590-597. https://doi.org/10.1609/aaai.v33i01.3301590 |
| [51] | J. Cheng, Brain tumor dataset, Figshare Datasets, (2017). https://doi.org/10.6084/m9.figshare.1512427.v5 |
| [52] | Y. Zhang, Q. Chen, Z. Yang, H. Lin, Z. Lu, BioWordVec, improving biomedical word embeddings with subword information and MeSH, Sci. Data, 6 (2019), 52. https://doi.org/10.1038/s41597-019-0055-0 |
| [53] | J. Hu, L. Shen, G. Sun, Squeeze-and-excitation networks, in IEEE Conference on Computer Vision and Pattern Recognition, (2018), 7132-7141. https://doi.org/10.1109/CVPR.2018.00745 |
| [54] |
X. Wang, S. Zhao, B. Cheng, Y. Yin, H. Yang, Explore modeling relation information and direction information in KBQA, Neurocomputing, 471 (2022), 139-148. https://doi.org/10.1016/j.neucom.2021.10.094 doi: 10.1016/j.neucom.2021.10.094
|
| [55] |
M. Gao, J. Lu, F. Chen, Medical knowledge graph completion based on word embeddings, Information, 13 (2022), 205. https://doi.org/10.3390/info13040205 doi: 10.3390/info13040205
|
| [56] |
L. Liu, M. Wang, X. He, L. Qing, H. Chen, Fact-based visual question answering via dual-process system, Knowl. Based Syst., 237 (2022), 107650. https://doi.org/10.1016/j.knosys.2021.107650 doi: 10.1016/j.knosys.2021.107650
|


Figures(9) / Tables(4)

Han Zhu, Xiaohai He, Meiling Wang, Mozhi Zhang, Linbo Qing. Medical visual question answering via corresponding feature fusion combined with semantic attention[J]. Mathematical Biosciences and Engineering, 2022, 19(10): 10192-10212. doi: 10.3934/mbe.2022478


 DownLoad: