Most of the malignant melanomas are already in the middle and advanced stages when they are diagnosed, which is often accompanied by the metastasis and spread of other organs. Besides, the prognosis of patients is bleak. The characteristics of the local immune microenvironment in metastatic melanoma have important implications for both tumor progression and tumor treatment. In this study, data on patients with metastatic melanoma from the TCGA and GEO datasets were selected for immune, stromal, and estimate scores, and overlapping differentially expressed genes were screened. A nine-IRGs prognostic model (ALOX5AP, ARHGAP15, CCL8, FCER1G, GBP4, HCK, MMP9, RARRES2 and TRIM22) was established by univariate COX regression, LASSO and multivariate COX regression. Receiver operating characteristic curves were used to test the predictive accuracy of the model. Immune infiltration was analyzed by using CIBERSORT and Xcell in high-risk and low-risk groups. The immune infiltration of the high-risk group was significantly lower than that of the low-risk group. Immune checkpoint analysis revealed that the expression of PDCD1, CTLA4, TIGIT, CD274, HAVR2 and LAG3 demonstrated the visible difference in groups with different levels of risk scores. WGCNA analysis found that the yellow-green module contained seven genes from the nine-IRG prognostic model, and the yellow-green module had the highest correlation with risk scores. The results of GO and KEGG suggested that the genes in the yellow-green module were mainly enriched in immune-related biological processes. Finally, the expression characteristics of ALOX5AP, ARHGAP15, CCL8, FCER1G, GBP4, HCK, MMP9, RARRES2 and TRIM22 were analyzed between metastatic melanoma and normal samples. Overall, a prognostic model for metastatic melanoma based on the tumor immune microenvironment characteristics was established, which left plenty of space for further studies. It could function well in helping people to understand characteristics of the immune microenvironment in metastatic melanoma.
Citation: Jing Liu, Xuefang Zhang, Ting Ye, Yongjian Dong, Wenfeng Zhang, Fenglin Wu, Huaben Bo, Hongwei Shao, Rongxin Zhang, Han Shen. Prognostic modeling of patients with metastatic melanoma based on tumor immune microenvironment characteristics[J]. Mathematical Biosciences and Engineering, 2022, 19(2): 1448-1470. doi: 10.3934/mbe.2022067
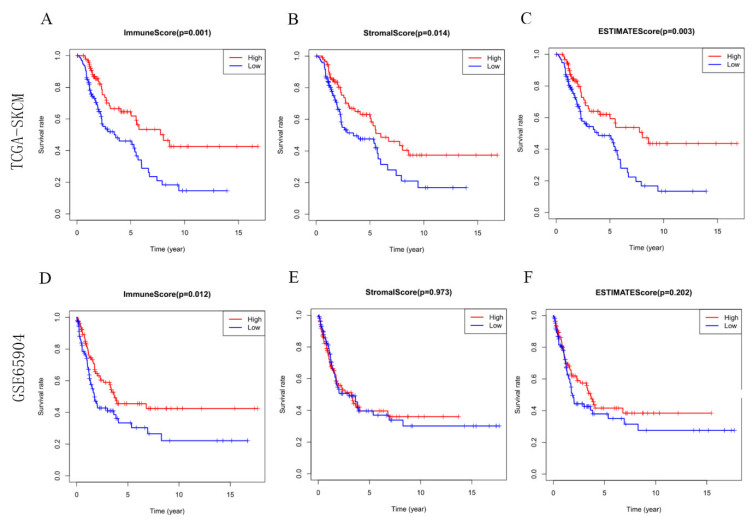
Most of the malignant melanomas are already in the middle and advanced stages when they are diagnosed, which is often accompanied by the metastasis and spread of other organs. Besides, the prognosis of patients is bleak. The characteristics of the local immune microenvironment in metastatic melanoma have important implications for both tumor progression and tumor treatment. In this study, data on patients with metastatic melanoma from the TCGA and GEO datasets were selected for immune, stromal, and estimate scores, and overlapping differentially expressed genes were screened. A nine-IRGs prognostic model (ALOX5AP, ARHGAP15, CCL8, FCER1G, GBP4, HCK, MMP9, RARRES2 and TRIM22) was established by univariate COX regression, LASSO and multivariate COX regression. Receiver operating characteristic curves were used to test the predictive accuracy of the model. Immune infiltration was analyzed by using CIBERSORT and Xcell in high-risk and low-risk groups. The immune infiltration of the high-risk group was significantly lower than that of the low-risk group. Immune checkpoint analysis revealed that the expression of PDCD1, CTLA4, TIGIT, CD274, HAVR2 and LAG3 demonstrated the visible difference in groups with different levels of risk scores. WGCNA analysis found that the yellow-green module contained seven genes from the nine-IRG prognostic model, and the yellow-green module had the highest correlation with risk scores. The results of GO and KEGG suggested that the genes in the yellow-green module were mainly enriched in immune-related biological processes. Finally, the expression characteristics of ALOX5AP, ARHGAP15, CCL8, FCER1G, GBP4, HCK, MMP9, RARRES2 and TRIM22 were analyzed between metastatic melanoma and normal samples. Overall, a prognostic model for metastatic melanoma based on the tumor immune microenvironment characteristics was established, which left plenty of space for further studies. It could function well in helping people to understand characteristics of the immune microenvironment in metastatic melanoma.

| [1] |
X. Li, Z. Li, X. Li, B. Liu, Z. Liu, Mechanisms of Tanshinone Ⅱ a inhibits malignant melanoma development through blocking autophagy signal transduction in A375 cell, BMC Cancer, 17 (2017), 357. doi: 10.1186/s12885-017-3329-y. doi: 10.1186/s12885-017-3329-y

|
| [2] | Y. Si, A. Lin, W. Ding, H. Meng, P. Luo, J. Zhang, CARD11 alteration as a candidate biomarker of skin cutaneous melanoma treated with immune checkpoint blockade, Am. J. Transl. Res., 13 (2021). |
| [3] |
C. Trojaniello, J. J. Luke, P. A. Ascierto, Therapeutic advancements across clinical stages in melanoma, with a focus on targeted immunotherapy, Front. Oncol., 11 (2021), 670726. doi: 10.3389/fonc.2021.670726l. doi: 10.3389/fonc.2021.670726l
|
| [4] |
L. Tonella, V. Pala, R. Ponti, M. Rubatto, G. Gallo, L. Mastorino, et al., Prognostic and predictive biomarkers in stage Ⅲ melanoma: current insights and clinical implications, Int. J. Mol. Sci., 22 (2021). doi: 10.3390/ijms22094561. doi: 10.3390/ijms22094561
|
| [5] |
A. Villani, M. Scalvenzi, G. Fabbrocini, J. Ocampo-Candiani, S. S. Ocampo-Garza, Looking into a better future: novel therapies for metastatic melanoma, Dermatol. Ther. (Heidelb), 11 (2021), 751-767. doi: 10.1007/s13555-021-00525-9. doi: 10.1007/s13555-021-00525-9
|
| [6] |
F. Valenti, I. Falcone, S. Ungania, F. Desiderio, P. Giacomini, C. Bazzichetto, et al., Precision medicine and melanoma: multi-omics approaches to monitoring the immunotherapy response, Int. J. Mol. Sci., 22 (2021). doi: 10.3390/ijms22083837. doi: 10.3390/ijms22083837
|
| [7] |
S. Upadhrasta, L. Zheng, Strategies in developing immunotherapy for pancreatic cancer: recognizing and correcting multiple immune "Defects" in the tumor microenvironment, J. Clin. Med., 8 (2019). doi: 10.3390/jcm8091472. doi: 10.3390/jcm8091472
|
| [8] |
E. N. Scott, A. M. Gocher, C. J. Workman, D. A. A. Vignali, Regulatory T cells: Barriers of immune infiltration into the tumor microenvironment, Front. Immunol., 12 (2021), 702726. doi: 10.3389/fimmu.2021.702726. doi: 10.3389/fimmu.2021.702726
|
| [9] |
A. Pasetto, Y. C. Lu, Single-cell TCR and transcriptome analysis: An indispensable tool for studying T-cell biology and cancer immunotherapy, Front. Immunol., 12 (2021), 689091. doi: 10.3389/fimmu.2021.689091. doi: 10.3389/fimmu.2021.689091
|
| [10] |
P. F. Ferrucci, L. Pala, F. Conforti, E. Cocorocchio, Talimogene laherparepvec (T-VEC): An intralesional cancer immunotherapy for advanced melanoma, Cancers (Basel), 13 (2021). doi: 10.3390/cancers13061383. doi: 10.3390/cancers13061383
|
| [11] |
L. Peng, Z. Chen, Y. Chen, X. Wang, N. Tang, MIR155HG is a prognostic biomarker and associated with immune infiltration and immune checkpoint molecules expression in multiple cancers, Cancer Med., 8 (2019), 7161-7173. doi: 10.1002/cam4.2583. doi: 10.1002/cam4.2583
|
| [12] |
T. Adam, T. M. Becker, W. Chua, V. Bray, T. L. Roberts, The multiple potential biomarkers for predicting immunotherapy response-finding the needle in the haystack, Cancers (Basel), 13 (2021). doi: 10.3390/cancers13020277. doi: 10.3390/cancers13020277
|
| [13] |
B. Hu, Q. Wei, X. Li, M. Ju, L. Wang, C. Zhou, et al., Development of an IFNgamma response-related signature for predicting the survival of cutaneous melanoma, Cancer Med., 9 (2020), 8186-8201. doi: 10.1002/cam4.3438. doi: 10.1002/cam4.3438
|
| [14] |
H. Ying, A. Lin, J. Liang, J. Zhang, P. Luo, Association between FSIP2 mutation and an improved efficacy of immune checkpoint inhibitors in patients with skin cutaneous melanoma, Front. Mol. Biosci., 8 (2021), 629330. doi: 10.3389/fmolb.2021.629330. doi: 10.3389/fmolb.2021.629330
|
| [15] |
F. Gómez-Valenzuela, E. Escobar, R. Pérez-Tomás, V. P. Montecinos, The inflammatory profile of the tumor microenvironment, orchestrated by cyclooxygenase-2, promotes epithelial-mesenchymal transition, Front. Oncol., 11 (2021). doi: 10.3389/fonc.2021.686792. doi: 10.3389/fonc.2021.686792
|
| [16] |
M. Kakarla, S. ChallaSivaKanaka, S. W. Hayward, O. E. Franco, Race as a Contributor to Stromal Modulation of Tumor Progression, Cancers (Basel), 13 (2021). doi: 10.3390/cancers13112656. doi: 10.3390/cancers13112656
|
| [17] |
X. Huang, F. Zhang, D. He, X. Ji, J. Gao, W. Liu, et al., Immune-Related Gene SERPINE1 Is a Novel Biomarker for Diffuse Lower-Grade Gliomas via Large-Scale Analysis, Front. Oncol., 11 (2021), 646060. doi: 10.3389/fonc.2021.646060. doi: 10.3389/fonc.2021.646060
|
| [18] |
V. Romano, I. Belviso, A. Venuta, M. R. Ruocco, S. Masone, F. Aliotta, et al., Influence of tumor microenvironment and fibroblast population plasticity on melanoma growth, therapy resistance and immunoescape, Int. J. Mol. Sci., 22 (2021). doi: 10.3390/ijms22105283. doi: 10.3390/ijms22105283
|
| [19] |
J. Zhang, J. Zhang, C. Yuan, Y. Luo, Y. Li, P. Dai, et al., Establishment of the prognostic index of lung squamous cell carcinoma based on immunogenomic landscape analysis, Cancer Cell Int., 20 (2020), 330. doi: 10.1186/s12935-020-01429-y. doi: 10.1186/s12935-020-01429-y
|
| [20] |
B. Hu, Q. Wei, C. Zhou, M. Ju, L. Wang, L. Chen, et al., Analysis of immune subtypes based on immunogenomic profiling identifies prognostic signature for cutaneous melanoma, Int. Immunopharmacol., 89 (2020). doi: 10.1016/j.intimp.2020.107162. doi: 10.1016/j.intimp.2020.107162
|
| [21] |
W. Y. Cai, Z. N. Dong, X. T. Fu, L. Y. Lin, L. Wang, G. D. Ye, et al., Identification of a tumor microenvironment-relevant gene set-based prognostic signature and related therapy targets in gastric cancer, Theranostics, 10 (2020), 8633-8647. doi: 10.7150/thno.47938. doi: 10.7150/thno.47938
|
| [22] |
Y. Mei, M. M. Chen, H. Liang, L. Ma, A four-gene signature predicts survival and anti-CTLA4 immunotherapeutic responses based on immune classification of melanoma, Commun. Biol., 4 (2021), 383. doi: 10.1038/s42003-021-01911-x. doi: 10.1038/s42003-021-01911-x
|
| [23] |
Z. Yang, X. Liang, Y. Fu, Y. Liu, L. Zheng, F. Liu, et al., Identification of AUNIP as a candidate diagnostic and prognostic biomarker for oral squamous cell carcinoma, EBioMedicine, 47 (2019), 44-57. doi: 10.1016/j.ebiom.2019.08.013. doi: 10.1016/j.ebiom.2019.08.013
|
| [24] |
I. Falcone, F. Conciatori, C. Bazzichetto, G. Ferretti, F. Cognetti, L. Ciuffreda, et al., Tumor microenvironment: Implications in melanoma resistance to targeted therapy and immunotherapy, Cancers (Basel), 12 (2020). doi: 10.3390/cancers12102870. doi: 10.3390/cancers12102870
|
| [25] |
C. M. Balch, Revolutionary Advances in Immunotherapy for Melanoma Are Coming into the Surgical Arena: Are We Ready?, Ann. Surg. Oncol., 25 (2018), 1803-1806. doi: 10.1245/s10434-018-6516-4. doi: 10.1245/s10434-018-6516-4
|
| [26] |
L. B. Song, J. C. Luan, Q. J. Zhang, L. Chen, H. Y. Wang, X. C. Cao, et al., The identification and validation of a robust immune-associated gene signature in cutaneous melanoma, J. Immunol. Res., 2021 (2021), 6686284. doi: 10.1155/2021/6686284. doi: 10.1155/2021/6686284
|
| [27] |
V. Petrova, I. Arkhypov, R. Weber, C. Groth, P. Altevogt, J. Utikal, et al., Modern aspects of immunotherapy with checkpoint inhibitors in melanoma, Int. J. Mol. Sci., 21 (2020). doi: 10.3390/ijms21072367. doi: 10.3390/ijms21072367
|
| [28] |
C. Ceci, M. G. Atzori, P. M. Lacal, G. Graziani, Targeting tumor-associated macrophages to increase the efficacy of immune checkpoint inhibitors: A glimpse into novel therapeutic approaches for metastatic melanoma, Cancers (Basel), 12 (2020). doi: 10.3390/cancers12113401. doi: 10.3390/cancers12113401
|
| [29] |
N. M. Ratnam, S. C. Frederico, J. A. Gonzalez, M. R. Gilbert, Clinical correlates for immune checkpoint therapy: significance for CNS malignancies, Neurooncol. Adv., 3 (2021), 161. doi: 10.1093/noajnl/vdaa161. doi: 10.1093/noajnl/vdaa161
|
| [30] |
T. U. Marron, A. E. Ryan, S. M. Reddy, S. Kaczanowska, R. H. Younis, D. Thakkar, et al., Considerations for treatment duration in responders to immune checkpoint inhibitors, J. Immunother. Cancer, 9 (2021). doi: 10.1136/jitc-2020-001901. doi: 10.1136/jitc-2020-001901
|
| [31] |
J. Han, X. Xu, Z. Liu, Z. Li, Y. Wu, D. Zuo, Recent advances of molecular mechanisms of regulating PD-L1 expression in melanoma, Int. Immunopharmacol., 88 (2020), 106971. doi: 10.1016/j.intimp.2020.106971. doi: 10.1016/j.intimp.2020.106971
|
| [32] |
S. Bagchi, R. Yuan, E. G. Engleman, Immune checkpoint inhibitors for the treatment of cancer: clinical impact and mechanisms of response and resistance, Annu. Rev. Pathol., 16 (2021), 223-249. doi: 10.1146/annurev-pathol-042020-042741. doi: 10.1146/annurev-pathol-042020-042741
|


Figures(12)

Jing Liu, Xuefang Zhang, Ting Ye, Yongjian Dong, Wenfeng Zhang, Fenglin Wu, Huaben Bo, Hongwei Shao, Rongxin Zhang, Han Shen. Prognostic modeling of patients with metastatic melanoma based on tumor immune microenvironment characteristics[J]. Mathematical Biosciences and Engineering, 2022, 19(2): 1448-1470. doi: 10.3934/mbe.2022067


 DownLoad: