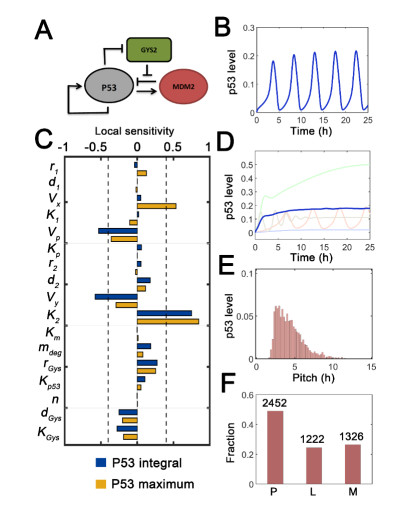
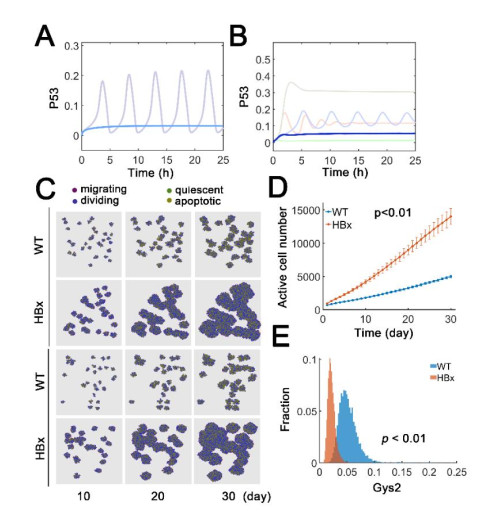
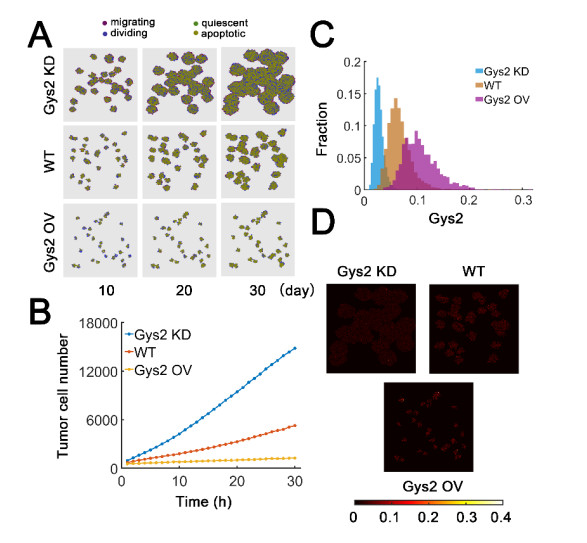
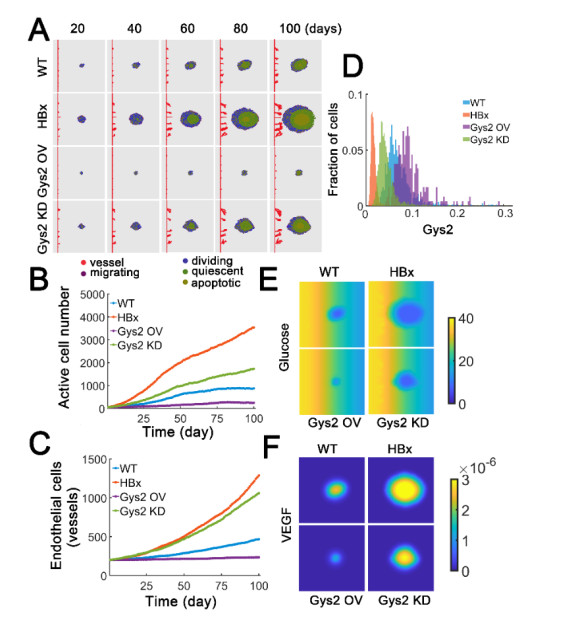
The transcription factor p53 is a tumor suppressor and strictly controlled p53 protein abundance coordinates cellular outcomes in response to various stresses. The glycogen synthase 2 (Gys2) and p53 generates a novel negative feedback circuit in which p53 represses Gys2 expression whereas Gys2 can stabilize p53 by competitive binding with MDM2. However, the dynamic role of p53-Gys2 negative feedback is still elusive. In current work, we recapitulated the main experimental findings using multi-scale modeling and emphasized the pivotal role of p53-Gys2 negative feedback loop to main cellular homeostasis. The multi-scale modeling strategy was used to simulate both in vitro and in vivo experimental findings. We found that expression of a key oncoprotein HBx may facilitate cancer progression. Gys2 overexpression can inhibit hepatocellular carcinoma progression whereas Gys2 knockdown advanced cancer development. We also applied oscillatory and impulse disturbance to p53 signaling pathway and the results showed that optimal p53-Gys2 negative feedback loop was highly resistant to oscillatory or impulse disturbances. Instead, the canonical p53-MDM2 negative feedback circuit can significantly affect the dynamics of p53 and therefore effectively shaped pulsatile patterns. Therefore, the dual negative feedback loops in p53 signaling can provide features of both robustness and tunability. These dynamic features are critical for cellular homeostasis against tumor progression in p53 signaling pathway.
Citation: Tingzhe Sun, Dan Mu. Multi-scale modeling identifies the role of p53-Gys2 negative feedback loop in cellular homeostasis[J]. Mathematical Biosciences and Engineering, 2020, 17(4): 3260-3273. doi: 10.3934/mbe.2020186
The transcription factor p53 is a tumor suppressor and strictly controlled p53 protein abundance coordinates cellular outcomes in response to various stresses. The glycogen synthase 2 (Gys2) and p53 generates a novel negative feedback circuit in which p53 represses Gys2 expression whereas Gys2 can stabilize p53 by competitive binding with MDM2. However, the dynamic role of p53-Gys2 negative feedback is still elusive. In current work, we recapitulated the main experimental findings using multi-scale modeling and emphasized the pivotal role of p53-Gys2 negative feedback loop to main cellular homeostasis. The multi-scale modeling strategy was used to simulate both in vitro and in vivo experimental findings. We found that expression of a key oncoprotein HBx may facilitate cancer progression. Gys2 overexpression can inhibit hepatocellular carcinoma progression whereas Gys2 knockdown advanced cancer development. We also applied oscillatory and impulse disturbance to p53 signaling pathway and the results showed that optimal p53-Gys2 negative feedback loop was highly resistant to oscillatory or impulse disturbances. Instead, the canonical p53-MDM2 negative feedback circuit can significantly affect the dynamics of p53 and therefore effectively shaped pulsatile patterns. Therefore, the dual negative feedback loops in p53 signaling can provide features of both robustness and tunability. These dynamic features are critical for cellular homeostasis against tumor progression in p53 signaling pathway.

| [1] |
E. Batchelor, A. Loewer, G. Lahav, The ups and downs of p53: Understanding protein dynamics in single cells, Nat. Rev. Cancer, 9 (2009), 371-377. doi: 10.1038/nrc2604

|
| [2] |
R. E. Lee, S. R. Walker, K. Savery, D. A. Frank, S. Gaudet, Fold change of nuclear NF-kappaB determines TNF-induced transcription in single cells, Mol. Cell, 53 (2014), 867-879. doi: 10.1016/j.molcel.2014.01.026
|
| [3] |
Y. Muta, Y. Fujita, K. Sumiyama, A. Sakurai, M. M. Taketo, T. Chiba, et al., Composite regulation of ERK activity dynamics underlying tumour-specific traits in the intestine, Nat. Commun., 9 (2018), 2174. doi: 10.1038/s41467-018-04527-8
|
| [4] |
J. E. Purvis, K. W. Karhohs, C. Mock, E. Batchelor, p53 dynamics control cell fate, Science, 336 (2012), 1440-1444. doi: 10.1126/science.1218351
|
| [5] |
J. J. Tyson, K. C. Chen, B. Novak, Sniffers, buzzers, toggles and blinkers: Dynamics of regulatory and signaling pathways in the cell, Curr. Opin. Cell. Biol., 15 (2003), 221-231. doi: 10.1016/S0955-0674(03)00017-6
|
| [6] |
A. C. Joerger, A. R. Fersht, The p53 Pathway: Origins, Inactivation in cancer, and emerging therapeutic approaches, Ann. Rev. Biochem., 85 (2016), 375-404. doi: 10.1146/annurev-biochem-060815-014710
|
| [7] |
Q. Tang, Z. Su, W. Gu, A. K. Rustgi, Mutant p53 on the Path to Metastasis, Trends Cancer, 6 (2020), 62-73. doi: 10.1016/j.trecan.2019.11.004
|
| [8] |
J. Momand, G. P. Zambetti, D. C. Olson, D. George, A. J. Levine, The mdm-2 oncogene product forms a complex with the p53 protein and inhibits p53-mediated transactivation, Cell, 69 (1992), 1237-1245. doi: 10.1016/0092-8674(92)90644-R
|
| [9] |
X. Wu, J. H. Bayle, D. Olson, A. J. Levine, The p53-mdm-2 autoregulatory feedback loop, Genes Dev., 7 (1993), 1126-1132. doi: 10.1101/gad.7.7a.1126
|
| [10] |
R. Yang, B. Huang, Y. Zhu, Y. Li, F. Liu, J. Shi, Cell type-dependent bimodal p53 activation engenders a dynamic mechanism of chemoresistance, Sci. Adv., 4 (2018), eaat5077. doi: 10.1126/sciadv.aat5077
|
| [11] | N. Geva-Zatorsky, N. Rosenfeld, S. Itzkovitz, R. Milo, A. Sigal, E. Dekel, et al., Oscillations and variability in the p53 system, Mol. Syst. Biol., 2 (2006), 2006.0033. |
| [12] |
S. L. Chen, C. Z. Zhang, L. L. Liu, S. X. Lu, Y. H. Pan, C. H. Wang, et al., A GYS2/p53 Negative Feedback Loop Restricts Tumor Growth in HBV-Related Hepatocellular Carcinoma, Cancer Res., 79 (2019), 534-545. doi: 10.1158/0008-5472.CAN-18-2357
|
| [13] |
E. Favaro, K. Bensaad, M. G. Chong, D. A. Tennant, D. J. Ferguson, C. Snell, et al., Glucose utilization via glycogen phosphorylase sustains proliferation and prevents premature senescence in cancer cells, Cell Metab., 16 (2012), 751-764. doi: 10.1016/j.cmet.2012.10.017
|
| [14] |
B. C. Lewis, D. S. Klimstra, N. D. Socci, S. Xu, J. A. Koutcher, H. E. Varmus, The absence of p53 promotes metastasis in a novel somatic mouse model for hepatocellular carcinoma, Mol. Cell Biol., 25 (2005), 1228-1237. doi: 10.1128/MCB.25.4.1228-1237.2005
|
| [15] |
K. T. Bieging, S. S. Mello, L. D. Attardi, Unravelling mechanisms of p53-mediated tumour suppression, Nat. Rev. Cancer, 14 (2014), 359-370. doi: 10.1038/nrc3711
|
| [16] |
E. J. Hancock, J. Ang, A. Papachristodoulou, G. B. Stan, The interplay between feedback and buffering in cellular homeostasis, Cell Syst., 5 (2017), 498-508 e423. doi: 10.1016/j.cels.2017.09.013
|
| [17] |
Y. Ito, K. Uchida, Formulas for intrinsic noise evaluation in oscillatory genetic networks, J. Theor. Biol., 267 (2010), 223-234. doi: 10.1016/j.jtbi.2010.08.025
|
| [18] |
S. Bagga, S. Rawat, M. Ajenjo, M. J. Bouchard, Hepatitis B virus (HBV) X protein-mediated regulation of hepatocyte metabolic pathways affects viral replication, Virology, 498 (2016), 9-22. doi: 10.1016/j.virol.2016.08.006
|
| [19] |
M. Ghadiri, M. Heidari, S. A. Marashi, S. H. Mousavi, A multiscale agent-based framework integrated with a constraint-based metabolic network model of cancer for simulating avascular tumor growth, Mol. Biosyst., 13 (2017), 1888-1897. doi: 10.1039/C7MB00050B
|
| [20] |
M. S. Avendano, C. Leidy, J. M. Pedraza, Tuning the range and stability of multiple phenotypic states with coupled positive-negative feedback loops, Nat. Commun., 4 (2013), 2605. doi: 10.1038/ncomms3605
|
| [21] | J. Stewart-Ornstein, G. Lahav, p53 dynamics in response to DNA damage vary across cell lines and are shaped by efficiency of DNA repair and activity of the kinase ATM, Sci. Signal, 10 (2017). |
| [22] |
E. Batchelor, C. S. Mock, I. Bhan, A. Loewer, G. Lahav, Recurrent initiation: A mechanism for triggering p53 pulses in response to DNA damage, Mol. Cell., 30 (2008), 277-289. doi: 10.1016/j.molcel.2008.03.016
|
| [23] |
X. Lu, O. Ma, T. A. Nguyen, S. N. Jones, M. Oren, L. A. Donehower, The Wip1 Phosphatase acts as a gatekeeper in the p53-Mdm2 autoregulatory loop, Cancer Cell, 12 (2007), 342-354. doi: 10.1016/j.ccr.2007.08.033
|
| [24] |
H. Kitano, Biological robustness, Nat. Rev. Genet., 5 (2004), 826-837. doi: 10.1038/nrg1471
|
| [25] |
D. Kim, W. Kolch, K. H. Cho, Multiple roles of the NF-kappaB signaling pathway regulated by coupled negative feedback circuits, FASEB J., 23 (2009), 2796-2802. doi: 10.1096/fj.09-130369
|
| [26] |
B. L. Slagle, M. J. Bouchard, Role of HBx in hepatitis B virus persistence and its therapeutic implications, Curr. Opin. Virol., 30 (2018), 32-38. doi: 10.1016/j.coviro.2018.01.007
|
| [27] | K. Nikolaou, A. Tsagaratou, C. Eftychi, G. Kollias, G. Mosialos, I. Talianidis, Inactivation of the deubiquitinase CYLD in hepatocytes causes apoptosis, inflammation, fibrosis, and cancer, Cancer Cell, 21 (2012), 738-750. |
| [28] |
B. Z. Stanger, Cellular homeostasis and repair in the mammalian liver, Ann. Rev. Physiol., 77 (2015), 179-200. doi: 10.1146/annurev-physiol-021113-170255
|
| [29] |
M. Charni, R. Aloni-Grinstein, A. Molchadsky, V. Rotter, p53 on the crossroad between regeneration and cancer, Cell Death Differ., 24 (2017), 8-14. doi: 10.1038/cdd.2016.117
|
| [30] |
M. Schafer, S. Werner, Cancer as an overhealing wound: An old hypothesis revisited, Nat. Rev. Mol. Cell. Biol., 9 (2008), 628-638. doi: 10.1038/nrm2455
|
Figures(7)

Tingzhe Sun, Dan Mu. Multi-scale modeling identifies the role of p53-Gys2 negative feedback loop in cellular homeostasis[J]. Mathematical Biosciences and Engineering, 2020, 17(4): 3260-3273. doi: 10.3934/mbe.2020186


 DownLoad: