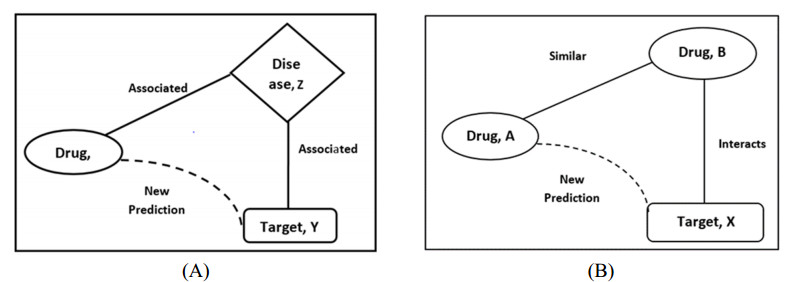
Motivation: In vitro experiment-based drug-target interaction (DTI) exploration demands more human, financial and data resources. In silico approaches have been recommended for predicting DTIs to reduce time and cost. During the drug development process, one can analyze the therapeutic effect of the drug for a particular disease by identifying how the drug binds to the target for treating that disease. Hence, DTI plays a major role in drug discovery. Many computational methods have been developed for DTI prediction. However, the existing methods have limitations in terms of capturing the interactions via multiple semantics between drug and target nodes in a heterogeneous biological network (HBN). Methods: In this paper, we propose a DTiGNN framework for identifying unknown drug-target pairs. The DTiGNN first calculates the similarity between the drug and target from multiple perspectives. Then, the features of drugs and targets from each perspective are learned separately by using a novel method termed an information entropy-based random walk. Next, all of the learned features from different perspectives are integrated into a single drug and target similarity network by using a multi-view convolutional neural network. Using the integrated similarity networks, drug interactions, drug-disease associations, protein interactions and protein-disease association, the HBN is constructed. Next, a novel embedding algorithm called a meta-graph guided graph neural network is used to learn the embedding of drugs and targets. Then, a convolutional neural network is employed to infer new DTIs after balancing the sample using oversampling techniques. Results: The DTiGNN is applied to various datasets, and the result shows better performance in terms of the area under receiver operating characteristic curve (AUC) and area under precision-recall curve (AUPR), with scores of 0.98 and 0.99, respectively. There are 23,739 newly predicted DTI pairs in total.
Citation: Saranya Muniyappan, Arockia Xavier Annie Rayan, Geetha Thekkumpurath Varrieth. DTiGNN: Learning drug-target embedding from a heterogeneous biological network based on a two-level attention-based graph neural network[J]. Mathematical Biosciences and Engineering, 2023, 20(5): 9530-9571. doi: 10.3934/mbe.2023419
Motivation: In vitro experiment-based drug-target interaction (DTI) exploration demands more human, financial and data resources. In silico approaches have been recommended for predicting DTIs to reduce time and cost. During the drug development process, one can analyze the therapeutic effect of the drug for a particular disease by identifying how the drug binds to the target for treating that disease. Hence, DTI plays a major role in drug discovery. Many computational methods have been developed for DTI prediction. However, the existing methods have limitations in terms of capturing the interactions via multiple semantics between drug and target nodes in a heterogeneous biological network (HBN). Methods: In this paper, we propose a DTiGNN framework for identifying unknown drug-target pairs. The DTiGNN first calculates the similarity between the drug and target from multiple perspectives. Then, the features of drugs and targets from each perspective are learned separately by using a novel method termed an information entropy-based random walk. Next, all of the learned features from different perspectives are integrated into a single drug and target similarity network by using a multi-view convolutional neural network. Using the integrated similarity networks, drug interactions, drug-disease associations, protein interactions and protein-disease association, the HBN is constructed. Next, a novel embedding algorithm called a meta-graph guided graph neural network is used to learn the embedding of drugs and targets. Then, a convolutional neural network is employed to infer new DTIs after balancing the sample using oversampling techniques. Results: The DTiGNN is applied to various datasets, and the result shows better performance in terms of the area under receiver operating characteristic curve (AUC) and area under precision-recall curve (AUPR), with scores of 0.98 and 0.99, respectively. There are 23,739 newly predicted DTI pairs in total.

| [1] |
J. A. DiMasi, R. W. Hansen, H. G. Grabowski, The price of innovation: new estimates of drug development costs, J Health Econ., 22 (2003), 151–185. https://doi.org/10.1016/s0167-6296(02)00126-1 doi: 10.1016/s0167-6296(02)00126-1

|
| [2] |
M. A. Yildirim, K. Goh, M. E. Cusick, A. Barabas, M. Vidal, Drug-target network, Nat. Biotechnol., 25 (2007), 1119–1126. https://doi.org/10.1038/nbt1338 doi: 10.1038/nbt1338
|
| [3] |
T. T. Ashburn, K. B. Thor, Drug repositioning: identifying and developing new uses for existing drugs, Nat. Rev. Drug Discov., 3 (2004), 673–683. https://doi.org/10.1038/nrd1468 doi: 10.1038/nrd1468
|
| [4] |
F. Cheng, C. Liu, J. Jiang, W. Lu, W. Li, G. Liu, et al., Prediction of drug-target interactions and drug repositioning via network-based inference, PLoS Comput. Biol., 8 (2012), 1002503. https://doi.org/10.1371/journal.pcbi.1002503 doi: 10.1371/journal.pcbi.1002503
|
| [5] |
Y. Yamanishi, M. Kotera, M. Kanehisa, S. Goto, Drug-target interaction prediction from chemical, genomic and pharmacological data in an integrated framework, Bioinformatics, 26 (2010), 246–254. https://doi.org/10.1093/bioinformatics/btq176 doi: 10.1093/bioinformatics/btq176
|
| [6] |
A. C. Cheng, R. G. Coleman, K. T. Smyth, Q. Cao, P. Soulard, D. R. Caffrey, et al., Structure-based maximal affinity model predicts small-molecule druggability, Nat. Biotechnol., 25 (2007), 71–75. https://doi.org/10.1038/nbt1273 doi: 10.1038/nbt1273
|
| [7] |
H. Alonso, A. A. Bliznyuk, J. E. Gready, Combining docking and molecular dynamic simulations in drug design, Med. Res. Rev., 26 (2006), 531–568. https://doi.org/10.1002/med.20067 doi: 10.1002/med.20067
|
| [8] |
K. Wang, J. Sun, S. Zhou, C. Wan, S. Qin, C. Li, et al., Prediction of drug–target interactions for drug repositioning only based on genomic expression similarity, PLoS Comput. Biol., 9 (2013), e1003315. https://doi.org/10.1371/journal.pcbi.1003315 doi: 10.1371/journal.pcbi.1003315
|
| [9] |
A.Tropsha, Best practices for QSAR model development, validation, and exploitation, Mol. Inform., 29(2010), 476–488. http://doi.org/10.1002/minf.201000061 doi: 10.1002/minf.201000061
|
| [10] |
D. Rognan, Chemogenomic approaches to rational drug design, Br. J. Pharmacol., 152 (2007), 38–52. https://doi.org/10.1038/sj.bjp.0707307 doi: 10.1038/sj.bjp.0707307
|
| [11] |
A. C. A. Nascimento, R. B. C. Prudêncio, I. G. Cost, A multiple kernel learning algorithm for drug-target interaction prediction, BMC Bioinformatics, 17 (2016), 1–16, https://doi.org/10.1186/s12859-016-0890-3 doi: 10.1186/s12859-016-0890-3
|
| [12] |
T. He, M. Heidemeyer, F. Ban, A. Cherkasov, M. Ester, SimBoost: a read-across approach for predicting drug–target binding affinities using gradient boosting machines, J. Cheminform., 9 (2017), 1–14. https://doi.org/10.1186/s13321-017-0209-z doi: 10.1186/s13321-017-0209-z
|
| [13] | K. Y. Gao, A. Fokoue, H. Luo, A. Iyengar, S. Dey, P. Zhang, Interpretable drug target prediction using deep neural representation, in IJCAI International Joint Conferences on Artificial Intelligence Organization, (2018), 3371–3377. https://doi.org/10.24963/ijcai.2018/468 |
| [14] |
M. Tsubaki, K. Tomii, J. Sese, Compound–protein interaction prediction with end-to-end learning of neural networks for graphs and sequences, Bioinformatics 35 (2019), 309–318. https://doi.org/10.1093/bioinformatics/bty535 doi: 10.1093/bioinformatics/bty535
|
| [15] |
Y. Luo, X. Zhao, J. Zhou, J. Yang, Y. Zhang, W. Kuang, et al., A network integration approach for drug-target interaction prediction and computational drug repositioning from heterogeneous information, Nat. Commun., 8 (2017), 573. https://doi.org/10.1038/s41467-017-00680-8 doi: 10.1038/s41467-017-00680-8
|
| [16] |
R. S. Olayan, H. Ashoor, V. B. Bajic, DDR: efficient computational method to predict drug–target interactions using graph mining and machine learning approaches, Bioinformatics, 34 (2018), 1164–1173. https://doi.org/10.1093/bioinformatics/btx731 doi: 10.1093/bioinformatics/btx731
|
| [17] |
W. Zhang, W. Lin, D. Zhang, S. Wang, J. Shi, Y. Niu, Recent advances in the machine learning-based drug-target interaction prediction, Curr. Drug Metab., 20 (2019), 194–202. https://doi.org/10.2174/1389200219666180821094047 doi: 10.2174/1389200219666180821094047
|
| [18] |
M. Thafar, A. B. Raies, S. Albaradei, M. Essack, V. B. Bajic, Comparison study of computational prediction tools for drug–target binding affinities, Front. Chem., 7 (2019), 782. https://doi.org/10.3389/fchem.2019.00782 doi: 10.3389/fchem.2019.00782
|
| [19] |
S. Anusuya, M. Kesherwani, K. V. Priya, A. Vimala, G. Shanmugam, D. Velmurugan, et al., Drug–target interactions: prediction methods and applications, Curr. Protein Pept. Sci., 19 (2018), 537–561. https://doi.org/10.2174/1389203718666161108091609 doi: 10.2174/1389203718666161108091609
|
| [20] |
K. Sachdev, M. K. Gupta, A comprehensive review of feature based methods for drug target interaction prediction, J Biomed Inform., 93 (2019), 103159. https://doi.org/10.1016/j.jbi.2019.103159 doi: 10.1016/j.jbi.2019.103159
|
| [21] |
W. Chen, L. Kurgan, Survey of similarity-based prediction of drug-protein interactions, Curr. Med. Chem., 27 (2020), 5856–5886. https://doi.org/10.2174/0929867326666190808154841 doi: 10.2174/0929867326666190808154841
|
| [22] |
K. Abbasi, P. Razzaghi, A. Poso, S. Ghanbari-Ara, A. Masoudi-Nejad, Deep learning in drug target interaction prediction, Curr. Med. Chem., 28 (2021), 2100–2113. https://doi.org/10.2174/0929867327666200907141016 doi: 10.2174/0929867327666200907141016
|
| [23] |
Q. Bai, J. Ma, S. Liu, T. Xu, A. J. Banegas-Luna, H. Pérez-Sánchez, et al., WADDAICA: a webserver for aiding protein drug design by artificial intelligence and classical algorithm, Comput. Struct. Biotechnol. J., 19 (2021), 3573–3579. https://doi.org/10.1016/j.csbj.2021.06.017 doi: 10.1016/j.csbj.2021.06.017
|
| [24] |
Q. Bai, S. Tan, T. Xu, H. Liu, J. Huang, X. Yao, MolAICal: a soft tool for 3D drug design of protein targets by artificial intelligence and classical algorithm, Brief. Bioinform., 22 (2021), 161. https://doi.org/10.1093/bib/bbaa161 doi: 10.1093/bib/bbaa161
|
| [25] |
Q. Bai, S. Liu, Y. Tian, T. Xu, A. J. Banegas‐Luna, H. Pérez‐Sánchez, et al., Application advances of deep learning methods for de novo drug design and molecular dynamics simulation, Wiley Interdiscip. Rev.: Comput. Mol. Sci., 12 (2022), 1581. https://doi.org/10.1002/wcms.1581 doi: 10.1002/wcms.1581
|
| [26] |
M. Koutrouli, E. Karatzas, D. Paez-Espino, G. A. Pavlopoulos, A guide to conquer the biological network era using graph theory, Front. Bioeng. Biotechnol., 8 (2020), 34. http://doi.org/10.3389/fbioe.2020.00034 doi: 10.3389/fbioe.2020.00034
|
| [27] |
Y. Tabei, M. Kotera, R. Sawada, Y. Yamanishi, Network-based characterization of drug-protein interaction signatures with a space-efficient approach, BMC Syst. Biol., 39 (2019). https://doi.org/10.1186/s12918-019-0691-1 doi: 10.1186/s12918-019-0691-1
|
| [28] |
W. Wang, H. Lv, Y. Zhao, D. Liu, Y. Wang, Y. Zhang, DLS: A link prediction method based on network local structure for predicting drug-protein interactions, Front. Bioeng. Biotechnol., 8 (2020). https://doi.org/10.3389/fbioe.2020.00330 doi: 10.3389/fbioe.2020.00330
|
| [29] |
Z. Wu, W. Li, G. Liu, Y. Tang, Network-based methods for prediction of drug-target interactions, Front. Pharmacol., 9 (2018), 1134. https://doi.org/10.3389/fphar.2018.01134 doi: 10.3389/fphar.2018.01134
|
| [30] |
K. Abbas, A. Abbasi, S. Dong, L. Niu, L. Yu, B. Chen, et al., Application of network link prediction in drug discovery, BMC Bioinformatics, 187 (2021). https://doi.org/10.1186/s12859-021-04082-y doi: 10.1186/s12859-021-04082-y
|
| [31] |
M. A. Thafar, R. S. Olayan, H. Ashoor, S. Albaradei, V. B. Bajic, X. Gao, et al., DTiGEMS+: drug–target interaction prediction using graph embedding, graph mining, and similarity-based techniques, J. Cheminform., 12 (2020), 1–17. https://doi.org/10.1186/s13321-020-00447-2 doi: 10.1186/s13321-020-00447-2
|
| [32] | L. Wang, Z. You, X. Chen, S. Xia, F. Liu, X. Yan, et al., Computational methods for the prediction of drug– target interactions from drug fingerprints and protein sequences by stacked auto-encoder deep neural network, in International Symposium on Bioinformatics Research and Applications, 46–58. https://doi.org/10.1007/978-3-319-59575-7_5 |
| [33] |
B. Agyemang, W. P. Wu, M. Y. Kpiebaareh, Z. Lei, E. Nanor, L. Chen, Multi-view self-attention for interpretable drug–target interaction prediction, J. Biomed. Inform., 110 (2020), 103547. https://doi.org/10.1016/j.jbi.2020.103547 doi: 10.1016/j.jbi.2020.103547
|
| [34] |
P. Zhang, Z. Wei, C. Che, B. Jin, DeepMGT-DTI: Transformer network incorporating multilayer graph information for Drug-Target interaction prediction, Comput. Biol. Med., 142 (2022), 105214. https://doi.org/10.1016/j.compbiomed.2022.105214 doi: 10.1016/j.compbiomed.2022.105214
|
| [35] |
C. Chen, H. Shi, Z Jiang, A. Salhi, R. Chen, X. Cui, et al., DNN-DTIs: Improved drug-target interactions prediction using XGBoost feature selection and deep neural network, Comput. Biol. Med., 136 (2021), 104676. https://doi.org/10.1016/j.compbiomed.2021.104676 doi: 10.1016/j.compbiomed.2021.104676
|
| [36] |
X. Zeng, S. Zhu, W. Lu, Z. Liu, J. Huang, Y Zhou, et al., Target identification among known drugs by deep learning from heterogeneous networks, Chem. Sci., 11 (2020), 1775–1797. https://doi.org/10.1039/C9SC04336E doi: 10.1039/C9SC04336E
|
| [37] |
B. Wang, A. M. Mezlini, F. Demir, M. Fiume, Z. Tu, M. Brudno, et al., Similarity network fusion for aggregating data types on a genomic scale, Nat. Methods, 11 (2014), 333–337. https://doi.org/10.1038/nmeth.2810 doi: 10.1038/nmeth.2810
|
| [38] |
F. Xia, J. Liu, H. Nie, Y. Fu, L. Wan, X. Kong, Random walks: A review of algorithms and applications, IEEE Trans. Emerging Top. Comput. Intell., 4 (2019), 95–107. https://doi.org/10.1109/TETCI.2019.2952908 doi: 10.1109/TETCI.2019.2952908
|
| [39] |
A. Ghulam, X. Lei, M. Guo, C. Bian, Disease-pathway association prediction based on random walks with restart and PageRank, IEEE Access, 8 (2020), 72021–72038. https://doi.org/10.1109/ACCESS.2020.2987071 doi: 10.1109/ACCESS.2020.2987071
|
| [40] |
S. Li, L. Jiang, J. Tang, N. Gao, F. Guo, Kernel fusion method for detecting cancer subtypes via selecting relevant expression data, Front. Genet., 11 (2020), 979. https://doi.org/10.3389/fgene.2020.00979 doi: 10.3389/fgene.2020.00979
|
| [41] |
R. Qin, L. Duan, H. Zheng, J. Li-Ling, K. Song, Y. Zhang, An ontology-independent representation learning for similar disease detection based on multi-layer similarity network, IEEE/ACM Trans. Comput. Biol. Bioinform., 18 (2021), 183–193. https://doi.org/10.1109/tcbb.2019.2941475 doi: 10.1109/tcbb.2019.2941475
|
| [42] |
H. I. Lee, H. Nam, Identification of drug-target interaction by a random walk with restart method on an interactome network, BMC Bioinformatics, 208 (2018), 9–18. https://doi.org/10.1186/s12859-018-2199-x doi: 10.1186/s12859-018-2199-x
|
| [43] |
T. N. Jarada, J. G. Rokne, R. Alhajj, SNF-NN: computational method to predict drug-disease interactions using similarity network fusion and neural networks, BMC Bioinformatics, 28 (2021), 1–20. https://doi.org/10.1186/s12859-020-03950-3 doi: 10.1186/s12859-020-03950-3
|
| [44] |
D. V. Anand, Q. Xu, J. Wee, K. Xia, T. C. Sum, Topological feature engineering for machine learning based halide perovskite materials design, Npj Comput. Mater., 203 (2022), 1–8. https://doi.org/10.1038/s41524-022-00883-8 doi: 10.1038/s41524-022-00883-8
|
| [45] |
M. Wang, Z. Cang, G. W. Wei, A Topology-based network tree for the prediction of protein-protein binding affinity changes following mutation, Nat. Mach. Intell., 2 (2020), 116–123. https://doi.org/10.1038/s42256-020-0149-6 doi: 10.1038/s42256-020-0149-6
|
| [46] | S. Fan, J. Zhu, X. Han, C. Shi, L. Hu, B. Ma, et al., Metapath-guided heterogeneous graph neural network for intent recommendation, in Proceedings of the 25th ACM SIGKDD International Conference on Knowledge Discovery & Data Mining, (2019), 2478–2486. https://doi.org/10.1145/3292500.3330673 |
| [47] | X. Fu, J. Zhang, Z. Meng, I. King, MAGNN: Metapath aggregated graph neural network for heterogeneous graph embedding, in Proceedings of The Web Conference, (2020), 2331–234. https://doi.org/10.1145/3366423.3380297 |
| [48] | Z. Lu, Y. Wang, M. Zeng, M. Li, HNEDTI: Prediction of drug-target interaction based on heterogeneous network embedding, in 2019 IEEE International Conference on Bioinformatics and Biomedicine (BIBM), 2019,211–214. https://doi.org/10.1109/BIBM47256.2019.8983181 |
| [49] |
M. Samizadeh, B. Minaei-Bidgoli, Drug-target interaction prediction by Metapath2vec node embedding in heterogeneous network of interactions, Int. J. Artif. Intell. Tools, 29 (2020), 2050001. https://doi.org/10.1142/S0218213020500013 doi: 10.1142/S0218213020500013
|
| [50] |
X. Liu, H. Feng, J. Wu, K. Xia, Persistent spectral hypergraph-based machine learning (PSH-ML) for protein-ligand binding affinity prediction, Brief. Bioinform., 22 (2021), 127. https://doi.org/10.1093/bib/bbab127 doi: 10.1093/bib/bbab127
|
| [51] |
X. Liu, X. Wang, J. Wu, K. Xia, Hypergraph-based persistent cohomology (HPC) for molecular representations in drug design, Brief. Bioinform., 22 (2021), 411. https://doi.org/10.1093/bib/bbaa411 doi: 10.1093/bib/bbaa411
|
| [52] |
G. A. Petsko, Guilt by association, Genome Biol., 104 (2009), 1–3. https://doi.org/10.1186/gb-2009-10-4-104 doi: 10.1186/gb-2009-10-4-104
|
| [53] |
H. Wang, H. Zheng, J. Wang, C. Wang, F. Wu, Integrating omics data with a multiplex network-based approach for the identification of cancer subtypes, IEEE Trans. Nanobioscience, 15 (2016), 335–342. https://doi.org/10.1109/tnb.2016.2556640 doi: 10.1109/tnb.2016.2556640
|
| [54] |
D. S. Wishart, Y. D. Feunang, A. C. Guo, E. J. Lo, A. Marcu, J. R. Grant, et al., DrugBank 5.0: a major update to the DrugBank database for 2018, Nucleic Acids Res., 46 (2018), 1074–1082. https://doi.org/10.1093/nar/gkx1037 doi: 10.1093/nar/gkx1037
|
| [55] |
D. Weininger, SMILES, a chemical language and information system. 1. Introduction to methodology and encoding rules, J. Chem. Inf. Comput. Sci, 28 (1988), 31–36. https://doi.org/10.1021/ci00057a005 doi: 10.1021/ci00057a005
|
| [56] |
C. Steinbeck, Y. Han, S. Kuhn, O. Horlacher, E. Luttmann, E. Willighagen, Recent developments of the chemistry development kit (CDK)-an opensource java library for chemo-and bioinformatics, Curr. Pharm. Des., 12 (2006), 2111–2120. https://doi.org/10.1021/ci025584y doi: 10.1021/ci025584y
|
| [57] |
A. Rácz, D. Bajusz, K. Héberger, Life beyond the Tanimoto coefficient: similarity measures for interaction fingerprints, J. Cheminform., 10 (2018), 1–12. https://doi.org/10.1186/s13321-018-0302-y doi: 10.1186/s13321-018-0302-y
|
| [58] |
M. Kuhn, M. Campillos, I. Letunic, L. J. Jensen, P. Bork, A side effect resource to capture phenotypic effects of drugs, Mol. Syst. Biol., 6 (2010), 343. https://doi.org/10.1038/msb.2009.98 doi: 10.1038/msb.2009.98
|
| [59] | F. Zhu, TTD, 2009. Available from: https://bio.tools/ttd |
| [60] | UniProt consortium, Uniprot, 2023.Available from: http://www.uniprot.org/ |
| [61] |
T. F. Smith, M. S. Waterman, Identification of common molecular subsequences, J Mol. Biol., 147 (1981), 195–197. https://doi.org/10.1016/0022-2836(81)90087-5 doi: 10.1016/0022-2836(81)90087-5
|
| [62] |
A. P. Davis, C. J. Grondin, R. J. Johnson, D. Sciaky, B. L. King, R. McMorran, et al., The Comparative toxicogenomics database: update 2017, Nucleic Acids Res., 45 (2017), 972–978. https://doi.org/10.1093/nar/gkw838 doi: 10.1093/nar/gkw838
|
| [63] | Gene Ontology, The Gene Ontology Resource, 2023. Available from: http://www.geneontology.org/ |
| [64] |
J. A. Blake, M. Dolan, H. Drabkin, D. P. Hill, L. Ni, D.Sitnikov, et al., Gene Ontology annotations and resources, Nucleic Acids Res., 41 (2013), 530–535. https://doi.org/10.1093/nar/gks1050 doi: 10.1093/nar/gks1050
|
| [65] |
G. Yu, F. Li, Y. Qin, X. Bo, Y. Wu, S. Wang, GOSemSim: an R package for measuring semantic similarity among GO terms and gene products, Bioinformatics, 26 (2010), 976–978. https://doi.org/10.1093/bioinformatics/btq064 doi: 10.1093/bioinformatics/btq064
|
| [66] |
S. S. Deepika, T. V. Geetha, A meta-learning framework using representation learning to predict drug-drug interaction, J. Biomed. Inform., 84 (2018), 136–147. https://doi.org/10.1016/j.jbi.2018.06.015 doi: 10.1016/j.jbi.2018.06.015
|
| [67] |
L. Huang, H. Luo, S. Li, F. Wu, J. Wang, Drug-drug similarity measure and its applications, Brief. Bioinform., 22 (2021), 265. https://doi.org/10.1093/bib/bbaa265 doi: 10.1093/bib/bbaa265
|
| [68] |
T. van Laarhoven, S. B. Nabuurs, E. Marchiori, Gaussian interaction profile kernels for predicting drug-target interaction, Bioinformatics, 27 (2011), 3036–3043. https://doi.org/10.1093/bioinformatics/btr500 doi: 10.1093/bioinformatics/btr500
|
| [69] |
H. Ye, K. Tang, L. Yang, Z. Cao, Y. Li, Study of drug function based on similarity of pathway fingerprint, Protein Cell, 3 (2012), 132–139. https://doi.org/10.1007/s13238-012-2011-z doi: 10.1007/s13238-012-2011-z
|
| [70] |
M. Kanehisa, M. Furumichi, M. Tanabe, Y. Sato, K. Morishima, KEGG: new perspectives on genomes, pathways, diseases and drugs, Nucleic Acids Res., 45 (2017), 353–361. https://doi.org/10.1093/nar/gkw1092 doi: 10.1093/nar/gkw1092
|
| [71] | L. R. Sancho, BioCor: Functional similarities. Available from: https://llrs.github.io/BioCor/ |
| [72] | A. Herbert, MaxCluster, 2023. Available from: http://www.sbg.bio.ic.ac.uk/~maxcluster/ |
| [73] | National Science Foundation, US Department of Energy, National Cancer Institute, National Institute of Allergy and Infectious Diseases, National Institute of General Medical Sciences of the National Institutes of Health, RCSB Protein Data Bank (RCSB PDB), 2023. Available from: https://www.rcsb.org/ |
| [74] |
I. Kufareva, R. Abagyan, Methods of protein structure comparison, Homol. Model., 857 (2012), 231–257. https://doi.org/10.1007/978-1-61779-588-6_10 doi: 10.1007/978-1-61779-588-6_10
|
| [75] |
X. Wu, E. Pang, K. Lin, Z. M. Pei. Improving the measurement of semantic similarity between gene ontology terms and gene products: Insights from an edge- and IC-Based hybrid method, PLoS ONE, 8 (2013), 66745. https://doi.org/10.1371/journal.pone.0066745 doi: 10.1371/journal.pone.0066745
|
| [76] | M. Shatnawi, Review of recent protein-protein interaction techniques, in Emerging Trends in Computational Biology, Bioinformatics and Systems Biology, (2015), 99–121. http://doi.org/10.1016/B978-0-12-802508-6.00006-5 |
| [77] |
C. Menichelli, O. Gascuel, L. Bréhélin, Improving pairwise comparison of protein sequences with domain co-occurrence, PLoS Comput. Biol., 14 (2018), 1005889. https://doi.org/10.1371/journal.pcbi.1005889 doi: 10.1371/journal.pcbi.1005889
|
| [78] |
R. D. Finn, A. Bateman, J. Clements, P. Coggil, R. Y. Eberhardt, S. R. Eddy, et al., Pfam: the protein families database, Nucleic Acids Res, 42 (2014), 222–230. https://doi.org/10.1093/nar/gkt1223 doi: 10.1093/nar/gkt1223
|
| [79] |
Y. M. Omar, P. Plapper, A survey of information entropy metrics for complex networks, Entropy, 22 (2020), 1417. https://doi.org/10.3390/e22121417 doi: 10.3390/e22121417
|
| [80] | A. P. Riascos, J. L. Mateos, Random walks on weighted networks: Exploring local and non-local navigation strategies, 2019, preprint, arXiv: 1901.05609. |
| [81] | Chris McCormick, Word2vec tutorial-the skip-gram model, 2016. Available from: http://mccormickml.com/2016/04/19/word2vec-tutorial-the-skip-gram-model/ |
| [82] |
B. Wang, A. Wang, F. Chen, Y. Wang, C. C. J. Kuo, Evaluating word embedding models: methods and experimental results, APSIPA Trans. Signal Inf. Process., 8 (2019). https://doi.org/10.1017/ATSIP.2019.12 doi: 10.1017/ATSIP.2019.12
|
| [83] |
Y. Li, M. Yang, Z. Zhang, A survey of multi-view representation learning, IEEE Trans. Knowl. Data Eng., 31 (2018), 1863–1883. https://doi.org/10.1109/TKDE.2018.2872063 doi: 10.1109/TKDE.2018.2872063
|
| [84] |
K. Sun, L. Wang, B. Xu, W. Zhao, S. W. Teng, F. Xia, Network representation learning: From traditional feature learning to deep learning, IEEE Access, 8 (2020), 205600–205617. https://doi.org/10.1016/j.jfds.2017.05.001 doi: 10.1016/j.jfds.2017.05.001
|
| [85] | A. Grover, J. Leskovec, node2vec: Scalable feature learning for networks, in Proceedings of the 22nd ACM SIGKDD International Conference on Knowledge Discovery and Data Mining, (2016), 855–864. https://doi.org/10.1145/2939672.2939754 |
| [86] | Y. Dong, N. V. Chawla, A. Swami, metapath2vec: Scalable representation learning for heterogeneous networks, in Proceedings of the 23rd ACM SIGKDD International Conference on Knowledge Discovery and Data Mining, (2017), 135–144. https://doi.org/10.1145/3097983.3098036 |
| [87] | B. Perozzi, R. Al-Rfou, S. Skiena, Deepwalk: Online learning of social representations, in Proceedings of the 20th ACM SIGKDD international conference on Knowledge discovery and data mining, (2014), 701–710. https://doi.org/10.1145/2623330.2623732 |
| [88] | P. Velickovic, G. Cucurull, A. Casanova, A. Romero, P. Liò, Y. Bengio, Graph attention networks, in ICLR, (2018). |
| [89] |
G. Douzas, F. Bacao, F. Last, Improving imbalanced learning through a heuristic oversampling method based on k-means and SMOTE, Inf. Sci., 465 (2018), 1–20. https://doi.org/10.1016/j.ins.2018.06.056 doi: 10.1016/j.ins.2018.06.056
|
| [90] |
A. Creswell, T. White, V. Dumoulin, K. Arulkumaran, B. Sengupta. A. A. Bharath, Generative adversarial networks: An overview, IEEE Signal Proc. Mag., 35 (2018), 53–65. https://doi.org/10.1109/MSP.2017.2765202 doi: 10.1109/MSP.2017.2765202
|
| [91] |
J. Peng, J. Li, X. Shang, A learning-based method for drug-target interaction prediction based on feature representation learning and deep neural network, BMC Bioinformatics, 21 (2020), 1–13. https://doi.org/10.1186/s12859-020-03677-1 doi: 10.1186/s12859-020-03677-1
|
| [92] |
Z. Zheng, N. Q. K. Le, M. C. H. Chua, MaskDNA-PGD: An innovative deep learning model for detecting DNA methylation by integrating mask sequences and adversarial PGD training as a data augmentation method, Chemom. Intell. Lab. Syst., 232 (2023), 104715. https://doi.org/10.1016/j.chemolab.2022.104715 doi: 10.1016/j.chemolab.2022.104715
|
| [93] |
J. N. Sua, S. Y. Lim, M. H. Yulius, X. Su, E. K. Y. Yapp, N. Q. K. Le, et al., Incorporating convolutional neural networks and sequence graph transform for identifying multilabel protein Lysine PTM sites, Chemom. Intell. Lab. Syst., 206 (2020), 104171. https://doi.org/10.1016/j.chemolab.2020.104171 doi: 10.1016/j.chemolab.2020.104171
|
| [94] |
Y. Yamanishi, M. Araki, A. Gutteridge, W. Honda, M. Kanehisa, Prediction of drug-target interaction networks from the integration of chemical and genomic spaces, Bioinformatics, 24 (2008), 232–240. https://doi.org/10.1093/bioinformatics/btn162 doi: 10.1093/bioinformatics/btn162
|
| [95] |
Q. Kuang, X. Xu, R. Li, Y. Dong, Y. Li, Z. Huang, et al., An eigenvalue transformation technique for predicting drug-target interaction, Sci. Rep., 5 (2015), 13867. https://doi.org/10.1038/srep13867 doi: 10.1038/srep13867
|
| [96] | J. Davis, M. Goadrich, The relationship between precision-recall and ROC Curves, in Proceedings of the 23rd international conference on machine learning, (2006), 233–240. https://doi.org/10.1145/1143844.1143874 |
| [97] |
T. Nguyen, T. H. Nguyen, T. N. H. Pham, N. T. Huy, M. V. Bay, M. Q. Pham, et al., Autodockvina adopts more accurate binding poses but autodock4 forms better binding affinity, J. Chem. Inf. Model., 60 (2019), 204–211. https://doi.org/10.1021/acs.jcim.9b00778 doi: 10.1021/acs.jcim.9b00778
|
| [98] | PunMed, National Library of MedicineNational Center for Biotechnology Information, 2023. Available from: https://pubmed.ncbi.nlm.nih.gov/ |
| [99] | European Molecular Biology Laboratory, ChEMBL, 2023. Available from: https://www.ebi.ac.uk/chembl/ |
| [100] |
N. Rohani, C. Eslahchi, Drug-drug interaction predicting by neural network using integrated similarity, Sci. Rep., 9 (2019), 1–11. https://doi.org/10.1038/s41598-019-50121-3 doi: 10.1038/s41598-019-50121-3
|
| [101] |
R. Zhou, Z. Lu, H. Luo, J. Xiang, M. Zeng, M. Li, NEDD: a network embedding based method for predicting drug-disease associations, BMC Bioinformatics, 387 (2020), 1–12. https://doi.org/10.1186/s12859-020-03682-4 doi: 10.1186/s12859-020-03682-4
|


Figures(14) / Tables(10)

Saranya Muniyappan, Arockia Xavier Annie Rayan, Geetha Thekkumpurath Varrieth. DTiGNN: Learning drug-target embedding from a heterogeneous biological network based on a two-level attention-based graph neural network[J]. Mathematical Biosciences and Engineering, 2023, 20(5): 9530-9571. doi: 10.3934/mbe.2023419


 DownLoad: