High throughput biological experiments are expensive and time consuming. For the past few years, many computational methods based on biological information have been proposed and widely used to understand the biological background. However, the processing of biological information data inevitably produces false positive and false negative data, such as the noise in the Protein-Protein Interaction (PPI) networks and the noise generated by the integration of a variety of biological information. How to solve these noise problems is the key role in essential protein predictions. An Identifying Essential Proteins model based on non-negative Matrix Symmetric tri-Factorization and multiple biological information (IEPMSF) is proposed in this paper, which utilizes only the PPI network proteins common neighbor characters to develop a weighted network, and uses the non-negative matrix symmetric tri-factorization method to find more potential interactions between proteins in the network so as to optimize the weighted network. Then, using the subcellular location and lineal homology information, the starting score of proteins is determined, and the random walk algorithm with restart mode is applied to the optimized network to mark and rank each protein. We tested the suggested forecasting model against current representative approaches using a public database. Experiment shows high efficiency of new method in essential proteins identification. The effectiveness of this method shows that it can dramatically solve the noise problems that existing in the multi-source biological information itself and cased by integrating them.
Citation: Zhihong Zhang, Yingchun Luo, Meiping Jiang, Dongjie Wu, Wang Zhang, Wei Yan, Bihai Zhao. An efficient strategy for identifying essential proteins based on homology, subcellular location and protein-protein interaction information[J]. Mathematical Biosciences and Engineering, 2022, 19(6): 6331-6343. doi: 10.3934/mbe.2022296
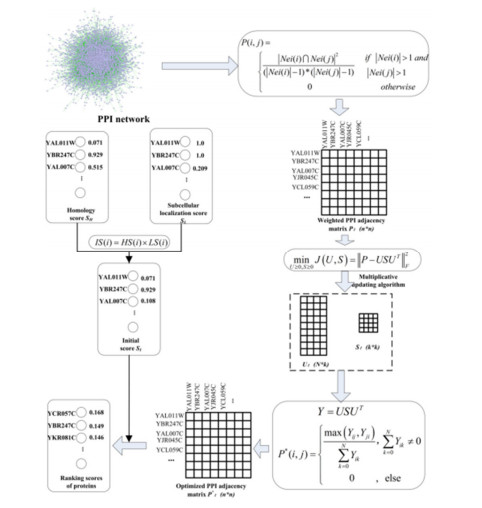
High throughput biological experiments are expensive and time consuming. For the past few years, many computational methods based on biological information have been proposed and widely used to understand the biological background. However, the processing of biological information data inevitably produces false positive and false negative data, such as the noise in the Protein-Protein Interaction (PPI) networks and the noise generated by the integration of a variety of biological information. How to solve these noise problems is the key role in essential protein predictions. An Identifying Essential Proteins model based on non-negative Matrix Symmetric tri-Factorization and multiple biological information (IEPMSF) is proposed in this paper, which utilizes only the PPI network proteins common neighbor characters to develop a weighted network, and uses the non-negative matrix symmetric tri-factorization method to find more potential interactions between proteins in the network so as to optimize the weighted network. Then, using the subcellular location and lineal homology information, the starting score of proteins is determined, and the random walk algorithm with restart mode is applied to the optimized network to mark and rank each protein. We tested the suggested forecasting model against current representative approaches using a public database. Experiment shows high efficiency of new method in essential proteins identification. The effectiveness of this method shows that it can dramatically solve the noise problems that existing in the multi-source biological information itself and cased by integrating them.

| [1] |
M. Li, R. Zheng, H. Zhang, J. Wang, Y. Pan, Effective identification of essential proteins based on priori knowledge, network topology and gene expressions, Methods, 67 (2014), 325–333. https://doi.org/10.1016/j.ymeth.2014.02.016 doi: 10.1016/j.ymeth.2014.02.016

|
| [2] |
M. W. Hahn, A. D. Kern, Comparative genomics of centrality and essentiality in three eukaryotic protein-interaction networks, Mol. Biol. Evol., 22 (2005), 803–806. https://doi.org/10.1093/molbev/msi072 doi: 10.1093/molbev/msi072
|
| [3] | K. Björnsdottir, Language, research and nursing practice, J. Adv. Nurs., 33 (2001), 159–166. Available from: https://pubmed.ncbi.nlm.nih.gov/11168697/. |
| [4] |
S. Wuchty, P. F. Stadler, Centers of complex networks, J. Theor. Biol., 223 (2003), 45–53. https://doi.org/10.1016/S0022-5193(03)00071-7 doi: 10.1016/S0022-5193(03)00071-7
|
| [5] |
E. Estrada, J. A. Rodriguez-Velazquez, Subgraph centrality in complex networks, Phys. Rev. E., 71 (2005), 056103. https://doi.org/10.1103/PhysRevE.71.056103 doi: 10.1103/PhysRevE.71.056103
|
| [6] |
M. P. Joy, A. Brock, D. E. Ingber, S. Huang, High-betweenness proteins in the yeast protein interaction network, Biomed. Res. Int., 2005 (2005), 96. https://doi.org/10.1155/JBB.2005.96 doi: 10.1155/JBB.2005.96
|
| [7] |
J. Wang, M. Li, H. Wang, Y. Pan, Identification of essential proteins based on edge clustering coefficient, IEEE/ACM Trans. Comput. Biol. Bioinf., 9 (2012), 1070–1080. https://doi.org/10.1109/TCBB.2011.147 doi: 10.1109/TCBB.2011.147
|
| [8] |
X. Zhang, J. Xu, W. Xiao, A new method for the discovery of essential proteins, PLoS One, 8 (2013), e58763. https://doi.org/10.1371/journal.pone.0058763 doi: 10.1371/journal.pone.0058763
|
| [9] |
M. Li, H. Zhang, J. Wang, Y. Pan, A new essential protein discovery method based on the integration of protein-protein interaction and gene expression data, BMC Syst. Biol., 6 (2012), 15. https://doi.org/10.1186/1752-0509-6-15 doi: 10.1186/1752-0509-6-15
|
| [10] |
B. Zhao, J. Wang, M. Li, F. Wu, Y. Pan, Prediction of essential proteins based on overlapping essential modules, IEEE Trans. Nanobioscience, 13 (2014), 415–424. https://doi.org/10.1109/TNB.2014.2337912 doi: 10.1109/TNB.2014.2337912
|
| [11] |
F. Zhang, W. Peng, Y. Yang, W. Dai, J. Song, A novel method for identifying essential genes by fusing dynamic protein–protein interactive networks, Genes, 10 (2019), 31. https://doi.org/10.3390/genes10010031 doi: 10.3390/genes10010031
|
| [12] |
J. Zhong, C. Tang, W. Peng, M. Xie, Y. Sun, Q. Tang, et al., A novel essential protein identification method based on PPI networks and gene expression data, BMC Bioinf., 22 (2021), 248. https://doi.org/10.1186/s12859-021-04175-8 doi: 10.1186/s12859-021-04175-8
|
| [13] | C. Ding, T. Li, W. Peng, H. Park, Orthogonal nonnegative matrix t-factorizations for clustering, in Proceedings of the 12th ACM SIGKDD International Conference on Knowledge Discovery and Data Mining, (2006), 126–135. https://doi.org/10.1145/1150402.1150420 |
| [14] |
A. Hassani, A. Iranmanesh, N. Mansouri, Text mining using nonnegative matrix factorization and latent semantic analysis. Neural Comput. Appl., 33 (2021), 13745–13766. https://doi.org/10.1007/s00521-021-06014-6 doi: 10.1007/s00521-021-06014-6
|
| [15] |
Z. Khan, N. Iltaf, H. Afzal, H. Abbas, Enriching non-negative matrix factorization with contextual embeddings for recommender systems, Neurocomputing, 380 (2020), 246–258. https://doi.org/10.1016/j.neucom.2019.09.080 doi: 10.1016/j.neucom.2019.09.080
|
| [16] |
Y. Qing, C. Jun, N. AI-Nabhan, Data representation using robust nonnegative matrix factorization for edge computing, Math. Biosci. Eng., 19 (2022), 2147–2178. https://doi.org/10.3934/mbe.2022100 doi: 10.3934/mbe.2022100
|
| [17] |
Y. Qiu, W. Ching, Q. Zou, Matrix factorization-based data fusion for the prediction of RNA-binding proteins and alternative splicing event associations during epithelial-mesenchymal transition, Briefings Bioinf., 22 (2021), bbab332. https://doi.org/10.1093/bib/bbab332 doi: 10.1093/bib/bbab332
|
| [18] |
Y. Man, G. Liu, Y. Kuo, X. Zhou, SNFM: A semi-supervised NMF algorithm for detecting biological functional modules, Math. Biosci. Eng., 16 (2019), 1933–1948. https://doi.org/10.3934/mbe.2019094 doi: 10.3934/mbe.2019094
|
| [19] |
N. Pržulj, D. A. Wigle, I. Jurisica, Functional topology in a network of protein interactions, Bioinformatics, 20 (2004), 340–348. https://doi.org/10.1093/bioinformatics/btg415 doi: 10.1093/bioinformatics/btg415
|
| [20] |
B. Zhao, S. Hu, X. Li, F. Zhang, Q. Tian, W. Ni, An efficient method for protein function annotation based on multilayer protein networks, Hum. Genomics, 10 (2016), 33. https://doi.org/10.1186/s40246-016-0087-x doi: 10.1186/s40246-016-0087-x
|
| [21] |
G. T. Hart, I. Lee, E. M. Marcotte, A high-accuracy consensus map of yeast protein complexes reveals modular nature of gene essentiality, BMC Bioinf., 8 (2007), 236. https://doi.org/10.1186/1471-2105-8-236 doi: 10.1186/1471-2105-8-236
|
| [22] |
G. Li, M. Li, J. Wang, J. Wu, F. Wu, Y. Pan, Predicting essential proteins based on subcellular localization, orthology and PPI networks, BMC Bioinf., 17 (2016), 279. https://doi.org/10.1186/s12859-016-1115-5 doi: 10.1186/s12859-016-1115-5
|
| [23] |
H. W. Mewes, D. Frishman, K. F. X. Mayer, M. Münsterkötter, O. Noubibou, P. Pagel, et al., MIPS: analysis and annotation of proteins from whole genomes in 2005, Nucleic Acids Res., 34 (2006), D169-D172. https://doi.org/10.1093/nar/gkj148 doi: 10.1093/nar/gkj148
|
| [24] |
J. M. Cherry, C. Adler, C. Ball, S. A. Chervitz, S. S. Dwight, E. T. Hester, et al., SGD: Saccharomyces genome database, Nucleic Acids Res., 26 (1998), 73–79. https://doi.org/10.1093/nar/26.1.73 doi: 10.1093/nar/26.1.73
|
| [25] |
R. Zhang, Y. Lin, DEG 5.0, a database of essential genes in both prokaryotes and eukaryotes, Nucleic Acids Res., 37 (2009), D455–D458. https://doi.org/10.1093/nar/gkn858 doi: 10.1093/nar/gkn858
|
| [26] |
W. Peng, J. Wang, W. Wang, Q. Liu, F. Wu, Y. Pan, Iteration method for predicting essential proteins based on ontology and protein-protein interaction networks, BMC Syst. Biol., 6 (2012), 87. https://doi.org/10.1186/1752-0509-6-87 doi: 10.1186/1752-0509-6-87
|
| [27] |
I. Xenarios, L. Salwínski, X. J. Duan, P. Higney, S. Kim, D. Eisenberg, DIP, the Database of Interacting Proteins: a research tool for studying cellular networks of protein interactions, Nucleic Acids Res., 30 (2002), 303–305. https://doi.org/10.1093/nar/30.1.303 doi: 10.1093/nar/30.1.303
|
| [28] |
J. X. Binder, S. Pletscher-Frankild, K. Tsafou, C. Stolte, S. I. O'Donoghue, R. Schneider, et al., COMPARTMENTS: unification and visualization of protein subcellular localization evidence, Database, 2014 (2014), bau012. https://doi.org/10.1093/database/bau012 doi: 10.1093/database/bau012
|
| [29] |
J. T. Eppig, J. A. Blake, C. J. Bult, J. A. Kadin, J. E. Richardson, The Mouse Genome Database (MGD): comprehensive resource for genetics and genomics of the laboratory mouse, Nucleic Acids Res., 40 (2012), D881–D886. https://doi.org/10.1093/nar/gkr974 doi: 10.1093/nar/gkr974
|
| [30] |
M. Magrane, UniProt Consortium, UniProt Knowledgebase: a hub of integrated protein data, Database, 2011 (2011), bar009. https://doi.org/10.1093/database/bar009 doi: 10.1093/database/bar009
|
| [31] |
T. W. Harris, I. Antoshechkin, T. Bieri, D. Blasiar, J. Chan, W. J. Chen, et al., WormBase: a comprehensive resource for nematode research, Nucleic Acids Res., 38 (2010), D463–D467. https://doi.org/10.1093/nar/gkp952 doi: 10.1093/nar/gkp952
|
| [32] |
P. McQuilton, S. E. St. Pierre, J. Thurmond, the FlyBase Consortium, FlyBase 101–the basics of navigating FlyBase, Nucleic Acids Res., 40 (2012), D706–D714. https://doi.org/10.1093/nar/gkr1030 doi: 10.1093/nar/gkr1030
|
| [33] |
G. Östlund, T. Schmitt, K. Forslund, T. Köstler, D. N. Messina, S. Roopra, et al., InParanoid 7: new algorithms and tools for eukaryotic orthology analysis, Nucleic Acids Res., 38 (2010), D196–D203. https://doi.org/10.1093/nar/gkp931 doi: 10.1093/nar/gkp931
|


Figures(4) / Tables(1)

Zhihong Zhang, Yingchun Luo, Meiping Jiang, Dongjie Wu, Wang Zhang, Wei Yan, Bihai Zhao. An efficient strategy for identifying essential proteins based on homology, subcellular location and protein-protein interaction information[J]. Mathematical Biosciences and Engineering, 2022, 19(6): 6331-6343. doi: 10.3934/mbe.2022296


 DownLoad: