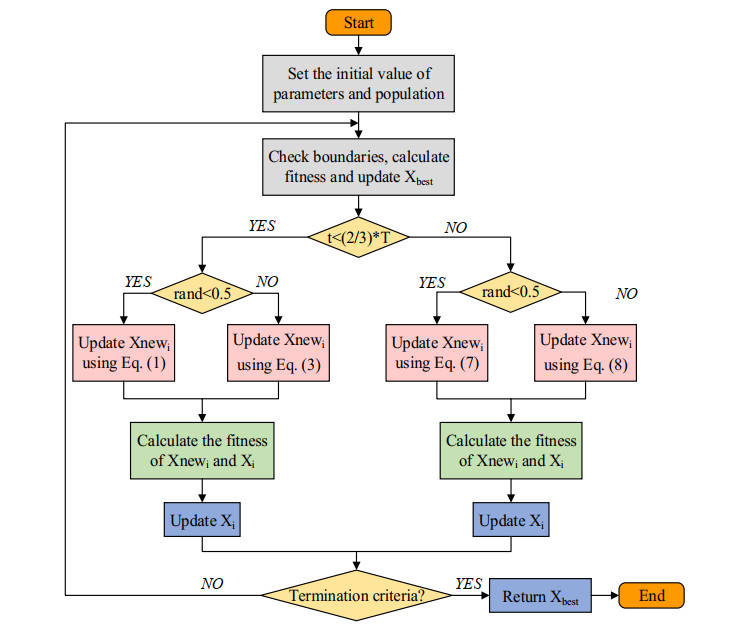
This paper introduces an improved hybrid Aquila Optimizer (AO) and Harris Hawks Optimization (HHO) algorithm, namely IHAOHHO, to enhance the searching performance for global optimization problems. In the IHAOHHO, valuable exploration and exploitation capabilities of AO and HHO are retained firstly, and then representative-based hunting (RH) and opposition-based learning (OBL) strategies are added in the exploration and exploitation phases to effectively improve the diversity of search space and local optima avoidance capability of the algorithm, respectively. To verify the optimization performance and the practicability, the proposed algorithm is comprehensively analyzed on standard and CEC2017 benchmark functions and three engineering design problems. The experimental results show that the proposed IHAOHHO has more superior global search performance and faster convergence speed compared to the basic AO and HHO and selected state-of-the-art meta-heuristic algorithms.
Citation: Shuang Wang, Heming Jia, Qingxin Liu, Rong Zheng. An improved hybrid Aquila Optimizer and Harris Hawks Optimization for global optimization[J]. Mathematical Biosciences and Engineering, 2021, 18(6): 7076-7109. doi: 10.3934/mbe.2021352
This paper introduces an improved hybrid Aquila Optimizer (AO) and Harris Hawks Optimization (HHO) algorithm, namely IHAOHHO, to enhance the searching performance for global optimization problems. In the IHAOHHO, valuable exploration and exploitation capabilities of AO and HHO are retained firstly, and then representative-based hunting (RH) and opposition-based learning (OBL) strategies are added in the exploration and exploitation phases to effectively improve the diversity of search space and local optima avoidance capability of the algorithm, respectively. To verify the optimization performance and the practicability, the proposed algorithm is comprehensively analyzed on standard and CEC2017 benchmark functions and three engineering design problems. The experimental results show that the proposed IHAOHHO has more superior global search performance and faster convergence speed compared to the basic AO and HHO and selected state-of-the-art meta-heuristic algorithms.

| [1] | I. Boussad, J. Lepagnot, P. Siarry, A survey on optimization metaheuristics, Inf. Sci., 237 (2013), 82-117. |
| [2] | T. Dokeroglu, E. Sevinc, T. Kucukyilmaz, A. Cosar, A survey on new generation metaheuristic algorithms, Comput. Ind. Eng., 137 (2019), 106040. |
| [3] | K. Hussain, M. Salleh, C. Shi, Y. Shi, Metaheuristic research: a comprehensive survey, Artif. Intell. Rev., 52 (2019), 2191-2233. |
| [4] | L. Abualigah, A. Diabat, Advances in sine cosine algorithm: a comprehensive survey, Artif. Intell. Rev., 54 (2021), 2567-2608. |
| [5] | L. Abualigah, A. Diabat, A comprehensive survey of the Grasshopper optimization algorithm: results, variants, and applications, Neural Comput. Appl., 32 (2020), 15533-15556. |
| [6] | J. H. Holland, Genetic algorithms, Sci. Am., 267 (1992), 66-72. |
| [7] | R. Storn, K. Price, Differential evolution-a simple and efficient heuristic for global optimization over continuous spaces, J. Glob. Optim., 11 (1997), 341-359. |
| [8] | I. Rechenberg, Evolutionsstrategien, in Simulationsmethoden in der Medizin und Biologie, Springer, Berlin, Heidelberg, (1978), 83-114. |
| [9] | D. Simon, Biogeography-based optimization, IEEE Trans. Evol. Comput., 12 (2008), 702-713. |
| [10] | D. Dasgupta, Z. Michalewicz, Evolutionary algorithms in engineering applications, DBLP, 1997. |
| [11] | S. Kirkpatrick, C. D. Gelatt, M. P. Vecchi, Optimization by simmulated annealing, Science, 220 (1983), 671-80. |
| [12] | E. Rashedi, H. Nezamabadi-pour, S. Saryazdi, GSA: a gravitational search algorithm, Inf. Sci., 179 (2009), 2232-2248. |
| [13] | A. Hatamlou, Black hole: a new heuristic optimization approach for data clustering, Inf. Sci., 222 (2013), 175-84. |
| [14] | S. Mirjalili, S. M. Mirjalili, A. Hatamlou, Multi-Verse Optimizer: a nature-inspired algorithm for global optimization, Neural Comput. Appl., 27 (2015), 495-513. |
| [15] | S. Mirjalili, SCA: A sine cosine algorithm for solving optimization problems, Knowl.-Based Syst., 96 (2016). |
| [16] | L. Abualigah, A. Diabat, S. Mirjalili, M. A. Elaziz, A. H. Gandomi, The arithmetic optimization algorithm, Comput. Methods Appl. Mech. Eng., 376 (2021), 113609. |
| [17] | F. Asef, V. Majidnezhad, M. R. Feizi-Derakhshi, S. Parsa, Heat transfer relation-based optimization algorithm (HTOA), Soft Comput., (2021), 1-30. |
| [18] | J. Kennedy, R. Eberhart, Particle swarm optimization, in Proceedings of the 1995 IEEE international conference on neural networks (ICNN '93), IEEE, 4 (1995), 1942-1948. |
| [19] | M. Dorigo, M. Birattari, T. Stutzle, Ant colony optimization, IEEE Comput. Intell., 1 (2006), 28-39. |
| [20] | X. S. Yang, Firefly algorithm, stochastic test functions and design optimisation, Int. J. Bio-Inspired Comput., 2 (2010), 78-84. |
| [21] | S. Mirjalili, S. M. Mirjalili, A. Lewis, Grey wolf optimizer, Adv. Eng. Software, 69 (2014), 46-61. |
| [22] | A. H. Gandomi, X. S. Yang, A. H. Alavi, Cuckoo search algorithm: a metaheuristic approach to solve structural optimization problems, Eng. Comput., 29 (2013), 17-35. |
| [23] | S. Mirjalili, A. Lewis, The whale optimization algorithm, Adv. Eng. Software, 95 (2016), 51-67. |
| [24] | S. Mirjalili, A. H. Gandomi, S. Z. Mirjalili, S. Saremi, H. Faris, S. M. Mirjalili, Salp swarm algorithm: A bio-inspired optimizer for engineering design problems, Adv. Eng. Software, 114 (2017), 163-191. |
| [25] | H. Jia, X. Peng, C. Lang, Remora optimization algorithm, Expert Systems with Applications, 185 (2021), 115665. |
| [26] | S. M. Li, H. L. Chen, M. J. Wang, A. A. Heidari, S. Mirjalili, Slime mould algorithm: A new method for stochastic optimization, Future Gener. Comput. Syst., 111 (2020), 300-323. |
| [27] | F. Miarnaeimi, G. Azizyan, M. Rashki, Horse herd optimization algorithm: a nature-inspired algorithm for high-dimensional optimization problems, Knowl.-Based Syst., 213 (2020). |
| [28] | L. Abualigah, D. Yousri, M. A. Elaziz, A. A. Ewees, M. A. A. Al-qaness, A. H. Gandomi, Aquila Optimizer: a novel meta-heuristic optimization algorithm, Comput. Ind. Eng., 157 (2021), 107250. |
| [29] | A. A. Heidari, S. Mirjalili, H. Faris, I. Aljarah, M. Mafarja, H. L. Chen, Harris Hawks optimization: algorithm and applications, Future Gener. Comput. Syst., 97 (2019), 849-872. |
| [30] | A. M. AlRassas, M. A. A. Al-qaness, A. A. Ewees, S. Ren, M. Abd Elaziz, R. Damaševičius, et al., Optimized ANFIS model using Aquila Optimizer for oil production forecasting, Processes, 9 (2021), 1194. |
| [31] | C. Hao, A. A. Heidari, H. Chen, M. Wang, Z. Pan, A. H. Gandomi, Multi-population differential evolution-assisted harris hawks optimization: framework and case studies, Future Gener. Comput. Syst., 111 (2020), 175-198. |
| [32] | M. A. Al-Betar, M. A. Awadallah, A. A. Heidari, H. Chen, C. Li, Survival exploration strategies for harris hawks optimizer, Expert Syst. Appl., 168 (2020), 114243. |
| [33] | S. Song, P. Wang, A. A. Heidari, M. Wang, S. Xu, Dimension decided harris hawks optimization with gaussian mutation: balance analysis and diversity patterns, Knowl.-Based Syst., 215 (2020), 106425. |
| [34] | D. Yousri, S. Mirjalili, J. A. T. Machado, S. B. Thanikantie, O. Elbaksawi, A. Fathy, Efficient fractional-order modified Harris Hawks optimizer for proton exchange membrane fuel cell modeling, Eng. Appl. Artif. Intell., 100 (2021), 104193. |
| [35] | S. Gupta, K. Deep, A. A. Heidari, H. Moayedi, M. Wang, Opposition-based learning Harris hawks optimization with advanced transition rules: Principles and analysis, Expert Syst. Appl., 158 (2020), 113510. |
| [36] | O. Akdag, A. Ates, C. Yeroglu, Modification of harris hawks optimization algorithm with random distribution functions for optimum power flow problem, Neural Comput. Appl., 33 (2021). |
| [37] | D. Yousri, A. Fathy, S. B. Thanikanti, Recent methodology based Harris Hawks optimizer for designing load frequency control incorporated in multi-interconnected renewable energy plants, Sustainable Energy Grids Networks, 22 (2020), 100352. |
| [38] | H. Jia, C. Lang, D. Oliva, W. Song, X. Peng, Dynamic harris hawks optimization with mutation mechanism for satellite image segmentation, Remote Sens., 11 (2019), 1421. |
| [39] | K. Hussain, N. Neggaz, W. Zhu, E. H. Houssein, An efficient hybrid sine-cosine Harris hawks optimization for low and high-dimensional feature selection, Expert Syst. Appl., 176 (2021), 114778. |
| [40] | X. Bao, H. Jia, C. Lang, A novel hybrid harris hawks optimization for color image multilevel thresholding segmentation, IEEE Access, 7 (2019), 76529-76546. |
| [41] | E. H. Houssein, M. E. Hosney, M. Elhoseny, D. Oliva, M. Hassaballah, Hybrid Harris hawks optimization with cuckoo search for drug design and discovery in chemoinformatics, Sci. Rep., 10 (2020), 14439. |
| [42] | A. Kaveh, P. Rahmani, A. D. Eslamlou, An efficient hybrid approach based on Harris Hawks optimization and imperialist competitive algorithm for structural optimization, Eng. Comput., (2021), 4598. |
| [43] | A. Auger, N. Hansen, A restart cma evolution strategy with increasing population size, IEEE Congr. Evol. Comput., 2 (2005), 1769-1776. |
| [44] | R. Tanabe, A. S. Fukunaga, Improving the search performance of SHADE using linear population size reduction, IEEE Congr. Evol. Comput., 2014. |
| [45] | G. Dhiman, SSC: A hybrid nature-inspired meta-heuristic optimization algorithm for engineering applications, Knowl.-Based Syst., 222 (2021), 106926. |
| [46] | I. Ahmadianfar, A. A. Heidari, A. H. Gandomi, X. Chu, H. Chen, RUN beyond the metaphor: an efficient optimization algorithm based on Runge Kutta method, Expert Syst. Appl., 181 (2021), 115079. |
| [47] | M. Banaie-Dezfouli, M. H. Nadimi-Shahraki, Z. Beheshti, R-gwo: representative-based grey wolf optimizer for solving engineering problems, Appl.Soft Comput., (2021), 107328. |
| [48] | H. Tizhoosh, Opposition-based learning: A new scheme for machine intelligence, in Proceedings of the International Conference on Computational Intelligence for Modeling, (2005), 695-701. |
| [49] | S. Rahnamayan, H. R. Tizhoosh, M. M. A. Salama, Opposition-based differential evolution, IEEE Trans. Evol. Comput., 12 (2014), 64-79. |
| [50] | Z. Jia, L. Li, S. Hui, Artificial bee colony using opposition-based learning, Adv. Intell. Syst. Comput., 329 (2015), 3-10. |
| [51] | M. A. Elaziz, D. Oliva, S. Xiong, An improved opposition-based sine cosine algorithm for global optimization, Expert Syst. Appl., 90 (2017), 484-500. |
| [52] | A. A. Ewees, M. A. Elaziz, E. H. Houssein, Improved grasshopper optimization algorithm using opposition-based learning, Expert Syst. Appl., 112 (2018), 156-172. |
| [53] | C. Fan, N. Zheng, J. Zheng, L. Xiao, Y. Liu, Kinetic-molecular theory optimization algorithm using opposition-based learning and varying accelerated motion, Soft Comput., 24 (2020). |
| [54] | N. H. Awad, M. Z. Ali, P. N. Suganthan, J. J. Liang, B. Y. Qu, Problem definitions and evaluation criteria for the CEC2017, in Special Session and Competition on Single Objective Real-Parameter Numerical Optimization, IEEE Congress on Evolutionary Computation, 2017. |


Figures(10) / Tables(12)

Shuang Wang, Heming Jia, Qingxin Liu, Rong Zheng. An improved hybrid Aquila Optimizer and Harris Hawks Optimization for global optimization[J]. Mathematical Biosciences and Engineering, 2021, 18(6): 7076-7109. doi: 10.3934/mbe.2021352


 DownLoad: