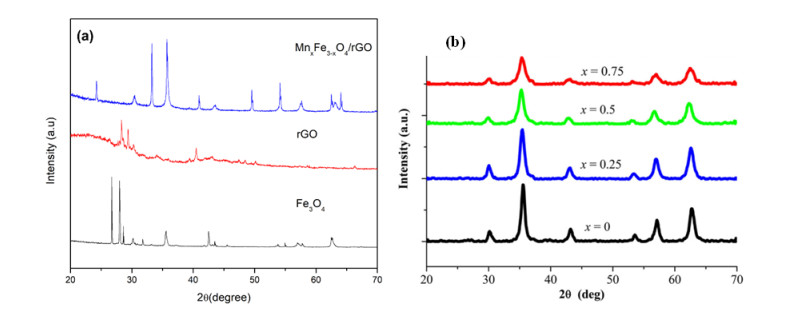
In this work, the Fe3O4 nanoparticles from natural iron sand were doped with Mn and combined with reduced-graphene oxide (rGO) to obtain MnxFe3–xO4/rGO nanocomposites with mole fraction variations of the Mn of 0.25, 0.5, and 0.75. The crystalline phase of the synthesized MnxFe3–xO4/rGO nanocomposites formed an amorphous phase. The presence of rGO was observed through EDX results. The magnetical properties of MnxFe3–xO4/rGO nanocomposites were shown by decreasing the Br, HcJ, Hmax along with increasing of Mn doping. Interestingly, increasing rGO and Mn composition made the absorption bandwidth of the MnxFe3–xO4/rGO nanocomposites wider, so that the radar absorption also increased marking by the greater reflection loss that reached −11.95 dB. The increase in the radar absorption performance of MnxFe3–xO4/rGO nanocomposites came from the efficient complementarity between dielectric loss and magnetic loss and interfacial polarization between Fe3O4 doped Mn and rGO.
Citation: Yana Fajar Prakasa, Sumari Sumari, Aman Santoso, Muhammad Roy Asrori, Ririn Cahyanti. The performance of radar absorption of MnxFe3–xO4/rGO nanocomposites prepared from iron sand beach and coconut shell waste[J]. AIMS Materials Science, 2023, 10(2): 227-248. doi: 10.3934/matersci.2023013
In this work, the Fe3O4 nanoparticles from natural iron sand were doped with Mn and combined with reduced-graphene oxide (rGO) to obtain MnxFe3–xO4/rGO nanocomposites with mole fraction variations of the Mn of 0.25, 0.5, and 0.75. The crystalline phase of the synthesized MnxFe3–xO4/rGO nanocomposites formed an amorphous phase. The presence of rGO was observed through EDX results. The magnetical properties of MnxFe3–xO4/rGO nanocomposites were shown by decreasing the Br, HcJ, Hmax along with increasing of Mn doping. Interestingly, increasing rGO and Mn composition made the absorption bandwidth of the MnxFe3–xO4/rGO nanocomposites wider, so that the radar absorption also increased marking by the greater reflection loss that reached −11.95 dB. The increase in the radar absorption performance of MnxFe3–xO4/rGO nanocomposites came from the efficient complementarity between dielectric loss and magnetic loss and interfacial polarization between Fe3O4 doped Mn and rGO.

| [1] |
Dayo ZA, Cao Q, Wang Y (2020) A compact high-gain coplanar waveguide-fed antenna for military RADAR applications. Int J Antennas Propag 2020: 8024101. https://doi.org/10.1155/2020/8024101 doi: 10.1155/2020/8024101

|
| [2] |
Wen F (2019) Direction finding in MIMO radar with large antenna arrays and nonorthogonal waveforms. Digit Signal Process 94: 75-83. https://doi.org/10.1016/j.dsp.2019.06.008 doi: 10.1016/j.dsp.2019.06.008
|
| [3] |
Wagner T, Feger R, Stelzer A (2017) Radar signal processing for jointly estimating tracks and micro-doppler signatures. IEEE Access 5: 1220-1238. https://doi.org/10.1109/ACCESS.2017.2667720 doi: 10.1109/ACCESS.2017.2667720
|
| [4] |
Bandara P, Carpenter DO (2018) Planetary electromagnetic pollution: it is time to assess its impact. Lancet Planet Health 2: e512-e514. https://doi.org/10.1016/S2542-5196(18)30221-3 doi: 10.1016/S2542-5196(18)30221-3
|
| [5] |
Miah T, Kamat D (2017) Current understanding of the health effects of electromagnetic fields. Pediatr Ann 46: e172-e174. https://doi.org/10.3928/19382359-20170316-01 doi: 10.3928/19382359-20170316-01
|
| [6] |
Sabath F (2017) A systematic approach for electromagnetic interference risk management. IEEE EMC 6: 99-106. https://doi.org/10.1109/MEMC.0.8272296 doi: 10.1109/MEMC.0.8272296
|
| [7] |
Mas'udah KW, Hendy, Taufiq A (2020) Characteristics of crystal structure and microwave absorption of silica particles as the effect of sintering temperature. AIP Conf Proc 2231: 040072. https://doi.org/10.1063/5.0002477 doi: 10.1063/5.0002477
|
| [8] |
Hardianto YP, Taufiq A, Hidayat A, et al. (2018) Nanostructure analysis for microwave absorption properties of Fe3O4 particles by symmetry top rotational molecular model. IOP Conf Ser-Mater Sci Eng 367: 012009. https://doi.org/10.1088/1757-899X/367/1/012009 doi: 10.1088/1757-899X/367/1/012009
|
| [9] |
Atay HY (2017) Multi-functional materials for military aircrafts; radar absorbing and flame retardant composites. RESM 3: 45-54. http://dx.doi.org/10.17515/resm2016.38ma0204 doi: 10.17515/resm2016.38ma0204
|
| [10] |
Feng J, Zong Y, Sun Y, et al. (2018) Optimization of porous FeNi3/N-GN composites with superior microwave absorption performance. Chem Eng J 345: 441-451. https://doi.org/10.1016/j.cej.2018.04.006 doi: 10.1016/j.cej.2018.04.006
|
| [11] |
Taufiq A, Bahtiar S, Saputro RE, et al. (2020) Fabrication of Mn1-xZnxFe2O4 ferrofluids from natural sand for magnetic sensors and radar absorbing materials. Heliyon 6: e04577. https://doi.org/10.1016/j.heliyon.2020.e04577 doi: 10.1016/j.heliyon.2020.e04577
|
| [12] |
Taufiq A, Sutiami R, Subadra SU, et al. (2020) Radar absorption performance of Fe3O4/AC/PANI nanocomposites prepared from natural iron sand. Int J Eng 33: 304-313. https://doi.org/10.5829/ije.2020.33.02b.15 doi: 10.5829/ije.2020.33.02b.15
|
| [13] |
Li F, Zhuang L, Zhan W, et al. (2020) Desirable microwave absorption performance of ZnFe2O4@ZnO@rGO nanocomposites based on controllable permittivity and permeability. Ceram Int 46: 21744-21751. https://doi.org/10.1016/j.ceramint.2020.05.283 doi: 10.1016/j.ceramint.2020.05.283
|
| [14] |
Andreev VG, Menshova SB, Klimov AN, et al. (2015) The influence of basic composition and microstructures on the properties of Ni-Zn ferrite radio-absorbing materials. J Magn Magn Mater 393: 569-573. https://doi.org/10.1016/j.jmmm.2015.06.030 doi: 10.1016/j.jmmm.2015.06.030
|
| [15] |
Sano E, Akiba E (2014) Electromagnetic absorbing materials using nonwoven fabrics coated with multi-walled carbon nanotubes. Carbon 78: 463-468. https://doi.org/10.1016/j.carbon.2014.07.027 doi: 10.1016/j.carbon.2014.07.027
|
| [16] |
Wei S, Yan R, Shi B, et al. (2019) Characterization of flexible radar-absorbing materials based on ferromagnetic nickel micron-fibers. J Ind Text 49: 58-70. https://doi.org/10.1177/1528083718772304 doi: 10.1177/1528083718772304
|
| [17] |
Rahmawati R, Melati A, Taufiq A, et al. (2017) Preparation of MWCNT-Fe3O4 nanocomposites from iron sand using sonochemical route. IOP Conf Ser-Mater Sci Eng 202: 012013. https://doi.org/10.1088/1757-899X/202/1/012013 doi: 10.1088/1757-899X/202/1/012013
|
| [18] |
Sui M, Fu T, Sun X, et al. (2018) Unary and binary doping effect of M2+ (M = Mn, Co, Ni, Zn) substituted hollow Fe3O4 approach for enhancing microwave attenuation. Ceram Int 44: 17138-17146. https://doi.org/10.1016/j.ceramint.2018.06.167 doi: 10.1016/j.ceramint.2018.06.167
|
| [19] |
Tian C, Du Y, Cui C, et al. (2017) Synthesis and microwave absorption enhancement of yolk-shell Fe3O4@C microspheres. J Mater Sci 52: 6349-6361. https://doi.org/10.1007/s10853-017-0866-3 doi: 10.1007/s10853-017-0866-3
|
| [20] |
Jian X, Wu B, Wei Y, et al. (2016) Facile synthesis of Fe3O4/GCs composites and their enhanced microwave absorption properties. ACS Appl Mater Interfaces 8: 6101-6109. https://doi.org/10.1021/acsami.6b00388 doi: 10.1021/acsami.6b00388
|
| [21] |
Taufiq A, Giri E, Putra R, et al. (2015) Nanoscale clustering and magnetic properties of MnxFe3-xO4 particles prepared from natural magnetite. J Supercond Nov Magn 28: 2855-2863. https://doi.org/10.1007/s10948-015-3111-9 doi: 10.1007/s10948-015-3111-9
|
| [22] |
Sunaryono S, Hidayat MF, Mufti N, et al. (2020) The effect of Mn doping on nano structure and magnetic properties of MnxFe3-xO4-PEG/PVP/PVA based ferrogel. J Polym Res 27: 1-10. https://doi.org/10.1007/s10965-020-02065-w doi: 10.1007/s10965-020-02065-w
|
| [23] |
Vamvakidis K, Katsikini M, Vourlias G, et al. (2015) Composition and hydrophilicity control of Mn-doped ferrite (MnxFe3-xO4) nanoparticles induced by polyol differentiation. Dalt Trans 44: 5396-5406. https://doi.org/10.1039/C5DT00212E doi: 10.1039/C5DT00212E
|
| [24] |
Jouyandeh M, Ganjali MR, Seidi F, et al. (2020) Nonisothermal cure kinetics of epoxy/polyvinylpyrrolidone functionalized superparamagnetic nano-Fe3O4 composites: Effect of Zn and Mn doping. J Compos Sci 4: 55. https://doi.org/10.3390/jcs4020055 doi: 10.3390/jcs4020055
|
| [25] |
Mohanty D, Mallick P, Biswal SK, et al. (2020) Investigation of structural, dielectric and electrical properties of ZnFe2O4 composite. Mater Today Proc 33: 4971-4975. https://doi.org/10.1016/j.matpr.2020.02.827 doi: 10.1016/j.matpr.2020.02.827
|
| [26] |
Saha P, Rakshit R, Mandal K (2019) Enhanced magnetic properties of Zn doped Fe3O4 nano hollow spheres for better bio-medical applications. J Magn Magn Mater 475: 130-136. https://doi.org/10.1016/j.jmmm.2018.11.061 doi: 10.1016/j.jmmm.2018.11.061
|
| [27] |
Zhang Y, Wu Y, Qin Q, et al. (2016) A study of the mechanism of microwave-assisted ball milling preparing ZnFe2O4. J Magn Magn Mater 409: 6-9. https://doi.org/10.1016/j.jmmm.2016.02.066 doi: 10.1016/j.jmmm.2016.02.066
|
| [28] |
Modaresi N, Afzalzadeh R, Aslibeiki B, et al. (2017) Competition between the impact of cation distribution and crystallite size on properties of MnxFe3-xO4 nanoparticles synthesized at room temperature. Ceram Int 43: 15381-15391. https://doi.org/10.1016/j.ceramint.2017.08.079 doi: 10.1016/j.ceramint.2017.08.079
|
| [29] |
Taufiq A, Yuliantika D, Sunaryono S, et al. (2018) Nanopowder and magnetic fluid synthesis of Zn0.2Fe2.8O4 particles and their structural and magnetic behaviors. J Phys-Conf Ser 1091: 012030. https://doi.org/10.1088/1742-6596/1091/1/012030 doi: 10.1088/1742-6596/1091/1/012030
|
| [30] |
Daoush WM (2017) Co-Precipitation and magnetic properties of magnetite nanoparticles for potential biomedical applications. J Nanomedicine Res 5: 00118. https://doi.org/10.15406/jnmr.2017.05.00118 doi: 10.15406/jnmr.2017.05.00118
|
| [31] |
Taufiq A, Bahtiar S, Hidayat N, et al. (2017) Preparation of superparamagnetic Zn0.5Mn0.5Fe2O4 particle by coprecipitation-sonochemical method for radar absorbing material. IOP Conf Ser-Mater Sci Eng 202: 012024. https://doi.org/10.1088/1757-899X/202/1/012024 doi: 10.1088/1757-899X/202/1/012024
|
| [32] |
Rahmawati R, Taufiq A, Sunaryono S, et al. (2018) Synthesis of magnetite (Fe3O4) nanoparticles from Iron sands by coprecipitation-ultrasonic irradiation methods. J Mater Environ Sci 9: 155-160. https://doi.org/10.26872/jmes.2018.9.1.19 doi: 10.26872/jmes.2018.9.1.19
|
| [33] |
Sunaryono, Taufiq A, Mashuri, et al. (2015) Various magnetic properties of magnetite nanoparticles synthesized from iron-sands by coprecipitation method at room temperature. Mater Sci Forum 827: 229-234. https://doi.org/10.4028/www.scientific.net/MSF.827.229 doi: 10.4028/www.scientific.net/MSF.827.229
|
| [34] |
Jouyandeh M, Paran SMR, Khadem SSM, et al. (2020) Nonisothermal cure kinetics of epoxy/MnxFe3-xO4 nanocomposites. Prog Org Coatings 140: 105505. https://doi.org/10.1016/j.porgcoat.2019.105505 doi: 10.1016/j.porgcoat.2019.105505
|
| [35] |
Li M, Gao Q, Wang T, et al. (2016) Solvothermal synthesis of MnxFe3-xO4 nanoparticles with interesting physicochemical characteristics and good catalytic degradation activity. JMADE 97: 341-348. https://doi.org/10.1016/j.matdes.2016.02.103 doi: 10.1016/j.matdes.2016.02.103
|
| [36] |
Luo J, Shen P, Yao W, et al. (2016) Synthesis, characterization, and microwave absorption properties of reduced graphene oxide/strontium ferrite/polyaniline nanocomposites. Nanoscale Res Lett 11: 141. https://doi.org/10.1186/s11671-016-1340-x doi: 10.1186/s11671-016-1340-x
|
| [37] |
Liu P, Yao Z, Zhou J (2016) Fabrication and microwave absorption of reduced graphene oxide/Ni0.4Zn0.4Co0.2Fe2O4 nanocomposites. Ceram Int 42: 9241-9249. https://doi.org/10.1016/j.ceramint.2016.03.026 doi: 10.1016/j.ceramint.2016.03.026
|
| [38] |
Saeed MS, Seyed-yazdi J, Hekmatara H (2020) Fe2O3/Fe3O4/PANI/MWCNT nanocomposite with the optimum amount and uniform orientation of Fe2O3/Fe3O4 NPs in polyaniline for high microwave absorbing performance. J Alloys Compd 843: 156052. https://doi.org/10.1016/j.jallcom.2020.156052 doi: 10.1016/j.jallcom.2020.156052
|
| [39] |
Zhao C, Shen M, Li Z, et al. (2016) Green synthesis and enhanced microwave absorption property of reduced graphene oxide-SrFe12O19 nanocomposites. J Alloys Compd 689: 1037-1043. https://doi.org/10.1016/j.jallcom.2016.08.078 doi: 10.1016/j.jallcom.2016.08.078
|
| [40] |
Wang X, Zhang B, Zhang W, et al. (2017) Super-light Cu@Ni nanowires/graphene oxide composites for significantly enhanced microwave absorption performance. Sci Rep 7: 1-13. https://doi.org/10.1038/s41598-017-01529-2 doi: 10.1038/s41598-017-01529-2
|
| [41] | Luo J, Zuo Y, Shen P, et al. (2017) Excellent microwave absorption properties by tuned electromagnetic parameters in polyaniline-coated Ba0.9La0.1Fe11.9Ni0.1O19/reduced graphene oxide nanocomposites. RSC Adv 7: 36433-36443. https://doi.org/10.1039/C7RA06800J |
| [42] |
Ma J, Wang X, Cao W, et al. (2018) A facile fabrication and highly tunable microwave absorption of 3D flower-like Co3O4-rGO hybrid-architectures. Chem Eng J 339: 487-498. https://doi.org/10.1016/j.cej.2018.01.152 doi: 10.1016/j.cej.2018.01.152
|
| [43] |
Wardhani MK, Astuti F, Darminto D (2016) Study on physical properties of reduced graphene oxide from heating coconut shell. JPSE 1: 1-6. https://doi.org/10.17977/um024v1i12016p001 doi: 10.17977/um024v1i12016p001
|
| [44] |
Ogino I, Fukazawa G, Kamatari S, et al. (2018) The critical role of bulk density of graphene oxide in tuning its defect concentration through microwave-driven annealing. J Energy Chem 27: 1468-1474. https://doi.org/10.1016/j.jechem.2017.09.010 doi: 10.1016/j.jechem.2017.09.010
|
| [45] |
Shu R, Li W, Zhou X, et al. (2018) Facile preparation and microwave absorption properties of RGO/MWCNTs/ZnFe2O4 hybrid nanocomposites. J Alloys Compd 743: 163-174. https://doi.org/10.1016/j.jallcom.2018.02.016 doi: 10.1016/j.jallcom.2018.02.016
|
| [46] |
Li HY, Kouh T, Shim IB, et al. (2012) Investigation of cation distribution in single crystalline Fe3-xMnxO4 microspheres based on Mö ssbauer spectroscopy. J Appl Phys 111: 07B544. https://doi.org/10.1063/1.3687007 doi: 10.1063/1.3687007
|
| [47] |
Acharya S, Alegaonkar P, Datar S (2019) Effect of formation of heterostructure of SrAl4Fe8O19/RGO/PVDF on the microwave absorption properties of the composite. Chem Eng J 374: 144-154. https://doi.org/10.1016/j.cej.2019.05.078 doi: 10.1016/j.cej.2019.05.078
|
| [48] |
Lavin-lopez MP, Paton-carrero A, Sanchez-silva L, et al. (2017) Influence of the reduction strategy in the synthesis of reduced graphene oxide. Adv Powder Technol 28: 3195-3203. https://doi.org/10.1016/j.apt.2017.09.032 doi: 10.1016/j.apt.2017.09.032
|
| [49] |
Oberdick SD, Abdelgaw A, Moya C, et al. (2018) Spin canting across core/shell Fe3O4/MnxFe3-xO4 nanoparticles. Sci Rep 8: 1-12. https://doi.org/10.1038/s41598-018-21626-0 doi: 10.1038/s41598-018-21626-0
|
| [50] |
Korsakova AS, Kotsikau DA, Haiduk YS, et al. (2020) Synthesis and physicochemical properties of MnxFe3-xO4 solid solutions. Condens Matter Interphases 22: 466-472. https://doi.org/10.17308/kcmf.2020.22/3076 doi: 10.17308/kcmf.2020.22/3076
|
| [51] |
Amighian J, Karimzadeh E, Mozaffari M (2013) The effect of Mn2+ substitution on magnetic properties of MnxFe3-xO4 nanoparticles prepared by coprecipitation method. J Magn Magn Mater 332: 157-162. https://doi.org/10.1016/j.jmmm.2012.12.005 doi: 10.1016/j.jmmm.2012.12.005
|
| [52] |
Yang X, Niu Y, Li Q, et al. (2018) The influence of fabrication methods on structure and microwave absorption property of Fe3O4/rGO composites. J Supercond Nov Magn 31: 2841-2849. https://doi.org/10.1007/s10948-017-4552-0 doi: 10.1007/s10948-017-4552-0
|
| [53] |
Wickham DG (1969) The chemical composition of spinels in the system Fe3O4Mn3O4. J Inorg Nucl Chem 31: 313-320. https://doi.org/10.1016/0022-1902(69)80474-4 doi: 10.1016/0022-1902(69)80474-4
|
| [54] |
Taufiq A, Sunaryono, Putra EGR, et al. (2015) Nano-structural studies on Fe3O4 particles dispersing in a magnetic fluid using X-ray diffractometry and small-angle neutron scattering. Mater Sci Forum 827: 213-218. https://doi.org/10.4028/www.scientific.net/MSF.827.213 doi: 10.4028/www.scientific.net/MSF.827.213
|
| [55] |
Rowley-Neale SJ, Randviir EP, Abo Dena AS, et al. (2018) An overview of recent applications of reduced graphene oxide as a basis of electroanalytical sensing platforms. Appl Mater Today 10: 218-226. https://doi.org/10.1016/j.apmt.2017.11.010 doi: 10.1016/j.apmt.2017.11.010
|
| [56] |
Smith AT, LaChance AM, Zeng S, et al. (2019) Synthesis, properties, and applications of graphene oxide/reduced graphene oxide and their nanocomposites. Nano Mater Sci 1: 31-47. https://doi.org/10.1016/j.nanoms.2019.02.004 doi: 10.1016/j.nanoms.2019.02.004
|
| [57] |
Wang Y, Gao X, Wu X, et al. (2018) Hierarchical ZnFe2O4@RGO@CuS composite: Strong absorption and wide-frequency absorption properties. Ceram Int 44: 9816-9822. https://doi.org/10.1016/j.ceramint.2018.02.220 doi: 10.1016/j.ceramint.2018.02.220
|
| [58] |
Ding Y, Zhang L, Liao Q, et al. (2016) Electromagnetic wave absorption in reduced graphene oxide functionalized with Fe3O4/Fe nanorings. Nano Res 9: 2018-2025. https://doi.org/10.1007/s12274-016-1092-z doi: 10.1007/s12274-016-1092-z
|
| [59] |
Daisuke K, Sugano S, Kosugi Y, et al. (2019) Selective growth of α-Fe2O3, γ-Fe2O3 and Fe3O4 at low-temperatures and under ambient pressure. Jpn J Appl Phys 58: 095504. https://doi.org/10.7567/1347-4065/ab39d1 doi: 10.7567/1347-4065/ab39d1
|
| [60] |
Kakavandi B, Jonidi A, Rezaei R, et al. (2013) Synthesis and properties of Fe3O4-activated carbon magnetic nanoparticles for removal of aniline from aqueous solution: equilibrium, kinetic and thermodynamic studies. Iranian J Environ Health Sci Eng 10: 19. https://doi.org/10.1186/1735-2746-10-19 doi: 10.1186/1735-2746-10-19
|
| [61] |
Juang RS, Yei YC, Liao CS, et al. (2018) Synthesis of magnetic Fe3O4/activated carbon nanocomposites with high surface area as recoverable adsorbents. J Taiwan Inst Chem Eng 90: 51-60. https://doi.org/10.1016/j.jtice.2017.12.005 doi: 10.1016/j.jtice.2017.12.005
|
| [62] |
Bagheri S, Muhd Julkapli N, Bee Abd Hamid S (2015) Functionalized activated carbon derived from biomass for photocatalysis applications perspective. Int J Photoenergy 2015: 1-30. https://doi.org/10.1155/2015/218743 doi: 10.1155/2015/218743
|
| [63] |
Olad A, Gharekhani H (2016) Study on the capacitive performance of polyaniline/activated carbon nanocomposite for supercapacitor application. J Polym Res 23: 147. https://doi.org/10.1007/s10965-016-1031-4 doi: 10.1007/s10965-016-1031-4
|
| [64] |
Yin P, Deng Y, Zhang L, et al. (2018) Facile synthesis and microwave absorption investigation of activated carbon@Fe3O4 composites in the lowfrequency band. RSC Adv 8: 23048-23057. https://doi.org/10.1039/C8RA04141E doi: 10.1039/C8RA04141E
|
| [65] |
Yin P, Deng Y, Zhang L, et al. (2018) The microwave absorbing properties of ZnO/Fe3O4/paraffin composites in low-frequency band. Mater Res Express 2: 026109. https://doi.org/10.1088/2053-1591/aaae58 doi: 10.1088/2053-1591/aaae58
|
| [66] |
Wang Z, Wu L, Zhou J, et al. (2014) Chemoselectivity-induced multiple interfaces in MWCNT/Fe3O4@ZnO heterotrimers for whole X-band microwave absorption. Nanoscale 6: 12298-12302. https://doi.org/10.1039/C4NR03040K doi: 10.1039/C4NR03040K
|
| [67] |
Shu R, Zhang G, Zhang J, et al. (2018) Fabrication of reduced graphene oxide/multi-walled carbon nanotubes/zinc ferrite hybrid composites as high-performance microwave absorbers. J Alloys Compd 736: 1-11. https://doi.org/10.1016/j.jallcom.2017.11.084 doi: 10.1016/j.jallcom.2017.11.084
|
| [68] |
Jian X, Wu B, Wei Y, et al. (2016) Facile synthesis of Fe3O4/GCs composites and their enhanced microwave absorption properties. ACS Appl Mater Interfaces 8: 6101-6109. https://doi.org/10.1021/acsami.6b00388 doi: 10.1021/acsami.6b00388
|
| [69] |
Salem DMSA, Ismail MM, Aly-Eldeen MA (2019) Biogenic synthesis and antimicrobial potency of iron oxide (Fe3O4) nanoparticles using algae harvested from the Mediterranean Sea, Egypt. Egypt J Aquat Res 45: 197-204. https://doi.org/10.1016/j.ejar.2019.07.002 doi: 10.1016/j.ejar.2019.07.002
|
| [70] |
Tajik S, Askari MB, Ahmadi SA, et al. (2022) Electrochemical sensor based on ZnFe2O4/RGO nanocomposite for ultrasensitive detection of hydrazine in real samples. Nanomaterials 12: 491. https://doi.org/10.3390/nano12030491 doi: 10.3390/nano12030491
|
| [71] |
Cao WQ, Wang XX, Yuan J, et al. (2015) Temperature dependent microwave absorption of ultrathin graphene composites. J Mater Chem C 3: 10017-10022. http://dx.doi.org/10.1039/C5TC02185E doi: 10.1039/C5TC02185E
|
| [72] |
Qiao Y, Xiao J, Jia Q, et al. (2019) Preparation and microwave absorption properties of ZnFe2O4/polyaniline/graphene oxide composite. Results Phys 13: 102221. https://doi.org/10.1016/j.rinp.2019.102221 doi: 10.1016/j.rinp.2019.102221
|
| [73] |
Cao M, Wang X, Cao W, et al. (2018) Thermally driven transport and relaxation switching self-powered electromagnetic energy conversion. Small 14: 1800987. https://doi.org/10.1002/smll.201800987 doi: 10.1002/smll.201800987
|
| [74] |
Shu R, Zhang J, Guo C, et al. (2020) Facile synthesis of nitrogen-doped reduced graphene oxide/nickel-zinc ferrite composites as high-performance microwave absorbers in the X-band. Chem Eng J 384: 123266. https://doi.org/10.1016/j.cej.2019.123266 doi: 10.1016/j.cej.2019.123266
|
| [75] |
Chen C, Xi J, Zhou E, et al. (2017) Porous graphene microflowers for high-performance microwave absorption. Nano-Micro Lett 10: 26. https://doi.org/10.1007/s40820-017-0179-8 doi: 10.1007/s40820-017-0179-8
|
| [76] |
Wen B, Cao MS, Hou ZL, et al. (2013) Temperature dependent microwave attenuation behavior for carbon-nanotube/silica composites. Carbon N Y 65: 124-139. https://doi.org/10.1016/j.carbon.2013.07.110 doi: 10.1016/j.carbon.2013.07.110
|
| [77] |
Liang LL, Song G, Liu Z, et al. (2020) Constructing Ni12P5/Ni2P heterostructures to boost interfacial polarization for enhanced microwave absorption performance. ACS Appl Mater Interfaces 12: 52208-52220. https://doi.org/10.1021/acsami.0c16287 doi: 10.1021/acsami.0c16287
|
| [78] |
Ding J, Wang L, Zhao Y, et al. (2019) Boosted interfacial polarization from multishell TiO2@Fe3O4@PPy heterojunction for eenhanced microwave absorption. Small 15: 1902885. https://doi.org/10.1002/smll.201902885 doi: 10.1002/smll.201902885
|
| [79] |
Jabir MS, Nayef UM, Abdulkadhim WK, et al. (2019) Supermagnetic Fe3O4-PEG nanoparticles combined with NIR laser and alternating magnetic field as potent anti-cancer agent against human ovarian cancer cells. Mater Res Express 6: 115412. https://doi.org/10.1088/2053-1591/ab50a0 doi: 10.1088/2053-1591/ab50a0
|
| [80] |
Idris F, Hashim M, Abbas Z, et al. (2016) Recent developments of smart electromagnetic absorbers based polymer-composites at gigahertz frequencies. J Magn Magn Mater 405: 197-208. https://doi.org/10.1016/j.jmmm.2015.12.070 doi: 10.1016/j.jmmm.2015.12.070
|
| [81] |
Sun D, Zou Q, Wang Y, et al. (2014) Controllable synthesis of porous Fe3O4@ZnO sphere decorated graphene for extraordinary electromagnetic wave absorption. Nanoscale 6: 6557-6562. https://doi.org/10.1039/C3NR06797A doi: 10.1039/C3NR06797A
|
| [82] | Yotsomnuk P, Skolpap W (2017) Biofuel production from waste virgin coconut oil by hydrocracking over HZSM-5 zeolite. IJASET 5: 54-57. Available from: http://ijaseat.iraj.in/paper_detail.php?paper_id=7992 |
| [83] |
Al-Muttaqii M, Kurniawansyah F, Prajitno DH, et al. (2019) Bio-kerosene and bio-gasoil from coconut oils via hydrocracking process over Ni-Fe/HZSM-5 catalyst. Bull Chem React Eng Catal 14: 309-319. https://doi.org/10.9767/bcrec.14.2.2669.309-319 doi: 10.9767/bcrec.14.2.2669.309-319
|
| [84] |
Nouri Parouch A, Koukabi N, Abdous E (2020) Tetrazole derivatives synthesis using Fe3O4@fibroin-SO3H as a magnetically separable green solid acid nanocatalyst under solvent-free conditions. Res Chem Intermed 46: 3295-3310. https://doi.org/10.1007/s11164-020-04131-w doi: 10.1007/s11164-020-04131-w
|
| [85] |
Mostafatabar AH, Bahlakeh G, Ramezanzadeh B (2022) Novel bi-functional RGO-HPSE-Zn@epoxy nanocomposite with superior corrosion protection potency. J Ind Eng Chem 108: 28-46. https://doi.org/10.1016/j.jiec.2021.12.022 doi: 10.1016/j.jiec.2021.12.022
|


Figures(9) / Tables(3)

Yana Fajar Prakasa, Sumari Sumari, Aman Santoso, Muhammad Roy Asrori, Ririn Cahyanti. The performance of radar absorption of MnxFe3–xO4/rGO nanocomposites prepared from iron sand beach and coconut shell waste[J]. AIMS Materials Science, 2023, 10(2): 227-248. doi: 10.3934/matersci.2023013


 DownLoad: