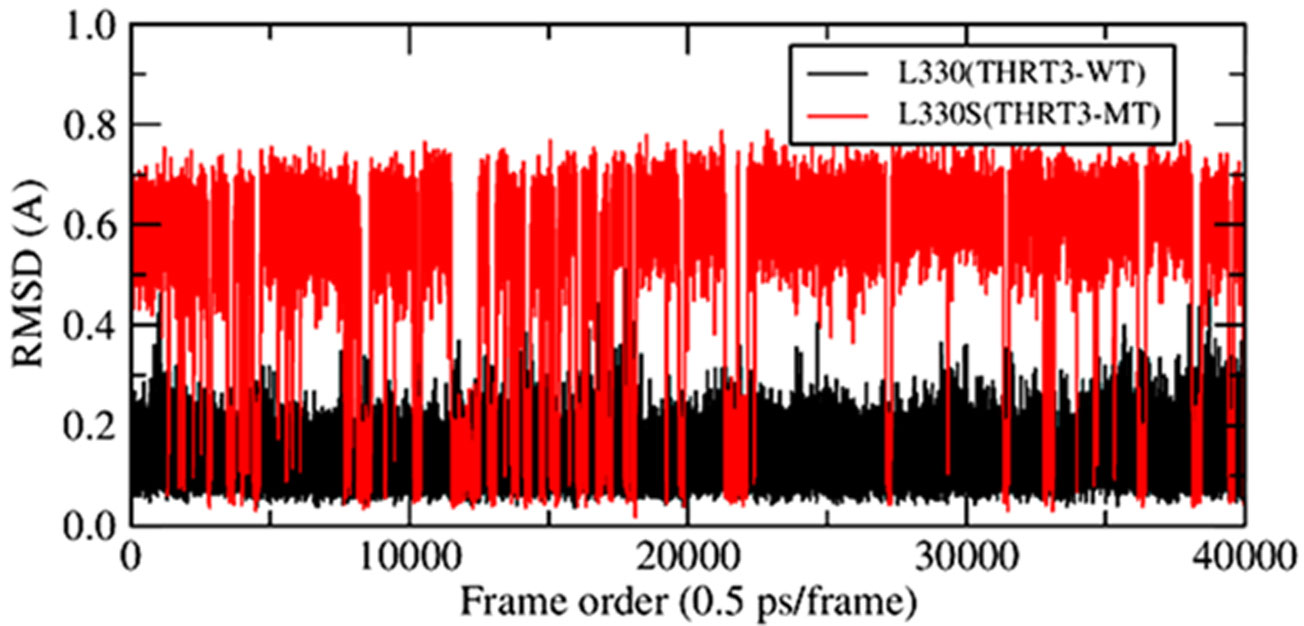
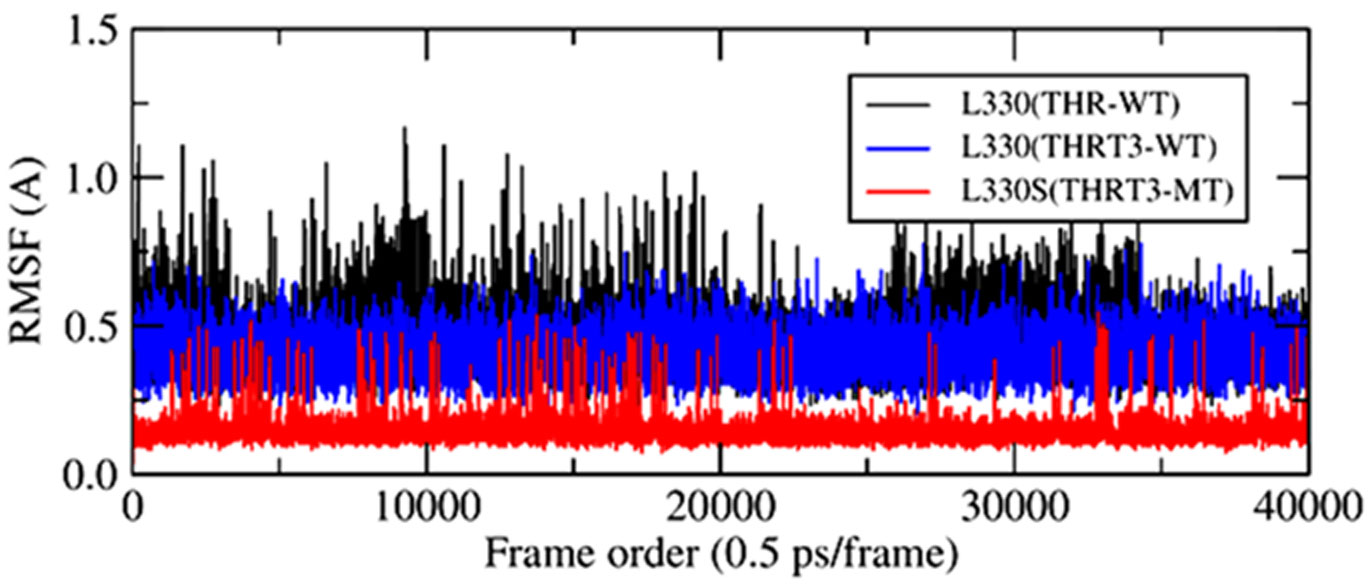
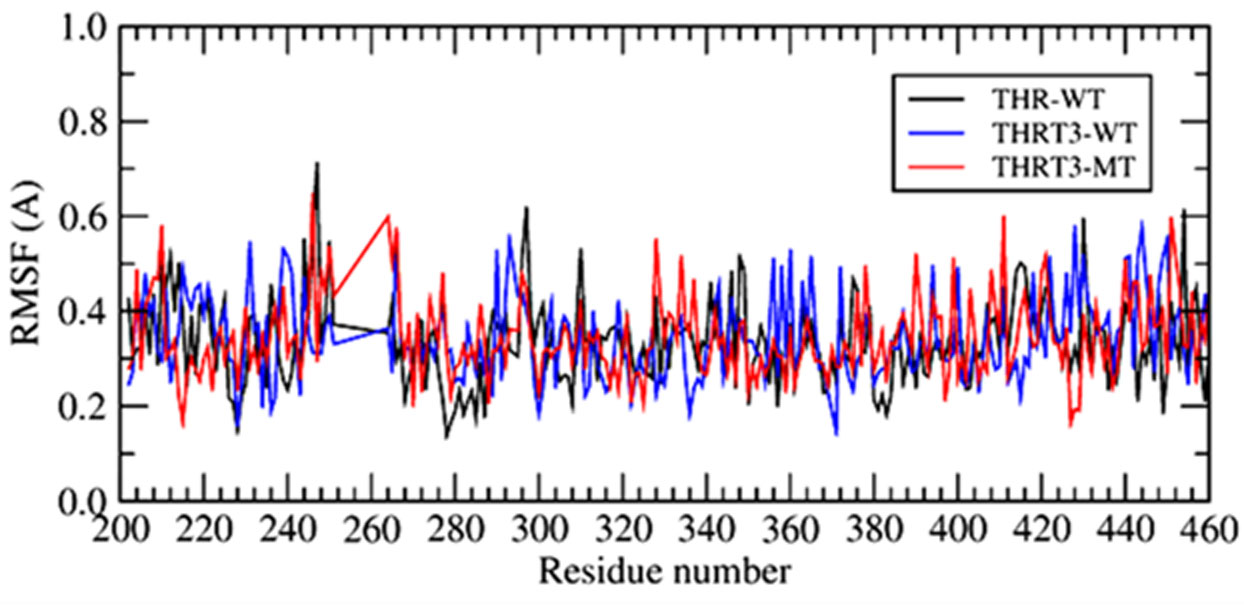
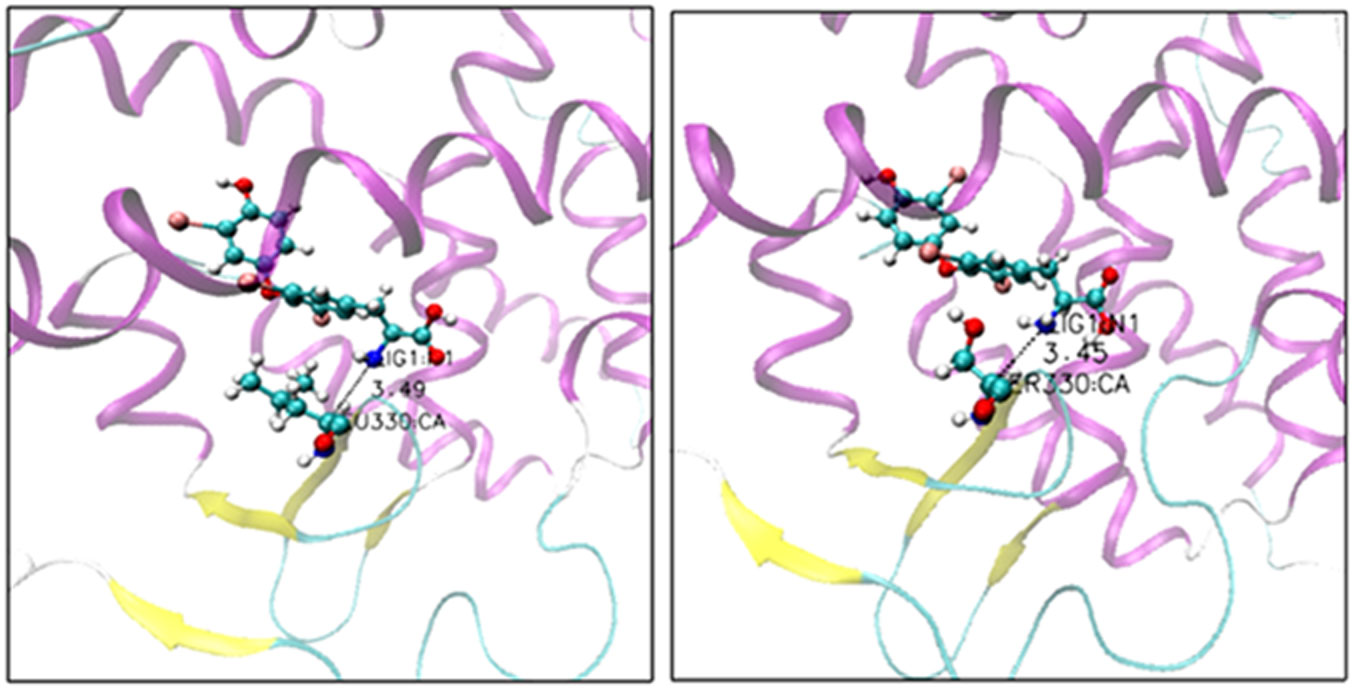
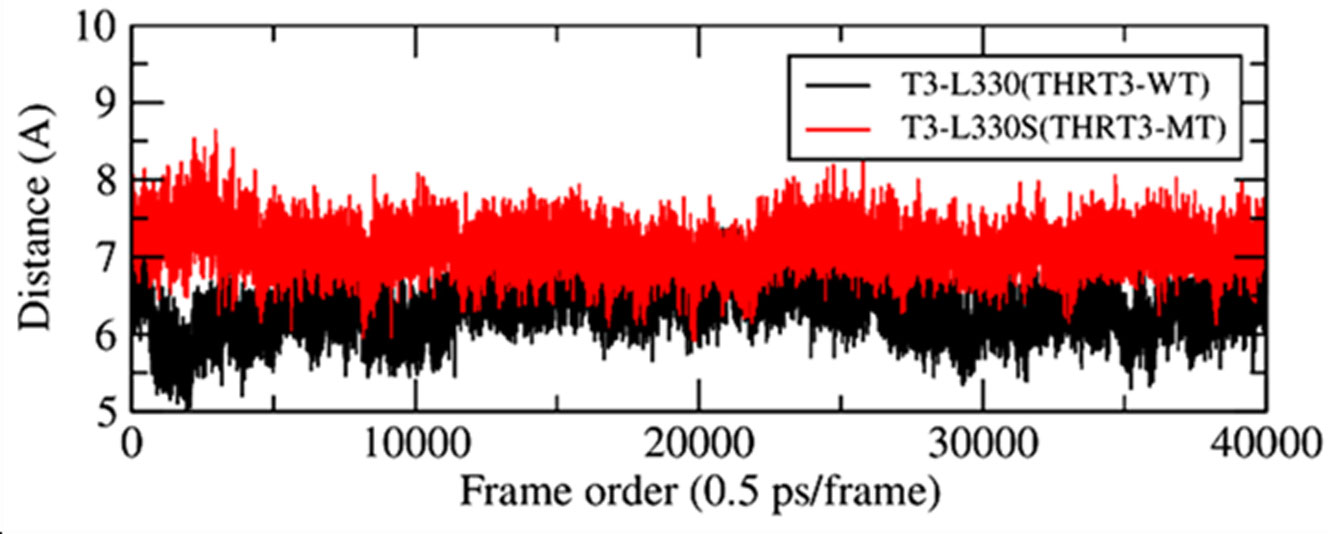
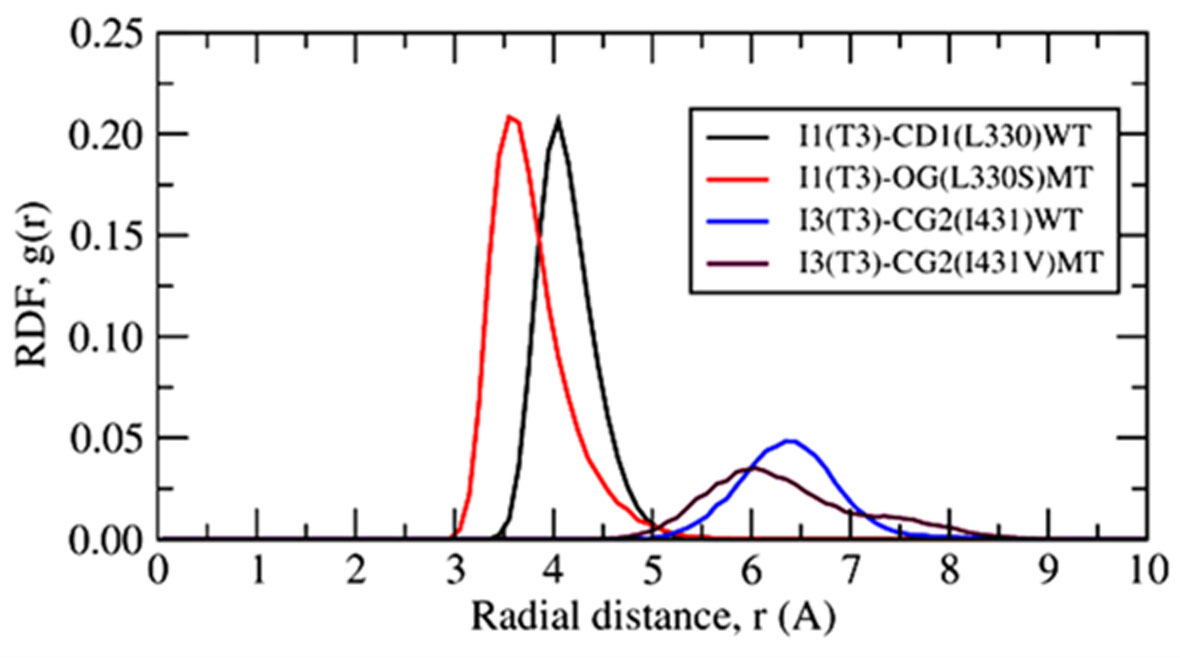
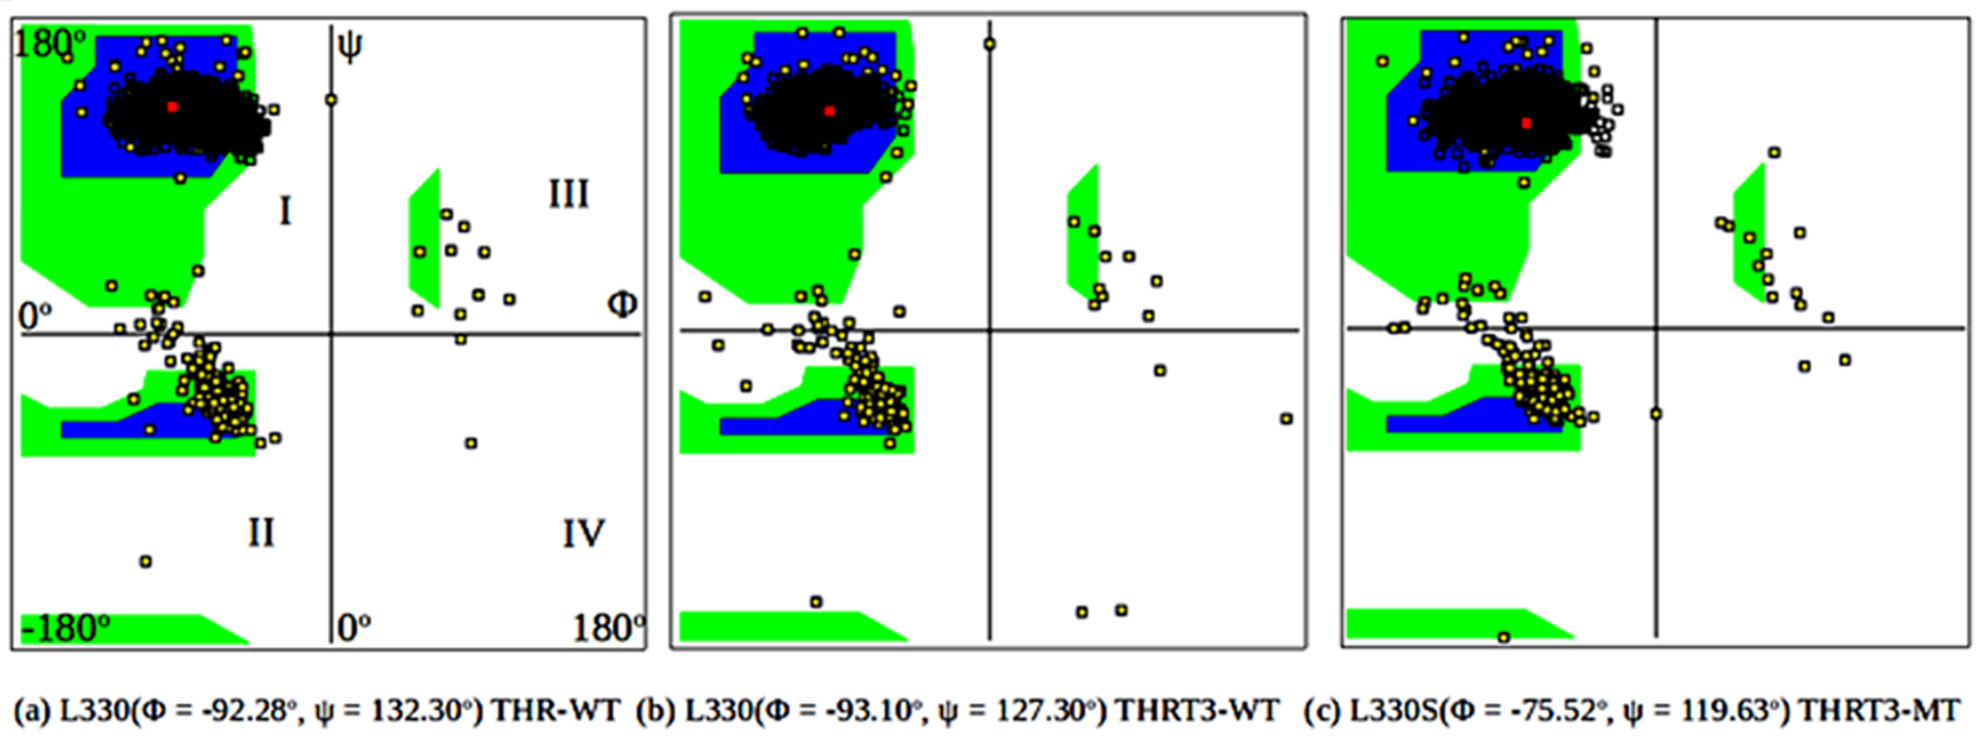
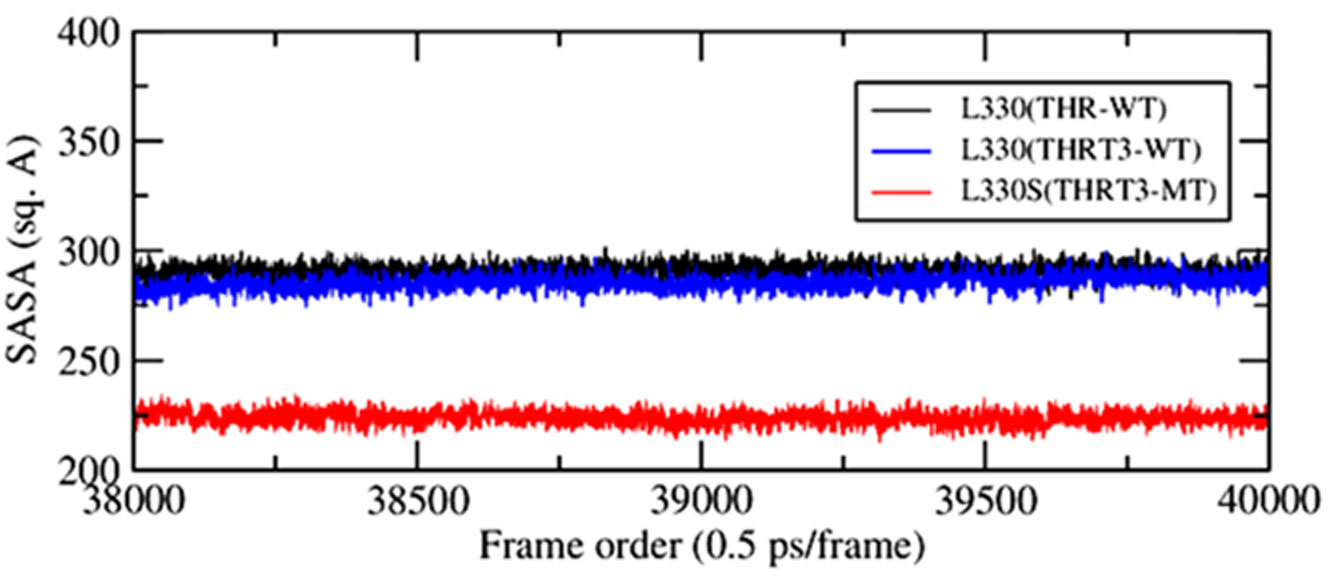
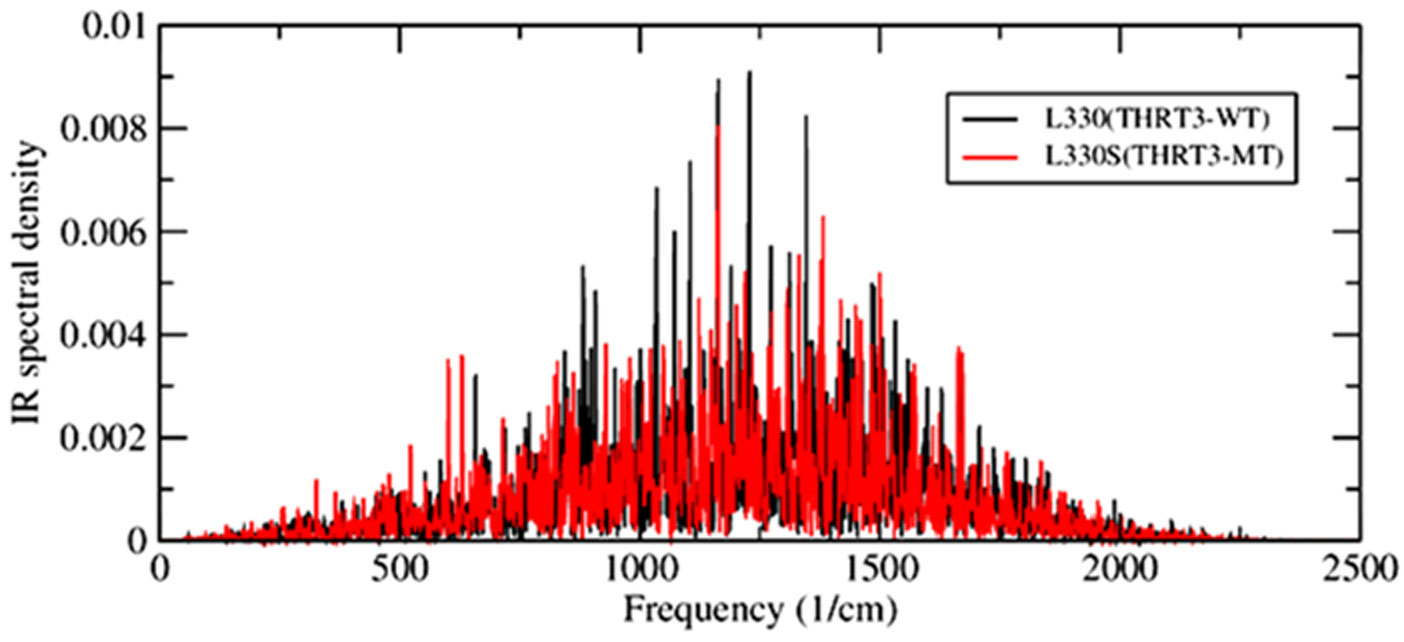
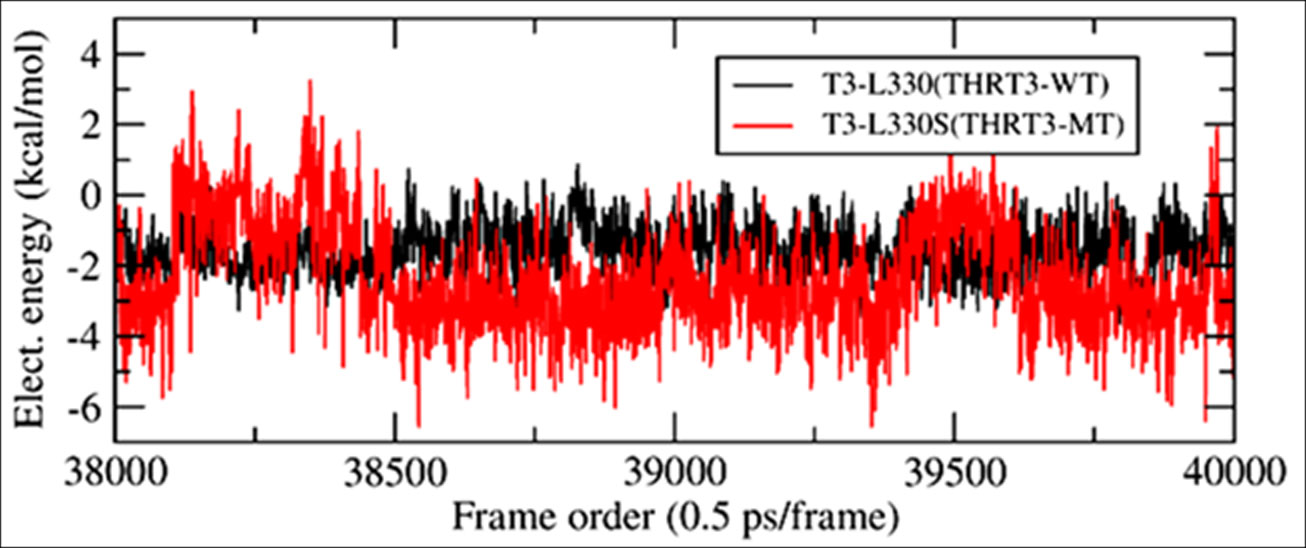
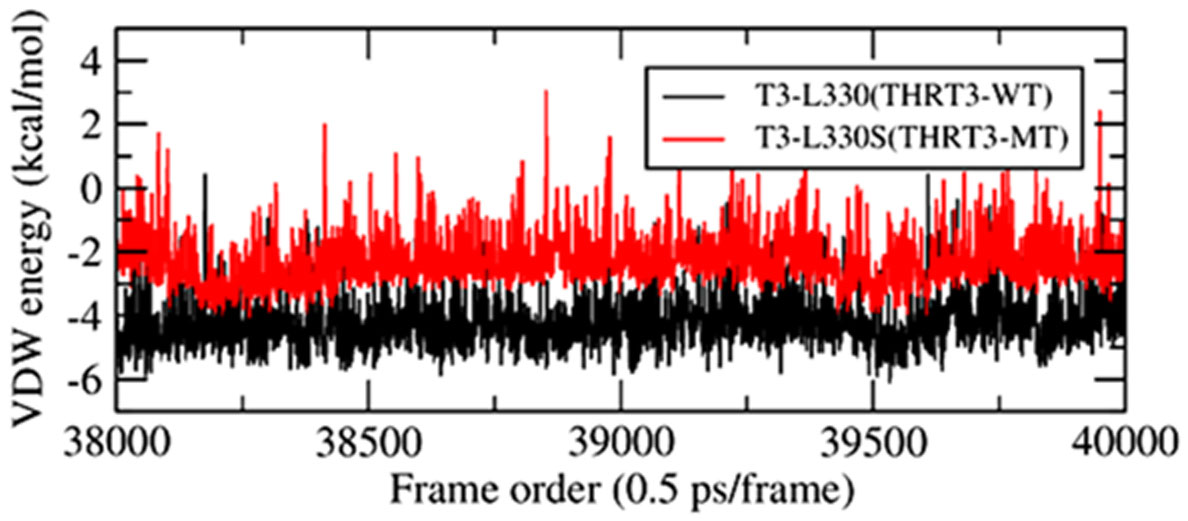
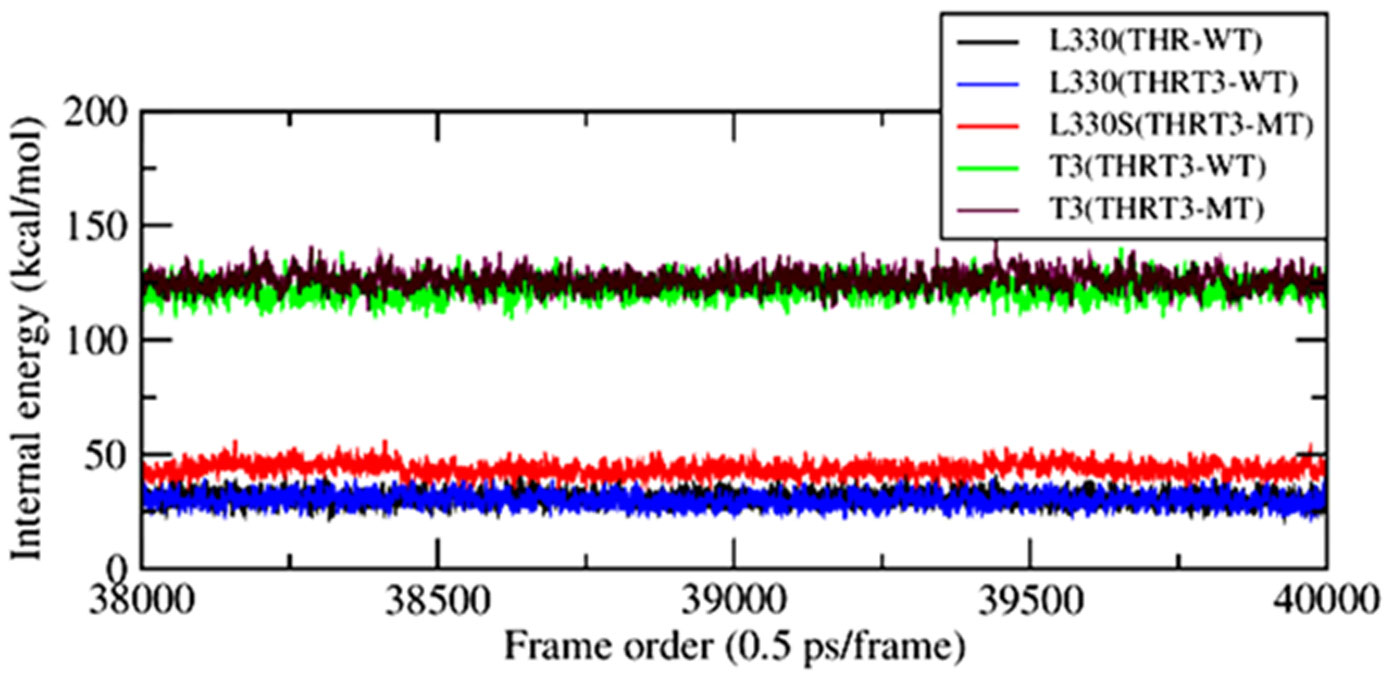
The point mutations like L330S in the ligand binding domain (LBD) of thyroid hormone receptor-beta (THR-β) make the structural changes as reflected by Ramachandran plots, solvent accessible surface area, radial distribution functions, root mean square deviations and fluctuations, and interaction and internal energies of the LBD residues. By using nanoscale molecular dynamics (NAMD) simulations, the structural features of T3 liganded, unliganded and mutated THR-β LBD are compared to explore the molecular insights in euthyroid, hypothyroid and resistance to thyroid hormones (RTH) states, respectively. The L330S-mutant causes steric hindrance while binding T3 into THR-β LBD causing RTH in the thyroid patients.
Citation: Tika Ram Lamichhane, Hari Prasad Lamichhane. Structural changes in thyroid hormone receptor-beta by T3 binding and L330S mutational interactions[J]. AIMS Biophysics, 2020, 7(1): 27-40. doi: 10.3934/biophy.2020003
The point mutations like L330S in the ligand binding domain (LBD) of thyroid hormone receptor-beta (THR-β) make the structural changes as reflected by Ramachandran plots, solvent accessible surface area, radial distribution functions, root mean square deviations and fluctuations, and interaction and internal energies of the LBD residues. By using nanoscale molecular dynamics (NAMD) simulations, the structural features of T3 liganded, unliganded and mutated THR-β LBD are compared to explore the molecular insights in euthyroid, hypothyroid and resistance to thyroid hormones (RTH) states, respectively. The L330S-mutant causes steric hindrance while binding T3 into THR-β LBD causing RTH in the thyroid patients.

| [1] |
Forrest D, Hanebuth E, Smeyne RJ, et al. (1996) Recessive resistance to thyroid hormone in mice lacking thyroid hormone receptor beta: evidence for tissue-specific modulation of receptor function. EMBO J 15: 3006-3015. doi: 10.1002/j.1460-2075.1996.tb00664.x

|
| [2] |
Lee JH, Kim EY (2014) Resistance to thyroid hormone due to a novel mutation of thyroid hormone receptor beta gene. Ann Pediatr Endocrinol Metab 19: 229. doi: 10.6065/apem.2014.19.4.229
|
| [3] |
El Shafie K, Ouhtit A, Al Farsi Y, et al. (2014) A rare thyroid hormone receptor beta (thrβ) gene mutation in a 15-year-old girl with thyroid hormone resistance syndrome: a case report. J Med Case Rep 8: 12. doi: 10.1186/1752-1947-8-12
|
| [4] | Safer JD, O'connor MG, Colan SD, et al. (1999) The thyroid hormone receptor-β gene mutation R383H is associated with isolated central resistance to thyroid hormone. J Clin Endocrinol Metab 84: 3099-3109. |
| [5] |
Machado DS, Sabet A, Santiago LA, et al. (2009) A thyroid hormone receptor mutation that dissociates thyroid hormone regulation of gene expression in vivo. Proc Natl Acad Sci 106: 9441-9446. doi: 10.1073/pnas.0903227106
|
| [6] |
Pohlenz J, Wildhardt G, Zabel B, et al. (1997) Resistance to thyroid hormone in a family caused by a new point mutation L330S in the thyroid receptor (TR) beta gene. Thyroid 7: 39-41. doi: 10.1089/thy.1997.7.39
|
| [7] |
Ditudompo S, Ongphiphadhanakul B, Chanprasertyotin S, et al. (1999) A de novo L330S point mutation in thyroid hormone receptor beta gene in a Thai female with resistance to thyroid hormone. Endocrine J 46: 825-829. doi: 10.1507/endocrj.46.825
|
| [8] |
Khan FI, Aamir M, Wei DQ, et al. (2017) Molecular mechanism of Ras-related protein Rab-5A and effect of mutations in the catalytically active phosphate-binding loop. J Biomol Struct Dyn 35: 105-118. doi: 10.1080/07391102.2015.1134346
|
| [9] |
Rajendran V, Purohit R, Sethumadhavan R (2012) In silico investigation of molecular mechanism of laminopathy caused by a point mutation (R482W) in lamin A/C protein. Amino Acids 43: 603-615. doi: 10.1007/s00726-011-1108-7
|
| [10] |
Ausaf Ali S, Hassan I, Islam A, et al. (2014) A review of methods available to estimate solvent-accessible surface areas of soluble proteins in the folded and unfolded states. Curr Protein Pept Sci 15: 456-476. doi: 10.2174/1389203715666140327114232
|
| [11] |
Gromih MM, Oobatake M, Kono H, et al. (1999) Relationship between amino acid properties and protein stability: buried mutations. J Protein Chem 18: 565-578. doi: 10.1023/A:1020603401001
|
| [12] | Gromiha MM, Oobatake M, Kono H, et al. (2002) Importance of mutant position in Ramachandran plot for predicting protein stability of surface mutations. Biopolymers: Ori Res Biomol 64: 210-220. |
| [13] |
Zou J, Song B, Simmerling C, et al. (2016) Experimental and computational analysis of protein stabilization by Gly-to-d-Ala substitution: A convolution of native state and unfolded state effects. J Am Chem Soc 138: 15682-15689. doi: 10.1021/jacs.6b09511
|
| [14] |
Nascimento AS, Dias SMG, Nunes FM, et al. (2006) Structural rearrangements in the thyroid hormone receptor hinge domain and their putative role in the receptor function. J Mol Biol 360: 586-598. doi: 10.1016/j.jmb.2006.05.008
|
| [15] |
MacKerell AD, Feig M, Brooks CL (2004) Extending the treatment of backbone energetics in protein force fields: Limitations of gas-phase quantum mechanics in reproducing protein conformational distributions in molecular dynamics simulations. J Comput Chem 25: 1400-1415. doi: 10.1002/jcc.20065
|
| [16] |
MacKerell AD, Bashford D, Bellott M, et al. (1998) All-atom empirical potential for molecular modeling and dynamics studies of proteins. J Phys Chem B 102: 3586-3616. doi: 10.1021/jp973084f
|
| [17] |
Jorgensen WL, Chandrasekhar J, Madura JD, et al. (1983) Comparison of simple potential functions for simulating liquid water. J Chem Phys 79: 926-935. doi: 10.1063/1.445869
|
| [18] |
Zoete V, Cuendet MA, Grosdidier A, et al. (2011) SwissParam: a fast force field generation tool for small organic molecules. J Comput Chem 32: 2359-2368. doi: 10.1002/jcc.21816
|
| [19] |
Phillips JC, Braun R, Wang W, et al. (2005) Scalable molecular dynamics with NAMD. J Comput Chem 26: 1781-1802. doi: 10.1002/jcc.20289
|
| [20] |
Humphrey W, Dalke A, Schulten K (1996) VMD—visual molecular dynamics. J Mol Graphics 14: 33-38. doi: 10.1016/0263-7855(96)00018-5
|
| [21] |
Feller SE, Zhang Y, Pastor RW, et al. (1995) Constant pressure molecular dynamics simulation: the Langevin piston method. J Chem Phys 103: 4613-4621. doi: 10.1063/1.470648
|
| [22] |
Bussi G, Donadio D, Parrinello M (2007) Canonical sampling through velocity rescaling. J Chem Phys 126: 014101-014107. doi: 10.1063/1.2408420
|
| [23] |
Hardy DJ, Wu Z, Phillips JC, et al. (2015) Multilevel summation method for electrostatic force evaluation. J Chem theory Comput 11: 766-779. doi: 10.1021/ct5009075
|
| [24] |
Verlet L (1967) Computer “experiments” on classical fluids. I. Thermodynamical properties of Lennard-Jones molecules. Phys Rev 159: 98-103. doi: 10.1103/PhysRev.159.98
|
| [25] |
Walser R, Hünenberger PH, van Gunsteren WF (2002) Molecular dynamics simulations of a double unit cell in a protein crystal: volume relaxation at constant pressure and correlation of motions between the two unit cells. Proteins Struct Funct Bioinf 48: 327-340. doi: 10.1002/prot.10143
|
| [26] |
Riniker S, Eichenberger AP, van Gunsteren WF (2012) Solvating atomic level fine-grained proteins in supra-molecular level coarse-grained water for molecular dynamics simulations. Eur Biophys J 41: 647-661. doi: 10.1007/s00249-012-0837-1
|
| [27] | Hu CY, Lynch GC, Kokubo H, et al. (2010) Trimethylamine N-oxide influence on the backbone of proteins: an oligoglycine model. Proteins Struct Funct Bioinf 78: 695-704. |
| [28] |
Lee B, Richards FM (1971) The interpretation of protein structures: estimation of static accessibility. J Mol Biol 55: 379-400. doi: 10.1016/0022-2836(71)90324-X
|
| [29] |
Levine BG, Stone JE, Kohlmeyer, A (2011) Fast analysis of molecular dynamics trajectories with graphics processing units-radial distribution function histogramming. J Comput Phys 230: 3556-3569. doi: 10.1016/j.jcp.2011.01.048
|
| [30] |
Gohlke H, Hendlich M, Klebe G (2000) Knowledge-based scoring function to predict protein-ligand interactions. J Mol Biol 295: 337-356. doi: 10.1006/jmbi.1999.3371
|
| [31] |
Małolepsza E, Straub JE (2014) Empirical maps for the calculation of amide I vibrational spectra of proteins from classical molecular dynamics simulations. J Phys Chem B 118: 7848-7855. doi: 10.1021/jp412827s
|
| [32] |
Rekik N, Suleiman J, Blaise P, et al. (2018) Equivalence between the classical and quantum IR spectral density approaches of weak H-bonds in the absence of damping. J Phys Chem A 122: 2108-2115. doi: 10.1021/acs.jpca.8b00269
|
| [33] |
Fernández M, Caballero J, Fernández L, et al. (2007) Protein radial distribution function (P-RDF) and Bayesian-regularized genetic neural networks for modeling protein conformational stability: chymotrypsin inhibitor 2 mutants. J Mol Graph Model 26: 748-759. doi: 10.1016/j.jmgm.2007.04.011
|
| [34] |
Hollingsworth SA, Karplus PA (2010) A fresh look at the Ramachandran plot and the occurrence of standard structures in proteins. Biomol Concepts 1: 271-283. doi: 10.1515/bmc.2010.022
|
| [35] |
Ho BK, Brasseur R (2005) The Ramachandran plots of glycine and pre-proline. BMC Struct Biol 5: 14. doi: 10.1186/1472-6807-5-14
|
| [36] |
Gilis D, Rooman M (1996) Stability changes upon mutation of solvent accessible residues in proteins evaluated by database-derived potentials. J Mol Biol 257: 1112-1126. doi: 10.1006/jmbi.1996.0226
|
| [37] |
Lamichhane TR, Lamichhane HP (2018) Heat conduction by thyroid hormone receptors. AIMS Biophysics 5: 245-256. doi: 10.3934/biophy.2018.4.245
|
| [38] |
Lamichhane TR, Paudel S, Yadav BK, et al. (2019) Echo dephasing and heat capacity from constrained and unconstrained dynamics of triiodothyronine nuclear receptor protein. J Biol Phys 45: 107-125. doi: 10.1007/s10867-018-9518-3
|
Figures(12) / Tables(2)

Tika Ram Lamichhane, Hari Prasad Lamichhane. Structural changes in thyroid hormone receptor-beta by T3 binding and L330S mutational interactions[J]. AIMS Biophysics, 2020, 7(1): 27-40. doi: 10.3934/biophy.2020003


 DownLoad: