The European Green Deal and the Farm to Fork Strategy outline the European Union's strategy to sustainably address growing global food demand. The European Commission's guidelines for sustainable aquaculture by 2030 emphasize the sector's crucial role in this goal, particularly by promoting the use of alternative raw materials in aquafeeds to reduce reliance on fishmeal and help preserve wild fish stocks. Insects and their ability to recover nutrients from human and animal waste represent a circular alternative nutrient source that could be integrated into aquafeeds. Several obstacles still exist for adopting insect-based feeds in aquaculture, and one is represented by the consumer's acceptance, especially in Western societies. Since data regarding consumer acceptance of indirect entomophagy is still lacking, the idea of this study stems from the intention to contribute knowledge on this issue. A multivariate analysis method was used on a sample of 2426 consumers, and it allowed the identification of three groups of consumers. In general, consumers lack interest in the sustainability aspects of aquaculture production, and thus in the consumption of aquaculture productions fed with insect meal emerged, highlighting the lack of understanding of the relevance of shifting from the linear models to a circular economy approach in the aquaculture sector. The effect of information on the potential improvement of sustainability in the sector, and thus on the benefits of introducing insect meal, promoted an average 15% increase in each group to purchase these products. These results confirm the need to promote knowledge and information systems in Italy to build the so-called blue economy.
Citation: Emanuele Dolfi, Margherita Masi, Ernesto Simone Marrocco, Gizem Yeter, Martina Magnani, Yari Vecchio, Alessio Bonaldo, Felice Adinolfi. Indirect entomophagy: Consumer willingness to pay toward fish fed with insect-based feed[J]. AIMS Agriculture and Food, 2025, 10(2): 266-292. doi: 10.3934/agrfood.2025014
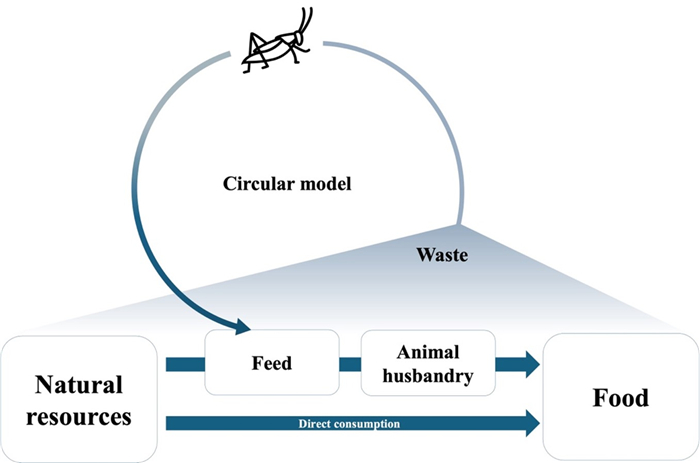
The European Green Deal and the Farm to Fork Strategy outline the European Union's strategy to sustainably address growing global food demand. The European Commission's guidelines for sustainable aquaculture by 2030 emphasize the sector's crucial role in this goal, particularly by promoting the use of alternative raw materials in aquafeeds to reduce reliance on fishmeal and help preserve wild fish stocks. Insects and their ability to recover nutrients from human and animal waste represent a circular alternative nutrient source that could be integrated into aquafeeds. Several obstacles still exist for adopting insect-based feeds in aquaculture, and one is represented by the consumer's acceptance, especially in Western societies. Since data regarding consumer acceptance of indirect entomophagy is still lacking, the idea of this study stems from the intention to contribute knowledge on this issue. A multivariate analysis method was used on a sample of 2426 consumers, and it allowed the identification of three groups of consumers. In general, consumers lack interest in the sustainability aspects of aquaculture production, and thus in the consumption of aquaculture productions fed with insect meal emerged, highlighting the lack of understanding of the relevance of shifting from the linear models to a circular economy approach in the aquaculture sector. The effect of information on the potential improvement of sustainability in the sector, and thus on the benefits of introducing insect meal, promoted an average 15% increase in each group to purchase these products. These results confirm the need to promote knowledge and information systems in Italy to build the so-called blue economy.

| [1] | Roser M, Ritchie H (2023) How has world population growth changed over time?. Our World in Data. Available from: https://ourworldindata.org/population-growth-over-time#article-citation. |
| [2] | European Commission (2020) Farm to Fork Strategy. Available from: https://food.ec.europa.eu/horizontal-topics/farm-fork-strategy_en#: ~: text = Further%20information-. |
| [3] | FAO (2020) The State of World Fisheries and Aquaculture 2020. Sustainability in action. FAO, Rome. https://doi.org/10.4060/ca9229en |
| [4] | FAO (2022) The State of World Fisheries and Aquaculture 2022. FAO, Rome. https://doi.org/10.4060/cc0461en |
| [5] |
Adwan OMA (2017) Analyzing fish farming system in the Jordan valley comparative study. J Soc Sci (COES & RJ-JSS) 64: 827–832. https://doi.org/10.25255/jss.2017.6.4.827.832 doi: 10.25255/jss.2017.6.4.827.832

|
| [6] |
Tschirner M, Kloas W (2017) Increasing the sustainability of aquaculture systems: Insects as alternative protein source for fish diets. GAIA-Ecological Perspectives Sci Soc 26: 332–340. https://doi.org/10.14512/gaia.26.4.10 doi: 10.14512/gaia.26.4.10
|
| [7] |
Han DS, Shan X, Zhang W, et al. (2018) A revisit to fishmeal usage and associated consequences in Chinese aquaculture. Rev Aquacult 10: 493–507. https://doi.org/10.1111/raq.12183 doi: 10.1111/raq.12183
|
| [8] |
Hua K, Cobcroft JM, Cole A, et al. (2019) The future of aquatic protein: Implications for protein sources in aquaculture diets. One Earth 1: 316–329. https://doi.org/10.1016/j.oneear.2019.10.018 doi: 10.1016/j.oneear.2019.10.018
|
| [9] |
Hedén I, Targhi BF, Baardsen G, et al. (2023) Dietary replacement of fishmeal with marine proteins recovered from shrimp and herring process waters promising in Atlantic salmon aquaculture. Aquaculture 574: 739735. https://doi.org/10.1016/j.aquaculture.2023.739735 doi: 10.1016/j.aquaculture.2023.739735
|
| [10] | Gasco L, Gai F, Maricchiolo G, et al. (2018) Fishmeal alternative protein sources for aquaculture feeds. In: Gasco L, Gai F, Maricchiolo G, et al., Feeds for the Aquaculture Sector: Current Situation and Alternative Sources, Cham: Springer, 1–28. https://doi.org/10.1007/978-3-319-77941-6_1 |
| [11] |
van Riel A, Nederlof MAJ, Chary K, et al. (2023) Feed‐food competition in global aquaculture: Current trends and prospects. Rev Aquacult 15: 1142–1158. https://doi.org/10.1111/raq.12804 doi: 10.1111/raq.12804
|
| [12] |
Jensen H, Elleby C, Domínguez IP, et al. (2021) Insect-based protein feed: From fork to farm. J Insects Food Feed 7: 1219-1233. https://doi.org/10.3920/jiff2021.0007 doi: 10.3920/jiff2021.0007
|
| [13] |
Belperio S, Cattaneo A, Nannoni E, et al. (2024) Assessing substrate utilization and bioconversion efficiency of black soldier Fly (Hermetia illucens) larvae: Effect of diet composition on growth and development temperature. Animals 14: 1340. https://doi.org/10.3390/ani14091340 doi: 10.3390/ani14091340
|
| [14] |
Masi M, Adinolfi F, Marrocco ES, et al. (2025) A circular transition model for the European aquaculture sector. Aquaculture 596: 741819. https://doi.org/10.1016/j.aquaculture.2024.741819 doi: 10.1016/j.aquaculture.2024.741819
|
| [15] |
Cadinu LA, Barra P, Torre F, et al. (2020) Insect rearing: Potential, challenges, and circularity. Sustainability 12: 4567. https://doi.org/10.3390/su12114567 doi: 10.3390/su12114567
|
| [16] |
Tran HQ, Nguyen TT, Prokešová M, et al. (2022) Systematic review and meta‐analysis of production performance of aquaculture species fed dietary insect meals. Rev Aquacult 14: 1637–1655. https://doi.org/10.1111/raq.12666 doi: 10.1111/raq.12666
|
| [17] | Pulina P, Arru B, Madau FA, et al. (2018) Insect meal in the fish diet and feeding cost: First economic simulations on European sea bass farming by a case study in Italy. 2018 Conference (July 28-August), Vancouver, British Columbia. https://doi.org/10.22004/ag.econ.275929 |
| [18] |
Henry M, Gasco L, Piccolo G, et al. (2015) Review on the use of insects in the diet of farmed fish: Past and future. Anim Feed Sci Technol 203: 1–22. https://doi.org/10.1016/j.anifeedsci.2015.03.001 doi: 10.1016/j.anifeedsci.2015.03.001
|
| [19] | International Platform of Insects for Food and Feed (IPIFF) (2021) An overview of the European market of insects as feed. Available from: https://ipiff.org/wp-content/uploads/2021/04/Apr-27-2021-IPIFF_The-European-market-of-insects-as-feed.pdf. |
| [20] |
Hartmann C, Shi J, Giusto A, et al. (2015) The psychology of eating insects: A cross-cultural comparison between Germany and China. Food Qual Preference 44: 148–156. https://doi.org/10.1016/j.foodqual.2015.04.013 doi: 10.1016/j.foodqual.2015.04.013
|
| [21] |
Verbeke W (2015) Profiling consumers who are ready to adopt insects as a meat substitute in a Western society. Food Qual Preference 39: 147–155. https://doi.org/10.1016/j.foodqual.2014.07.008 doi: 10.1016/j.foodqual.2014.07.008
|
| [22] |
Hartmann C, Siegrist M (2016) Becoming an insectivore: Results of an experiment. Food Qual Preference 51: 118–122. https://doi.org/10.1016/j.foodqual.2016.03.003 doi: 10.1016/j.foodqual.2016.03.003
|
| [23] |
Kouřimská L, Adámková A (2016) Nutritional and sensory quality of edible insects. NFS J 4: 22–26. https://doi.org/10.1016/j.nfs.2016.07.001 doi: 10.1016/j.nfs.2016.07.001
|
| [24] |
Imathiu S (2020) Benefits and food safety concerns associated with consumption of edible insects. NFS J 18: 1–11. https://doi.org/10.1016/j.nfs.2019.11.002 doi: 10.1016/j.nfs.2019.11.002
|
| [25] |
Tunca S, Budhathoki M, Brunsø K (2024) European consumers' intention to buy sustainable aquaculture products: An exploratory study. Sustainable Prod Consumption 50: 20–34. https://doi.org/10.1016/j.spc.2024.07.021 doi: 10.1016/j.spc.2024.07.021
|
| [26] | Gasco L, Biasato I, Dabbou S, et al. (2019) Quality and consumer acceptance of products from insect-fed animals. In: Sogari G, Mora C, Menozziet D, et al. (Eds.), Edible Insects in the Food Sector: Methods, Current Applications and Perspectives, Cham: Springer Nature, 73–86. https://doi.org/10.1007/978-3-030-22522-3_6 |
| [27] |
Mancini S, Sogari G, Espinosa Diaz S, et al. (2022) Exploring the future of edible insects in Europe. Foods 11: 455. https://doi.org/10.3390/foods11030455 doi: 10.3390/foods11030455
|
| [28] | Sogari G, Liu A, Li J (2019) Understanding edible insects as food in Western and Eastern societies. In: Bogueva D, Marinova D, Raphaely T, et al. (Eds.), Environmental, Health, and Business Opportunities in the New Meat Alternatives Market, Hershey (PA): IGI Global Scientific Publishing, 166–181. https://doi.org/10.4018/978-1-5225-7350-0.ch009 |
| [29] |
Feng Y, Zhao M, Ding WF, et al. (2020) Overview of edible insect resources and common species utilisation in China. J Insects Food Feed 6: 13–26. https://doi.org/10.3920/jiff2019.0022 doi: 10.3920/jiff2019.0022
|
| [30] |
Sogari G, Riccioli F, Moruzzo R, et al. (2023) Engaging in entomophagy: The role of food neophobia and disgust between insect and non-insect eaters. Food Qual Preference 104: 104764. https://doi.org/10.1016/j.foodqual.2022.104764 doi: 10.1016/j.foodqual.2022.104764
|
| [31] |
Stone H, FitzGibbon L, Millan E, et al. (2022) Curious to eat insects? Curiosity as a key predictor of willingness to try novel food. Appetite 168: 105790. https://doi.org/10.1016/j.appet.2021.105790 doi: 10.1016/j.appet.2021.105790
|
| [32] |
Rozin P, Fallon AE (1987) A perspective on disgust. Psychol Rev 94: 23–41. https://doi.org/10.1037/0033-295x.94.1.23 doi: 10.1037/0033-295x.94.1.23
|
| [33] |
Curtis V (2011) Why disgust matters. Philos Trans R Soc, B 366: 3478–3490. https://doi.org/10.1098/rstb.2011.0165 doi: 10.1098/rstb.2011.0165
|
| [34] |
Szendrő K, Nagy MZ, Tóth K (2020) Consumer acceptance of meat from animals reared on insect meal as feed. Animals 10: 1312. https://doi.org/10.3390/ani10081312 doi: 10.3390/ani10081312
|
| [35] |
Baldi L, Mancuso T, Peri M, et al. (2021) Consumer attitude and acceptance toward fish fed with insects: A focus on the new generations. J Insects Food Feed 8: 1249–1263. https://doi.org/10.3920/jiff2021.0109 doi: 10.3920/jiff2021.0109
|
| [36] |
Magnani M, Claret A, Gisbert E, et al. (2023) Consumer expectation and perception of farmed rainbow trout (Oncorhynchus mykiss) fed with insect meal (Tenebrio molitor). Foods 12: 4356. https://doi.org/10.3390/foods12234356 doi: 10.3390/foods12234356
|
| [37] |
Popoff M, MacLeod M, Leschen W (2017) Attitudes towards the use of insect-derived materials in Scottish salmon feeds. J Insects Food Feed 3: 131–138. https://doi.org/10.3920/jiff2016.0032 doi: 10.3920/jiff2016.0032
|
| [38] |
Profeta A, Hamm U (2018) Consumers' expectations and willingness‐to‐pay for local animal products produced with local feed. Int J Food Sci Technol 54: 651–659. https://doi.org/10.1111/ijfs.13933 doi: 10.1111/ijfs.13933
|
| [39] |
Pakseresht A, Vidaković A, Frewer LJ (2023) Factors affecting consumers' evaluation of food derived from animals fed insect meal: A systematic review. Trends Food Sci Technol 138: 310–322. https://doi.org/10.1016/j.tifs.2023.05.018 doi: 10.1016/j.tifs.2023.05.018
|
| [40] | PROteINSECT white paper (2016) Available from: https://www.proteinsect.eu/fileadmin/user_upload/press/proteinsect-whitepaper-2016.pdf. |
| [41] | Commission regulation (EU) 2017/893 (2017) Available from: https://eur-lex.europa.eu/legal-content/EN/TXT/PDF/?uri = CELEX: 32017R0893. |
| [42] |
Mancuso T, Baldi L, Gasco L (2016) An empirical study on consumer acceptance of farmed fish fed on insect meals: The Italian case. Aquacult Int 24: 1489–1507. https://doi.org/10.1007/s10499-016-0007-z doi: 10.1007/s10499-016-0007-z
|
| [43] |
Laureati M, Proserpio C, Jucker C, et al. (2016) New sustainable protein sources: Consumers' willingness to adopt insects as feed and food. Ital J Food Sci 28: 652–668. https://doi.org/10.14674/1120-1770/ijfs.v476 doi: 10.14674/1120-1770/ijfs.v476
|
| [44] |
Kostecka J, Konieczna K, Cunha L (2017) Evaluation of insect-based food acceptance by representatives of polish consumers in the context of natural resources processing retardation. J Ecol Eng 18: 166–174. https://doi.org/10.12911/22998993/68301 doi: 10.12911/22998993/68301
|
| [45] |
Ankamah-Yeboah I, Jacobsen JB, Olsen SB (2018) Innovating out of the fishmeal trap. Br Food J 120: 2395-2410. https://doi.org/10.1108/bfj-11-2017-0604 doi: 10.1108/bfj-11-2017-0604
|
| [46] |
Bazoche P, Poret S (2020) Acceptability of insects in animal feed: A survey of French consumers. J Consum Behav 20: 251–270. https://doi.org/10.1002/cb.1845 doi: 10.1002/cb.1845
|
| [47] |
Giotis T, Drichoutis AC (2021) Consumer acceptance and willingness to pay for direct and indirect entomophagy. Q Open 1: qoab015. https://doi.org/10.1093/qopen/qoab015 doi: 10.1093/qopen/qoab015
|
| [48] |
Arru B, Furesi R, Pulina P, et al. (2022) Price sensitivity of fish fed with insect meal: An analysis on Italian consumers. Sustainability 14: 6657. https://doi.org/10.3390/su14116657 doi: 10.3390/su14116657
|
| [49] |
Ferrer Llagostera P, Kallas Z, Reig L, et al. (2019) The use of insect meal as a sustainable feeding alternative in aquaculture: Current situation, Spanish consumers' perceptions and willingness to pay. J Cleaner Prod 229: 10–21. https://doi.org/10.1016/j.jclepro.2019.05.012 doi: 10.1016/j.jclepro.2019.05.012
|
| [50] |
Ranga L, Noci F, Vale AP, et al. (2023) Insect-based feed acceptance amongst consumers and farmers in Ireland: A pilot study. Sustainability 15: 11006. https://doi.org/10.3390/su151411006 doi: 10.3390/su151411006
|
| [51] |
Baldi L, Trentinaglia MT, Peri M, et al. (2023) Nudging the acceptance of insects-fed farmed fish among mature consumers. Aquacult Econ Manage 28: 308–339. https://doi.org/10.1080/13657305.2023.2265875 doi: 10.1080/13657305.2023.2265875
|
| [52] |
Roccatello R, Endrizzi I, Aprea E, et al. (2024) Insect-based feed in aquaculture: A consumer attitudes study. Aquaculture 582: 740512. https://doi.org/10.1016/j.aquaculture.2023.740512 doi: 10.1016/j.aquaculture.2023.740512
|
| [53] |
La Barbera F, Verneau F, Videbæk PN, et al. (2020) A self-report measure of attitudes toward the eating of insects: Construction and validation of the Entomophagy Attitude Questionnaire. Food Qual Preference 79: 103757. https://doi.org/10.1016/j.foodqual.2019.103757 doi: 10.1016/j.foodqual.2019.103757
|
| [54] |
Hofstetter R, Miller KM, Krohmer H, et al. (2020) A de-biased direct question approach to measuring consumers' willingness to pay. Int J of Res Mark 38: 70–84. https://doi.org/10.1016/j.ijresmar.2020.04.006 doi: 10.1016/j.ijresmar.2020.04.006
|
| [55] | European Commission (2023) Eurostat regional yearbook. https://data.europa.eu/doi/10.2785/606702 |
| [56] |
Maravelakis P (2019) The use of statistics in social sciences. J Humanit Appl Soc Sci 1: 87–97. https://doi.org/10.1108/jhass-08-2019-0038 doi: 10.1108/jhass-08-2019-0038
|
| [57] |
Sacchettini G, Castellini G, Graffigna G, et al. (2021) Assessing consumers' attitudes, expectations and intentions towards health and sustainability regarding seafood consumption in Italy. Sci Total Environ 789: 148049. https://doi.org/10.1016/j.scitotenv.2021.148049 doi: 10.1016/j.scitotenv.2021.148049
|
| [58] |
Masi M, Di Pasquale J, Vecchio Y, et al. (2022) A cross-sectional study in Mediterranean European countries to support stakeholders in addressing future market demands: Consumption of farmed fish products. Aquacult Rep 24: 101133. https://doi.org/10.1016/j.aqrep.2022.101133 doi: 10.1016/j.aqrep.2022.101133
|
| [59] |
Bimbo F, Viscecchia R, De Devitiis B, et al. (2022) How do Italian consumers value sustainable certifications on fish?—An explorative analysis. Sustainability 14: 3654. https://doi.org/10.3390/su14063654 doi: 10.3390/su14063654
|
| [60] |
Saidi A, Sacchi G, Cavallo C, et al. (2022) Drivers of fish choice: An exploratory analysis in Mediterranean countries. Agric Food Econ 10: 29. https://doi.org/10.1186/s40100-022-00237-4 doi: 10.1186/s40100-022-00237-4
|
| [61] |
Verbeke W, Vackier I (2005) Individual determinants of fish consumption: Application of the theory of planned behaviour. Appetite 44: 67–82. https://doi.org/10.1016/j.appet.2004.08.006 doi: 10.1016/j.appet.2004.08.006
|
| [62] |
Samoggia A, Castellini A (2017) Health-orientation and socio-demographic characteristics as determinants of fish consumption. J Int Food Agribusiness Mark 30: 211–226. https://doi.org/10.1080/08974438.2017.1403986 doi: 10.1080/08974438.2017.1403986
|
| [63] |
Birch D, Lawley M (2012) Buying seafood: Understanding barriers to purchase across consumption segments. Food Qual Preference 26: 12–21. https://doi.org/10.1016/j.foodqual.2012.03.004 doi: 10.1016/j.foodqual.2012.03.004
|
| [64] |
Neale EP, Nolan-Clark D, Probst YC, et al. (2012) Comparing attitudes to fish consumption between clinical trial participants and non-trial individuals. Nutr Diet 69: 124–129. https://doi.org/10.1111/j.1747-0080.2012.01585.x doi: 10.1111/j.1747-0080.2012.01585.x
|
| [65] |
Jabs J, Devine CM, Bisogni CA, et al. (2007) Trying to find the quickest way: Employed mothers' constructions of time for food. J Nutr Educ Behav 39: 18–25. https://doi.org/10.1016/j.jneb.2006.08.011 doi: 10.1016/j.jneb.2006.08.011
|
| [66] |
Reig L, Escobar C, Carrassón M, et al. (2019) Aquaculture perceptions in the Barcelona metropolitan area from fish and seafood wholesalers, fishmongers, and consumers. Aquaculture 510: 256–266. https://doi.org/10.1016/j.aquaculture.2019.05.066 doi: 10.1016/j.aquaculture.2019.05.066
|
| [67] |
López-Mas L, Claret A, Reinders MJ, et al. (2021) Farmed or wild fish? Segmenting European consumers based on their beliefs. Aquaculture 532: 735992. https://doi.org/10.1016/j.aquaculture.2020.735992 doi: 10.1016/j.aquaculture.2020.735992
|
| [68] |
Claret A, Guerrero L, Ginés R, et al. (2014) Consumer beliefs regarding farmed versus wild fish. Appetite 79: 25–31. https://doi.org/10.1016/j.appet.2014.03.031 doi: 10.1016/j.appet.2014.03.031
|
| [69] |
Hwang K, Kim H (2016) Are ethical consumers happy? Effects of ethical consumers' motivations based on empathy versus self-orientation on their happiness. J Bus Ethics 151: 579–598. https://doi.org/10.1007/s10551-016-3236-1 doi: 10.1007/s10551-016-3236-1
|
| [70] |
Ganglmair-Wooliscroft A, Wooliscroft B (2017) Well-being and everyday ethical consumption. J Happiness Stud 20: 141–163. https://doi.org/10.1007/s10902-017-9944-0 doi: 10.1007/s10902-017-9944-0
|
| [71] |
Desai K, Tapas P, Paliwal M (2024) Evaluating the effect of values influencing the choice of organic foods. Environ Dev Sustain 17: 1–20. https://doi.org/10.1007/s10668-024-04836-7 doi: 10.1007/s10668-024-04836-7
|
| [72] | Tan HSG, House J (2018) Consumer acceptance of insects as food: Integrating psychological and socio-cultural perspectives. In: Halloran A, Flore R, Vantomme P, et al. (Eds.), Edible Insects in Sustainable Food Systems, Cham: Springer, 375–386. https://doi.org/10.1007/978-3-319-74011-9_23 |
| [73] |
Hamerman EJ (2016) Cooking and disgust sensitivity influence preference for attending insect-based food events. Appetite 96: 319–326. https://doi.org/10.1016/j.appet.2015.09.029 doi: 10.1016/j.appet.2015.09.029
|
| [74] |
Orsi L, Voege LL, Stranieri S (2019) Eating edible insects as sustainable food? Exploring the determinants of consumer acceptance in Germany. Food Res Int 125: 108573. https://doi.org/10.1016/j.foodres.2019.108573 doi: 10.1016/j.foodres.2019.108573
|
| [75] |
Caparros-Megido R, Gierts C, Blecker C, et al. (2016) Consumer acceptance of insect-based alternative meat products in Western countries. Food Qual Preference 52: 237–243. https://doi.org/10.1016/j.foodqual.2016.05.004 doi: 10.1016/j.foodqual.2016.05.004
|
| [76] |
Roma R, Ottomano Palmisano G, De Boni A (2020) Insects as novel food: A consumer attitude analysis through the dominance-based rough set approach. Foods 9: 387. https://doi.org/10.3390/foods9040387 doi: 10.3390/foods9040387
|
| [77] |
Tunca S, Budhathoki M, Brunsø K (2024) European consumers' intention to buy sustainable aquaculture products: An exploratory study. Sustain Prod Consum 50: 20–34. https://doi.org/10.1016/j.spc.2024.07.021 doi: 10.1016/j.spc.2024.07.021
|
| [78] | Klingemann W, Kim J, Füller KD (2022) Willingness to pay. In: Homburg C, Klarmann M, Vomberg A (Eds.), Handbook of Market Research: Springer, 969–999. https://doi.org/10.1007/978-3-319-57413-4_35 |
| [79] |
Dagevos H, Taufik D (2023) Eating full circle: Exploring consumers' sympathy for circularity in entomophagy acceptance. Food Qual Preference 105: 104760. https://doi.org/10.1016/j.foodqual.2022.104760 doi: 10.1016/j.foodqual.2022.104760
|
| [80] |
Bass DA, McFadden BR, Messer KD (2021) A case for measuring negative willingness to pay for consumer goods. Food Policy 104: 102126. https://doi.org/10.1016/j.foodpol.2021.102126 doi: 10.1016/j.foodpol.2021.102126
|
| [81] |
Kollmuss A, Agyeman J (2002) Mind the gap: Why do people act environmentally and what are the barriers to pro-environmental behavior? Environ Educ Res 8: 239–260. https://doi.org/10.1080/13504620220145401 doi: 10.1080/13504620220145401
|
| [82] |
Yeter G, Vecchio Y, Masi M (2025) Circular consumption in agrifood to become sustainable: A semisystematic review. Circ Econ Sustain 2025: 1–26. https://doi.org/10.1007/s43615-024-00464-5 doi: 10.1007/s43615-024-00464-5
|


Figures(4) / Tables(4)

Emanuele Dolfi, Margherita Masi, Ernesto Simone Marrocco, Gizem Yeter, Martina Magnani, Yari Vecchio, Alessio Bonaldo, Felice Adinolfi. Indirect entomophagy: Consumer willingness to pay toward fish fed with insect-based feed[J]. AIMS Agriculture and Food, 2025, 10(2): 266-292. doi: 10.3934/agrfood.2025014


 DownLoad: