Letter

Global decision support dashboard of COVID-19

  • Received: 08 April 2020 Accepted: 27 April 2020 Published: 06 May 2020
  • Citation: Sushant K. Singh. Global decision support dashboard of COVID-19[J]. AIMS Medical Science, 2020, 7(2): 40-42. doi: 10.3934/medsci.2020003

    Related Papers:

    [1] Claudia Chaufan, Laurie Manwell, Camila Heredia, Jennifer McDonald . COVID-19 vaccines and autoimmune disorders: A scoping review protocol. AIMS Medical Science, 2023, 10(4): 318-328. doi: 10.3934/medsci.2023025
    [2] Melissa R. Bowman Foster, Ali Atef Hijazi, Raymond C. Sullivan Jr, Rebecca Opoku . Hydroxyurea and pyridostigmine repurposed for treating Covid-19 multi-systems dysfunctions. AIMS Medical Science, 2023, 10(2): 118-129. doi: 10.3934/medsci.2023010
    [3] Mlyashimbi Helikumi, Paride O. Lolika, Steady Mushayabasa . Analysis of Caputo fractional-order model for COVID-19 with non-pharmaceuticals interventions and vaccine hesitancy. AIMS Medical Science, 2023, 10(3): 196-222. doi: 10.3934/medsci.2023017
    [4] Osmond C. Ekwebelem, Helen Onyeaka, Ismaeel Yunusa, Taghi Miri, Yahwedalu M. Onwuneme, Ayeni T. Eunice, Amara Anyogu, Bright Obi, Ngwogu Ada Carol . Do we trust the government? Attributes of COVID-19 vaccine hesitancy and acceptance in Nigeria. AIMS Medical Science, 2022, 9(2): 268-282. doi: 10.3934/medsci.2022010
    [5] Ayema Haque, Areeba Minhaj, Areeba Ahmed, Owais Khan, Palvisha Qasim, Hasan Fareed, Fatima Nazir, Ayesha Asghar, Kashif Ali, Sobia Mansoor . A meta-analysis to estimate the incidence of thromboembolism in hospitalized COVID-19 patients. AIMS Medical Science, 2020, 7(4): 301-310. doi: 10.3934/medsci.2020020
    [6] Gasim Dobie, Sarah Abutalib, Wafa Sadifi, Mada Jahfali, Bayan Alghamdi, Asmaa Khormi, Taibah Alharbi, Munyah Zaqan, Zahra M Baalous, Abdulrahim R Hakami, Mohammed H Nahari, Abdullah A Mobarki, Muhammad Saboor, Mohammad S Akhter, Abdullah Hamadi, Denise E Jackson, Hassan A Hamali . The correlation between severe complications and blood group types in COVID-19 patients; with possible role of T polyagglutination in promoting thrombotic tendencies. AIMS Medical Science, 2023, 10(1): 1-13. doi: 10.3934/medsci.2023001
    [7] Hossein Sheibani, Elham Azmoodeh, Amirhessam Kheirieh, Khadijeh Aerab Sheibani . COVID-19 and papular manifestations pattern in 3 patients: a retrospective case series. AIMS Medical Science, 2021, 8(1): 36-41. doi: 10.3934/medsci.2021004
    [8] B Shivananda Nayak, Krishnamohan Surapaneni, Pradeep Kumar Sahu, Purnima Bhoi, K V N Dhananjay, Santhi Silambanan, C R Wilma Delphine Silvia, Dhanush Nayak, K Nagendra, M Balachandra Naidu, Akash S Nayak . The mental health of the health care professionals in India during the COVID-19 pandemic: a cross-sectional study. AIMS Medical Science, 2022, 9(2): 283-292. doi: 10.3934/medsci.2022011
    [9] Elizabeth Burner, Lucy Liu, Sophie Terp, Sanjay Arora, Chun Nok Lam, Michael Menchine, Daniel A Dworkis, Sarah Axeen . Increased risk of diabetic ketoacidosis in an Urban, United States, safety-net emergency department in the COVID-19 era. AIMS Medical Science, 2023, 10(1): 37-45. doi: 10.3934/medsci.2023004
    [10] Belgüzar Kara . Determinants of perceived stress in health professional students during the COVID-19 pandemic. AIMS Medical Science, 2021, 8(2): 147-162. doi: 10.3934/medsci.2021014


  • At the time of writing, the novel coronavirus (COVID-19) has affected over 3 million individuals in 210 countries and territories, from which more than 228,194 individuals have died [1],[2]. The first case of COVID-19 was reported on January 10, 2020, in Wuhan, China [3],[4]. In just three months, the deadly virus has spread from China to 210 countries [5]. Social isolation, state and country lockdowns, remote work, and unpreparedness to combat this pandemic have significantly affected each individual, society, economy, health sector, industry, and country [1],[2],[5]. Because the number of victims is increasing daily, an open-source-based decision-support dashboard would be handy for everyone to track COVID-19-related information and make informed decisions. In this regard, the Center for Systems Science and Engineering of Johns Hopkins University in Baltimore, Maryland, has developed a useful real-time dashboard [6]. The map displayed on this dashboard requires selecting an area to see the COVID-19 data, and the rest of the information is provided in tabular text format, which is unintuitive. Also, there is no option to download the dashboard; therefore, the work is not reproducible. Thus, a semi-real-time global dashboard is created using a community version of the business intelligence tool Tableau (version 2020.1). The panel provides the following information on a single screen through maps, graphs, and charts: (a) a comprehensive summary including total cases, total deaths, total recovered cases, active cases, and closed cases across the world; (b) country-level data including total cases, new cases, total deaths, new deaths, total recovered, active cases, serious and critical cases, and the death ratio; (c) the top ten countries most affected by COVID-19 and all case-related information for these countries; and (d) total cases and deaths in the United States (Figure 1).

    Figure 1.  Near realtime global dashboard of COVID-19 [7].

    The maps and the graphs have tooltip options, and users can easily visualize the data after hovering over the areas of interest. The dashboard also provides filters to select the regions of interest at the global level and states at the U.S. level.

    This dashboard can be viewed on any digital device, customized by the importance of the region. It can be downloaded directly as an image, PDF, PowerPoint, and other formats as required [8]. The download option provides flexibility to reproduce the work with little effort, and the data can be visually shown through presentations or publications. Currently, the United States is selected as the interest of the region. The United States has been declared to be the global epicenter of COVID-19 and has reached the highest total number of cases in the world. The data is refreshed every five hours and will continue collecting data until this outbreak is controlled. Anyone can explore and download the dashboard without a subscription from any region across the world.


    Conflict of interest


    The author declares no conflict of interest.

    [1] WHO, Coronavirus disease 2019 (COVID-19): situation report, 100. 2020, World Health Organization.Available from: https://www.who.int/docs/default-source/coronaviruse/situation-reports/20200429-sitrep-100-covid-19.pdf?sfvrsn=bbfbf3d1_2.
    [2] WorldmetersCoronavirus Cases. 2020 April 29, 2020.Available from: https://www.worldometers.info/coronavirus/.
    [3] Guo YR, Cao QD, Hong ZS, et al. (2020) The origin, transmission and clinical therapies on coronavirus disease 2019 (COVID-19) outbreak–an update on the status. Mil Med Res 7: 1-10.
    [4] Lu R, Zhao X, Li J, et al. (2020) Genomic characterisation and epidemiology of 2019 novel coronavirus: implications for virus origins and receptor binding. Lancet 395: 565-574.
    [5] Yang GZ, Nelson B J, Murphy RR, et al. (2020) Combating COVID-19—The role of robotics in managing public health and infectious diseases. Sci Robot 5: eabb5589.
    [6] Dong E, Du H, Gardner L (2020) An interactive web-based dashboard to track COVID-19 in real time. Lancet Infect Dis pii: S1473-3099(20)30120-1.
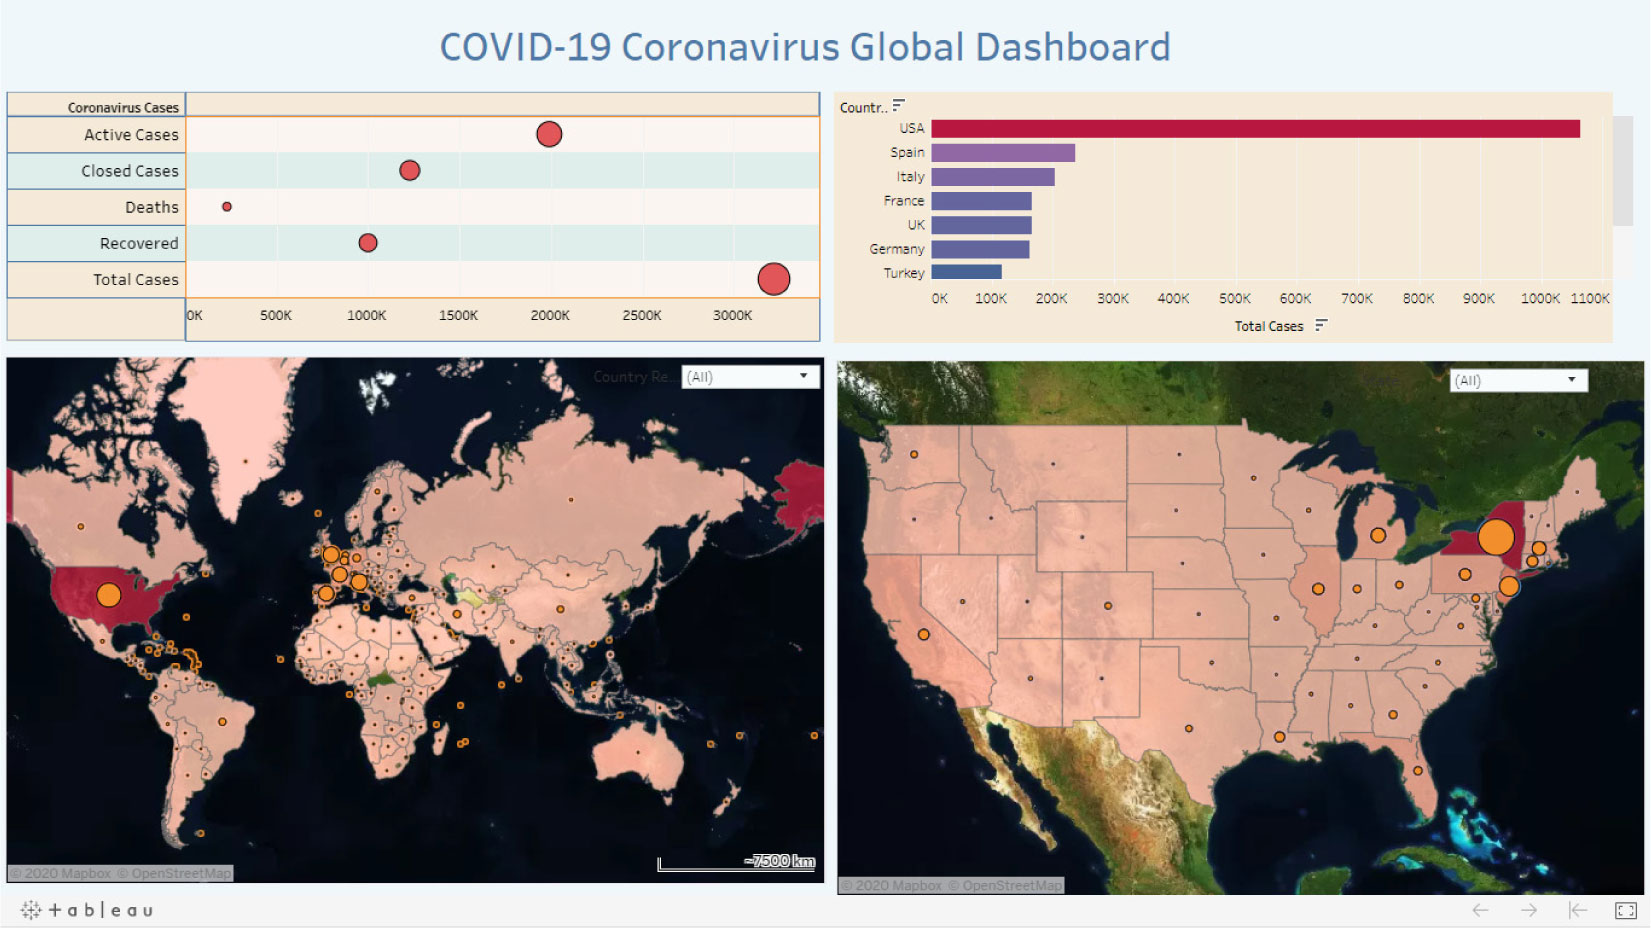
    [7] Singh S (2020) Near Realtime Global Dashboard of COVID-19.Available from: https://public.tableau.com/profile/sushant.singh#!/vizhome/COVID-19CoronavirusGlobalDashboardRealtime/COVID-19CoronavirusGlobalDashboard?publish=yes.
    [8] Murray DG (2013)  Tableau your data!: fast and easy visual analysis with tableau software John Wiley & Sons.
  • This article has been cited by:

    1. Sushant K Singh, COVID-19: A master stroke of Nature, 2020, 7, 2327-8994, 393, 10.3934/publichealth.2020033
  • Reader Comments
  • © 2020 the Author(s), licensee AIMS Press. This is an open access article distributed under the terms of the Creative Commons Attribution License (http://creativecommons.org/licenses/by/4.0)
通讯作者: 陈斌, bchen63@163.com
  • 1. 

    沈阳化工大学材料科学与工程学院 沈阳 110142

  1. 本站搜索
  2. 百度学术搜索
  3. 万方数据库搜索
  4. CNKI搜索

Metrics

Article views(3973) PDF downloads(391) Cited by(1)

Article outline

Figures and Tables

Figures(1)

Other Articles By Authors

/

DownLoad:  Full-Size Img  PowerPoint
Return
Return

Catalog