Research article Special Issues

Culturable bacterial diversity from the chestnut (Castanea sativa Mill.) phyllosphere and antagonism against the fungi causing the chestnut blight and ink diseases

  • The phyllosphere supports a large and complex bacterial community that varies both across plant species and geographical locations. Phyllosphere bacteria can have important effects on plant health. The sweet chestnut (Castanea sativa Mill.) is an economically important tree species affected worldwide by the fungal pathogens Cryphonectria parasitica and Phytophthora cinnamomi. We examined the culturable phyllosphere bacterial community of the sweet chestnut at two nearby locations in Central Spain in order to know its geographical variability and to explore its potential as source of biological control agents against these two pathogenic fungi. The bacterial diversity at strain level was high but it varied significantly between locations; however, phylotype richness and diversity were more comparable. The isolates were affiliated with the phyla Actinobacteria, Firmicutes and Proteobacteria. Most of them were members of recognized bacterial species, with a notable proportion of representative of the genera Dietzia and Lonsdalea, but a small fraction of the strains revealed the existence of several potential novel species or even genera. Antagonism tests showed the occurrence in the chestnut phyllosphere of bacterial strains potentially useful as biological control agents against the two pathogenic fungi, some of which belong to species never before described as fungal antagonists. Chestnut phyllosphere, therefore, contains a great diversity of culturable bacteria and may represent an untapped source of potential biocontrol agents against the fungi causing blight and ink diseases of this tree species.

    Citation: Angel Valverde, María González-Tirante, Marisol Medina-Sierra, Raúl Rivas, Ignacio Santa-Regina, José M. Igual. Culturable bacterial diversity from the chestnut (Castanea sativa Mill.) phyllosphere and antagonism against the fungi causing the chestnut blight and ink diseases[J]. AIMS Microbiology, 2017, 3(2): 293-314. doi: 10.3934/microbiol.2017.2.293

    Related Papers:

    [1] Xinyou Meng, Jie Li . Stability and Hopf bifurcation analysis of a delayed phytoplankton-zooplankton model with Allee effect and linear harvesting. Mathematical Biosciences and Engineering, 2020, 17(3): 1973-2002. doi: 10.3934/mbe.2020105
    [2] Juan Li, Yongzhong Song, Hui Wan, Huaiping Zhu . Dynamical analysis of a toxin-producing phytoplankton-zooplankton model with refuge. Mathematical Biosciences and Engineering, 2017, 14(2): 529-557. doi: 10.3934/mbe.2017032
    [3] Ruiqing Shi, Jianing Ren, Cuihong Wang . Stability analysis and Hopf bifurcation of a fractional order mathematical model with time delay for nutrient-phytoplankton-zooplankton. Mathematical Biosciences and Engineering, 2020, 17(4): 3836-3868. doi: 10.3934/mbe.2020214
    [4] Hong Yang . Global dynamics of a diffusive phytoplankton-zooplankton model with toxic substances effect and delay. Mathematical Biosciences and Engineering, 2022, 19(7): 6712-6730. doi: 10.3934/mbe.2022316
    [5] Saswati Biswas, Pankaj Kumar Tiwari, Yun Kang, Samares Pal . Effects of zooplankton selectivity on phytoplankton in an ecosystem affected by free-viruses and environmental toxins. Mathematical Biosciences and Engineering, 2020, 17(2): 1272-1317. doi: 10.3934/mbe.2020065
    [6] Zuolin Shen, Junjie Wei . Hopf bifurcation analysis in a diffusive predator-prey system with delay and surplus killing effect. Mathematical Biosciences and Engineering, 2018, 15(3): 693-715. doi: 10.3934/mbe.2018031
    [7] Honghua Bin, Daifeng Duan, Junjie Wei . Bifurcation analysis of a reaction-diffusion-advection predator-prey system with delay. Mathematical Biosciences and Engineering, 2023, 20(7): 12194-12210. doi: 10.3934/mbe.2023543
    [8] Yong Yao . Dynamics of a delay turbidostat system with contois growth rate. Mathematical Biosciences and Engineering, 2019, 16(1): 56-77. doi: 10.3934/mbe.2019003
    [9] He Liu, Chuanjun Dai, Hengguo Yu, Qing Guo, Jianbing Li, Aimin Hao, Jun Kikuchi, Min Zhao . Dynamics induced by environmental stochasticity in a phytoplankton-zooplankton system with toxic phytoplankton. Mathematical Biosciences and Engineering, 2021, 18(4): 4101-4126. doi: 10.3934/mbe.2021206
    [10] Guangxun Sun, Binxiang Dai . Stability and bifurcation of a delayed diffusive predator-prey system with food-limited and nonlinear harvesting. Mathematical Biosciences and Engineering, 2020, 17(4): 3520-3552. doi: 10.3934/mbe.2020199
  • The phyllosphere supports a large and complex bacterial community that varies both across plant species and geographical locations. Phyllosphere bacteria can have important effects on plant health. The sweet chestnut (Castanea sativa Mill.) is an economically important tree species affected worldwide by the fungal pathogens Cryphonectria parasitica and Phytophthora cinnamomi. We examined the culturable phyllosphere bacterial community of the sweet chestnut at two nearby locations in Central Spain in order to know its geographical variability and to explore its potential as source of biological control agents against these two pathogenic fungi. The bacterial diversity at strain level was high but it varied significantly between locations; however, phylotype richness and diversity were more comparable. The isolates were affiliated with the phyla Actinobacteria, Firmicutes and Proteobacteria. Most of them were members of recognized bacterial species, with a notable proportion of representative of the genera Dietzia and Lonsdalea, but a small fraction of the strains revealed the existence of several potential novel species or even genera. Antagonism tests showed the occurrence in the chestnut phyllosphere of bacterial strains potentially useful as biological control agents against the two pathogenic fungi, some of which belong to species never before described as fungal antagonists. Chestnut phyllosphere, therefore, contains a great diversity of culturable bacteria and may represent an untapped source of potential biocontrol agents against the fungi causing blight and ink diseases of this tree species.


    Abbreviations: AOP: Advanced oxidation process; Azi: Azithromycin; DP: Degradation Product; Ery: Erythromycin; ESI: Electrospray ionization; HPLC: high performance liquid chromatography; LC50: lethal concentration; MS: mass spectrometer; Q: TOF quadrupole time-of-flight; QSAR: quantitative structure-activity relationship; Spi: Spiramycin; Tyl: Tylosin; UV: Ultra violet; VUV: Vacuum ultra violet; MIC: minimal inhibitory concentration


    1. Introduction

    One of the major current trends in water studies is the research towards a fourth purification stage in wastewater treatment plants (WWTP), as more and more micropollutants are detected in WWTP effluents and in various water bodies [1,2,3,4]. The use of activated carbon, ozonation and advanced oxidation processes (AOPs), such as the irradiation with UV light often in combination with photocatalysts or degradation accelerating agents, e.g. titaniumdioxide or hydrogenperoxide, are being intensely discussed. A common goal of many of these AOPs is the generation of hydroxyl radicals. These are formed by homolysis of water under vacuum UV radiation [5,6,7]. Hydroxyl radicals are highly reactive and react quickly with any organic compound in the solution. The presence of hydroxyl radicals has been previously demonstrated and was also observed under the conditions as used in the present study [8,9]. Yet, these oxidations processes are often assumed to give rise to products more toxic or ecologically toxic than the parent compound. These new products will negatively affect the environment. Many degradation products cannot be detected analytically with a reasonable effort due to their low concentrations. Using activated carbon for adsorption requires the treatment of the contaminated sorbent either by recycling or by combustion.

    This study focuses on improved and more recent methods. Current findings reveal concentrations in ng L–1 ranges depending on the compounds [4]. The reliable, experimental evaluation and prediction of the toxicity of the degradation products are often a challenge, since most products are not commercially available and chemical synthesis would be too lengthy and costly. Alternative approaches to assess toxicity rely on computational methods, such as QSAR analysis [10,11]. QSAR analysis predicts a relationship between biological activity and chemical structure [12,13,14]. Thus, it can also be used to evaluate the eco-toxicity of the resulting photodegradation products. For this purpose, two different software products were applied in this study to calculate ecotoxicity. An experimental approach to access ecotoxicity is the determination of minimal inhibitory concentration (MIC) values. These two methods will be deployed in the field of ecotoxicology to selected macrolide antibiotics.

    Today, macrolide antibiotics occur worldwide in water. In Germany, azithromycin was found in concentrations of 7–22 ng L–1 and erythromycin in concentrations of 4–190 ng L–1 in surface water. In Spanish surface waters, observed concentrations of spiramycin and tylosin were up to 488 ng L–1 [15,16,17]. In Mexico, azithromycin was observed in different canals with concentrations up to 211 ng L–1 [18]. The concentration of erythromycin was 7–1149 ng L–1 in river water in Ghana and up to 60 ng L–1 in Chinese surface waters [19,20,21]. The concentration of azithromycin and erythromycin in Portuguese rivers was measured by Pereira et al. [22]. The observed macrolide concentrations amounted to 39 ng L–1. In seawater, the concentration of azithromycin was found as high as 138.9 ng L–1 near China [23]. The occurrence of azithromycin in groundwater was confirmed by Boy-Roura et al. for Catalonia (Spain) to 7 ng L–1 [24]. The highest concentration of macrolides was observed in WWTP effluents, with macrolide concentrations in the feed samples being at least twice as high as the effluent samples [25,26,27,28,29,30]. Thus, a part of the macrolides can be eliminated by the conventional three stage sewage treatment plant. Yet, for a complete and sustainable removal of the macrolides, another stage is required. In this respect, azithromycin, erythromycin, spiramycin and tylosin were irradiated with UVC/VUV-light at pH 6–7. The products formed were identified using high-performance liquid chromatography coupled to electrospray ionization quadrupole time-of-flight mass spectrometry (HPLC-ESI-Q-TOF-MS) and examined with respect to their ecotoxicological potential. The gram-positive Bacillus subtilis and the gram-negative Pseudomonas fluorescens minimal inhibitory concentrations (MIC) of the four macrolides and their solutions were determined as a function of irradiation time to assess potential ecotoxicological hazards. Both bacterial strains occur ubiquitously in soil and waters, allowing the evaluation of the environmental impact [31].


    2. Materials and methods


    2.1. Chemicals and reagents

    Azithromycin dihydrate (Alfa Aesar, purity 98%) consisting of form A (Azi A) and B (Azi B), erythromycin free base (BioChemica AppliChem, purity 95%) consisting of form A (Ery A), B (Ery B) and F (Ery F), spiramycin (Alfa Aesar, 90%), consisting of form spiramycin I (Spi I) and spiramycin Ⅲ (Spi Ⅲ), and tylosin tartrate (Alfa Aesar, purity 95%) consisting of form A (Tyl A) and B (Tyl B) were used for photodegradation experiments. Hydrochloric acid and ammonia (approximately 25% Riedel-de Haen; pro analysis, Reag ISO, Reag Ph. Eur.) were used to adjust the pH value of the solution. Methanol (LiChrosolv Merck for liquid chromatography), MilliQ water (Simplicity 185, Merck Millipore, Billerica, MA, USA) and formic acid (Fluka, LC-MS-Grade) were used as eluent for HPLC-ESI-Q-TOF-MS experiments.


    2.2. Photodegradation experiments

    The photodegradation experiments of macrolides were carried out in a 1 L-batch reactor (Peschl Ultraviolet, Mainz, Germany) wrapped in aluminum foil to prevent penetration of irradiation. A low-pressure mercury immersion lamp (TNN 15/32, 15 W, Heraeus, Hanau, Germany), which emits polychromatic light with maximum radiation intensities at 185,254,313,365 405,437,547,578, and 580 nm, was located in the center of the batch reactor. Each of the four macrolides was dissolved separately in 800 mL MilliQ water (Simplicity 185, Merck Millipore, Billerica, MA, USA) to yield a final concentration of 20 mg L–1. The solution was irradiated in the batch reactor for 10 min. The total photon flux of the UV lamp was determined to 2 mmol min–1 L–1 by ferrioxalate actinometry [32,33]. The temperature in the reactor was kept at 22 ± 2 ℃ for all photodegradation experiments. A magnetic stirrer (500 rpm) was used for mixing. For comparison purposes, the absorption spectrum of each compound was recorded using a UV/Vis spectrophotometer (UV-1601 PC, Shimadzu, Kyoto, Japan).


    2.3. HPLC-ESI-Q-TOF-MS analyses

    Samples from photodegradation experiments were analyzed using HPLC Agilent 1200 (Agilent, Santa Clara, USA) coupled with an ESI-Q-TOF mass spectrometer Agilent 6530 (Agilent, Santa Clara, USA). The column used for chromatographic separation was a reversed-phase C-18 CoreShell column (Thermo Scientific, Dreieich, Deutschland) having dimensions of 50 mm × 2.1 mm and 2.6 μm particle size. The column temperature was kept constant at 40 ℃. Two eluents were used during the gradient-program: MilliQ water with 0.1% formic acid as eluent A and methanol with 0.1% formic acid as eluent B. The gradient steps over a total run time of 12 min were: during 1 min 1–30% B, during the next 10 min 30–75% B, till 11.1 min 75–99% B, hold 99% for 0.1 min, return to starting conditions (1% B) within 0.8 min.

    The mass spectrometer was equipped with a Jet-Stream Electrospray-Ion-source (ESI), which was operated in positive detection mode. The collision gas flow was set to 8 L min–1, the gas temperature was 300 ℃ and the fragmentor voltage was 175 V. Mass spectrometer and HPLC system were controlled via MassHunter Workstation B.06.00 (Agilent, Santa Clara, USA) running under Windows 7 Professional. Chromatograms and mass spectra were processed and analyzed using the same software.

    Using a syringe, samples of 2 mL volume were taken from the reactor at 30 second intervals during the first 5 min, and thereafter at 1 minute intervals. The total irradiation time was 10 min. Samples were transferred to the HPCL-ESI-Q-TOF-MS and for MIC determination.


    2.4. Determination of the kinetic rate constants and quantum efficiencies

    Photolysis proceeds following first order or pseudo-first order reaction kinetics according to Equations 1 and 2, where ν is the reaction velocity, cA is the concentration of each macrolide, the index 0 denotes the starting concentration, k1 is the reaction rate constant and t the time [9,34,35,36,37]. In this work, the concentration-time (c-t) curves were determined as mass area-under-the-curve depending on irradiation time resulting from the HPCL-ESI-Q-TOF-MS experiments. They were described according to first order kinetics. The degradation products are considered intermediates and their c-t curves can be described as a consecutive and subsequent follow-up reaction [9,36]. All c-t curves were fitted mathematically using the curve fitting toolbox within the software MatLab R2016b (MathWorks, Natrick, USA).

    ν=dcAdt=k1cA (1)
    cA=cA0ek1t (2)

    The quantum efficiencies Φ254 at 254 nm were determined according to Equation 3 as described in detail in former studies [8,9].

    Φ254=k2.303lε254I0,254 (3)

    The quantum efficiency at 254 nm Φ254is the fraction of photons leading to a reaction compared to the total number of photons emitted by the lamp, where k (min–1) is the first-order reaction rate constant, l the reactor width, which was 3 cm, I0,254 the photon fluence rate in mmol min–1 L–1 and ε254 the molar extinction coefficient in L mol–1 cm–1.


    2.5. Determination of minimal inhibitory concentration (MIC)

    The minimal inhibitory concentration (MIC) assay was performed according to ISO 20776-1:2007 [38] Two bacterial strains were selected: Pseudomonas fluorescens (DSMZ-No. 50090), and Bacillus subtilis (DSMZ-No. 10). The method followed the protocol described by Wiegand, Hilpert and Hancock [39].


    2.6. Quantitative structure-activity relationship (QSAR)

    For QSAR analysis, the software T.E.S.T. and the software OECD QSAR Toolbox were used [40]. QSAR was calculated using the corresponding option in the software T.E.S.T. The following organisms were selected as indicators: Daphnia magna LC50 (48 h) in mg L–1 and fathead minnow LC50 (96 h) as target organisms and 'Photoinduced Toxicity on D. magna' and 'Mortality LC50 (48 h) of brachiopoda' for non-specified test organisms. These organisms represent species of the aquatic environment. The structure of each compound was sketched using ACD/ChemSketch 2016.1.1 (ACDLabs, Inc., Toronto, ON, Canada) and imported into the software T.E.S.T and QSAR toolbox.


    3. Results and discussion

    The chemical structures of the four macrolides investigated are depicted in Table 1 together with the m/z value of their quasi-molecular ion and the major fragments observed in MS. In water, erythromycin is often found as anhydro-erythromycin [18,23,26,41,42]. This is formed from erythromycin A by elimination of a water molecule. This reaction is especially preferred in acidic solutions [9,43,44,45]. Among the other macrolides, this dehydration has not been observed. Macrolides are often unstable in an acidic environment, such that a chemical degradation may occur even before irradiation [9,44,45,46,47,48,49,50,51,52].

    Table 1. Observed and identified macrolides in solution with the m/z values of their theoretical and observed quasi-molecular ions [M+H]+ and observed fragments.
    compound theoretical [M+H]+ observed [M+H]+ fragments structure
    Azi A 749.5158 749.5258 591.4215;
    375.2667
    Azi B 733.5209 733.5300 575.4329;
    367.2689
    Ery A 734.4685 734.4732 576.3794;
    558.3669
    Ery B 718.4736 718.4785 542.3717
    Ery A-H2Oa 716.4580 716.4619 -
    Ery A-H2Ob 716.4580 716.4623 -
    SpiI 843.5213 843.5269 438.2800;
    422.2667;
    781.5456
    SpiⅢ 899.5475 899.5485 -
    Tyl A 916.5264 916.5374 742.4372;
    582.3637;
    336.2019
    Tyl B 772.4478 772.4559 598.3348;
    582.3637
     | Show Table
    DownLoad: CSV

    The experimental [M+H]+ values agreed well with the theoretical values. The detected fragments all possessed the lactone ring, from which sugar moieties had already been eliminated.


    3.1. Photoinduced degradation rate constants of macrolides

    Table 2 shows the first order rate constants determined from the degradation experiments using UVC irradiation. Quantum efficiencies at 254 nm according to Equation 3 are also given.

    Table 2. Rate constants, half-lives and the calculated quantum efficiencies of the individual macrolides at pH 7.
    Substance k /min–1 t1/2 /min Φ254
    Azi A 0.39 1.80 1.02
    Azi B 0.31 2.23 0.81
    Ery A 0.59 1.18 0.55
    Ery B 0.66 1.04 0.61
    Ery A–H2Oa 0.59 1.17 0.55
    Ery A–H2Ob 1.11 0.63 1.03
    Spi I 0.62 1.12 0.05
    Spi Ⅲ 0.64 1.08 0.05
    Tyl A 2.47 0.28 0.04
    Tyl B 1.66 0.42 0.03
     | Show Table
    DownLoad: CSV

    The quantum efficiencies of azithromycin A and erythromycin A-H2Ob amounted to a value larger than 1. This can only be explained by assuming that the compound was additionally degraded by a mechanism other than photodegradation [53]. Such a mechanism was assumed degradation induced by hydroxyl radicals generated from water by UVC irradiation [5,6].

    Tylosin generally degraded significantly faster than azithromycin and erythromycin. The degradation curves of azithromycin A, erythromycin A, spiramycin I, and tylosin A are shown in Figure 1. Tylosin A was degraded faster than tylosin B, since tylosin B is formed from tylosin A through elimination of the sugar moiety cladinose. The quantum efficiency of tylosin is lower by a factor of 10 than those of azithromycin and erythromycin, whereas the reaction proceeds much faster or more frequent following the reaction rates.

    Figure 1. Normalized concentration-time (c-t) curves of Azi A (blue), Ery A (red), Spi I (violet) and Tyl A (green) A from photodegradation of 20 mM aqueous solutions at pH 6–7. The c-t curves were determined using off-line HPLC-MS analysis.

    In general, the photodegradation of azithromycin and erythromycin is assumed to be determined by hydroxyl radicals due to the lack of chromophores that support absorption of photons and hence initiation of photoreactions. As to spiramycin and tylosin on the other hand, degradation is determined by their own photoreactivity since they have conjugated double bonds that absorb photons leading to the photoreaction [9,52].


    3.2. Identified photoinduced degradation products

    All identified photodegradation products are shown in Table 3. Their proposed structures are shown in Figure 2.

    Table 3. Observed degradation products of macrolides together with their fragments derived from MS2 experiments as well as retention times of the products.
    substance photo-degradates Rt /min theoretical [M+H]+ observed [M+H]+ fragments
    Azithromycin 192 0.5 192.123 192.126 -
    591 4.8 591.422 591.427 434.315;
    296.217
    434 5.2 434.312 434.315 -
    735 5.4 735.500 735.506 591.426;
    368.257
    592 8.5 592.406 592.408 300.278;
    237.102
    720 8.8 720.453 720.462 540.308;
    375.266;
    250.994
    Erythromycin 192 0.6 192.123 192.123 -
    720 7.5 720.452 720.457 558.366;
    460.414;
    375.263
    Spiramycin 160 0.6 160.133 160.134 142.123
    322 3.2 322.186 322,185 118.086
    336 a 3.7 336.202 336.204 192.122;
    174.111;
    145.084;
    127.074;
    101.059
    336 b 4.4 336.202 336.204 192.122;
    174.111;
    145.084;
    127.074;
    101.059
    Tylosin 192 1.1 192.123 192.123 -
    215 1.8 215.128 215.090 -
    352 3.7 352.196 -
    336 4.2 336.202 336.201 -
     | Show Table
    DownLoad: CSV
    Figure 2. Known and proposed photodegradation products of azithromycin, erythromycin, spiramycin and tylosin resulting from UVC irradiation and identified by MS and MSn.

    Photodegradation products for azithromycin with m/z values of the quasi-molecular ions of 735,720,592,591 and 434 were observed and their structures identified. These seven products are consistent with the observations of Tong et al. [54]. In addition, a product with a m/z value of 192 was identified, see Figure 2.

    For erythromycin, products with m/z values of the quasi-molecular ions of 750,720, and 192 were found. These products were not reported previously in the literature.

    Batchu et al. identified products with m/z values of the quasi-molecular ions of 678,608,590 and 429. The occurence of these products could not be confirmed in this study, cf. Figure 1 [55] During the photodegradation of spiramycin, three products could be identified. The corresponding m/z values of the quasi-molecular ions were 160 and 336. The ion with a m/z value of 336 occurred at two different retention times in the chromatogram. The retention times were 3.8 and 4.2 min. Due to the relative similarity of the retention times, these degradates were assumed to be structurally similar products. An MSn analysis confirmed the hypothesis as the same fragments were obtained (data not shown). With regard to the detected masses and their c-t courses, the degradates represent intermediate photoproducts. The two species could be diastereoisomers, which may have been formed. The isomerism would occur at the position where the lactone ring was attached, i.e. stereoisomers with respect to a resulting hydroxyl group, which could assume R or S configuration, after sugar moiety cleavage from the lactone ring by hydroxyl radical substitution.

    The degradation of tylosin under UV irradiation has also been investigated several times [56,57,58]. However, no photodegradation products were described in these studies. In this work, sugar fragments were found as degradation products. The associated m/z values were 352,336,215 and 192, see Figure 1.


    3.3. MIC and QSAR

    Ecotoxicity was estimated through determination of the MICs against B. subtilis and Ps. fluorescens and through QSAR analysis. The results of both toxicity assessments are shown in Table 4.

    Table 4. MIC values of the antibiotics tested against the microorganisms Ps. fluorescens and B. subtilis and QSAR analysis of photodegradation products of macrolides with safer (Italic) and more dangerous (Bold) photoproducts as compared to the starting material. The starting concentrations of efficacy against the organisms were compared with the concentration of the efficacy of the photoproduct.
    compound MIC against B. subtilis /µg mL–1 MIC against Ps. fluorescens /µg mL–1 Daphnia magna LC50 (48 h) mg/La Fathead minnow LC50 (96 h) mg/La Fathead minnow LC50 (96 h) mg/Lb, c Branchiopoda LC50 (48 h) mg/Lb, d
    Azi A 5.90 49.48 80.84 0.33 - 3.04
    Azi B 72.43 0.87 - 2.22
    735 98.37 0.14 - 3.99
    720 202.02 - - 28.4
    592 108.58 0.04 - 23.4
    591 151.56 0.10 - 3.26
    434 97.23 4.09 695 23.3
    192 2067.67 4087.53 1.58E5 1780
    Ery A 0.21 96.90 135.5 - - 8.6
    Ery B 127.65 - - 0.98
    Ery C 193.84 - 340 11.3
    Ery F 333.08 - - 68.4
    716 129.61 - 193 6.36
    192 2067.67 4087.53 1.58E5 1780
    Spi I 7.03 177.75 69.14 - - 97
    Spi Ⅲ 15.00 - - 34.2
    336 579.58 410.60 2.69E5 -
    322 666.63 547.26 4E5 -
    160 367.72 1062.61 1.88E4 -
    702 211.54 - - 703
    Tyl A 1.26 160.80 104.55 - - 426
    Tyl B 76.56 - - 264
    352 347.51 683.37 4.39E4 -
    336 579.58 410.60 2.69E5 -
    215 90.11 246.51 551 -
    192 2067.67 4087.53 1.58E5 1780
    a T.E.S.T
    b QSAR Toolbox
    c Pimephales promelas
    d undefined testorganisms
     | Show Table
    DownLoad: CSV

    For the four macrolides, high MIC values were determined on Ps. fluorescens. Growth delay was also observed. This is indicative for the lack of efficiency against Ps. fluorescens, which is in agreement with expectations, since macrolides are administered against gram-positive bacterial infections. Due to the absence of activity against Ps. fluorescens, only B. subtilis was exposed to the drugs. The cleavage of the sugar moieties of macrolides upon irradiation as described above raised the expectation of inactivity of the degradates [43,59]. The ecotoxicity estimation using MIC was hence based on B. subtilis. To this purpose, it was assumed that environmental hazard would be minimal when the solution containing the drug ceased showing antibacterial activity. Using the degradation rate constants k1 from Table 2 and the MIC value, the time tTOX can be calculated according to Equation 4. Here, tTOX is the time when the solution of a compound with an initial concentration c0 is no longer active against the bacteria. The results are given in Table 5.

    Table 5. Calculated tTOX values of the four macrolides against B. subtilis.
    Substance k /min–1 MIC /µg·mL–1 tTOX /min
    Azi A 0.39 5.9 3.13
    Azi B 0.31 3.94
    Ery A 0.59 0.21 7.72
    Ery B 0.66 6.90
    Ery A–H2Oa 0.59 7.72
    Ery A–H2Ob 1.11 4.10
    Spi I 0.62 7.03 1.69
    Spi Ⅲ 0.64 1.63
    Tyl A 2.47 1.26 1.12
    Tyl B 1.66 1.67
     | Show Table
    DownLoad: CSV
    tTOX=ln(MICc0)k1 (4)

    Within eight minutes of irradiation, the MIC values were reached, meaning that all observed macrolides were no longer harmful to B. subtilis. Yet, the calculation does not clarify whether the phototransformation products were more active or ecotoxic than the original drug. The phototransformation products observed were mostly sugar compounds. A more detailed picture of whether a photoproduct would be environmentally hazardous may be provided by QSAR analysis.

    The QSAR analysis did not predict values for some of the degradation products and organisms, so that comparison with the parent drug was not possible. Generally, irradiation of the substances had a positive effect. It reduced the efficacy of the substances. The detected sugar fragments were predicted to have higher LC50 values than the intact lactone ring scaffold. This would lead to efficacy against the microorganisms tested and hence eco-toxicology. While these increased LC50 values were computed for some degradates, no values reaching into the lower μg L–1 range were predicted. Therefore, the predicted values would still remain well below concentrations found in surface waters.

    A comparison between different programs could be achieved on the basis of fathead minnow, a relevant organism to appear in both programs. Here, the values varied by several orders of magnitude and the toxicity were predicted differently for several photoproducts. This could be explained in terms of distinctive databases and calibration models implemented into the programs. Hence, output parameters but also calculation methods were different. The calculation of T.E.S.T. software was based on the database of EUCAST, while in the QSAR toolbox the calculation relied on the data of the European Chemicals Bureau. A literature search for reference data was unsuccessful. Despite the different absolute values, both predictions were consistent when inspecting the parent drug. Most photoproducts investigated were predicted to be potentially less toxic than the parent.

    Yet, QSAR methods rely on databases but the prediction is based on structural similarity. As an alternative to a computational approach, MIC values, i.e. experimental data, might be considered for eco-toxicological assessment [36,60]. Recent studies emphasize that IC50 values might be better suitable since they were assay independent [61]. Nevertheless, MIC values are easier and faster to obtain. Additionally, the quality of IC50 values also depends on the completeness of the sigmoidal curve, which might not be obtained under all circumstances. In this study, tylosin served an example for the other macrolides. A tylosin solution was exposed to UV irradiation and MIC values of the solution were determined at various exposure times, see Table 6. Under UV-irradiation the MIC values were expected to increase.

    Table 6. MIC values of aqueous solution of tylosin against B. subtilis depending on irradiation times.
    Irradiation time /min MIC against B. subtilis /mg L–1
    0 1.05
    1 2.1
    2.5 4.2
    3.5 > 8.41
    5 > 8.41
    7 > 8.41
     | Show Table
    DownLoad: CSV

    From Table 6, it can be seen that the longer tylosin was UV irradiated, the higher the MIC value grew. A maximum was reached between 2.5 min and 3.5 min, indicating that the efficacy of tylosin against B. subtilis decreased. With that loss of potency, it can be assumed that the solution provided no more hazard for the organisms and that the degradation products did not possess higher efficacy and hence potential eco-toxicity than the drug itself. Although this finding was exemplarily demonstrated for tylosin, preliminary studies for other antibiotic classes showed similar results.


    4. Conclusions

    The elimination of pharmaceuticals in water bodies using sustainable methods, as demonstrated in this study by using photolysis, was supported by an estimation of toxicity. The hypothesis that such degradation processes might produce substances even more toxic than the parent drug could not be confirmed. In this respect, MIC values were determined and QSAR analysis was performed. Based on four macrolides the products resulting from UV-C irradiation as well as the corresponding solution mixtures formed during irradiation were shown to be less or not ecotoxic in comparison to the parent antibiotic drugs. From these results, the efficacy of UV irradiation for water purification from antibiotics can be assumed. However, for the future of water purification, it is important to consider that there are other pharmaceuticals and anthropogenic micropollutants in waters that have different properties than macrolides. Their concentrations also depend on seasonal and local influences. In consequence, different exposure times and intensities may be needed to achieve complete degradation.


    Acknowledgements

    M.V. is grateful for a stipend from the Promotionskolleg of the Niederrhein University of Applied Sciences. The authors thank their institution for further financial support.


    Conflict of interest

    All authors declare no conflicts of interest in this paper


    [1] Conedera M, Krebs P, Tinner W, et al. (2004) The cultivation of Castanea sativa (Mill.) in Europe, from its origin to its diffusion on a continental scale. Veg Hist Archaeobot 13: 161–179.
    [2] Fernández-López J, Alía R (2003) Technical guidelines for genetic conservation and use for chestnut (Castanea sativa), Rome, Italy: EUFORGEN.
    [3] Braga N, Rodrigues F, Beatriz M, et al. (2015) Castanea sativa by-products: A review on added value and sustainable application. Nat Prod Res 29: 1–18. doi: 10.1080/14786419.2014.955488
    [4] Bounousa G (2014) Perspectives and future of the chestnut industry in Europe and all over the world. Acta Hortic 1043: 19–22.
    [5] Gomes-Laranjo J, Araujo-Alves J, Ferreira-Cardoso J, et al. (2004) Effect of chestnut ink disease on photosynthetic performance. J Phytopathol 152: 138–144. doi: 10.1111/j.1439-0434.2004.00814.x
    [6] Montenegro D, Aguin O, Sainz MJ, et al. (2008) Diversity of vegetative compatibility types, distribution of mating types and occurrence of hypovirulence of Cryphonectria parasitica in chestnut stands in NW Spain. For Ecol Manage 256: 973–980.
    [7] Vettraino AM, Morel O, Perlerou C, et al. (2005) Occurrence and distribution of Phytophthora species in European chestnut stands, and their association with ink disease and crown decline. Eur J Plant Pathol 111: 169–180. doi: 10.1007/s10658-004-1882-0
    [8] Choupina AB, Estevinho L, Martins IM (2014) Scientifically advanced solutions for chestnut ink disease. Appl Microbiol Biotechnol 98: 3905–3909. doi: 10.1007/s00253-014-5654-2
    [9] Martins LM, Oliveira MT, Abreu CG (1999) Soils and climatic characteristic of chestnut stands that differ on the presence of the ink disease. Acta Hortic 494: 447–449.
    [10] Waldboth M, Oberhuber W (2009) Synergistic effect of drought and chestnut blight (Cryphonectria parasitica) on growth decline of European chestnut (Castanea sativa). Forest Pathol 39: 43–55. doi: 10.1111/j.1439-0329.2008.00562.x
    [11] Desprez-Loustau ML, Robin C, Reynaud G, et al. (2007) Simulating the effects of a climate-change scenario on the geographical range and activity of forest-pathogenic fungi. Can J Plant Pathol 29: 101–120. doi: 10.1080/07060660709507447
    [12] Vacher C, Hampe A, Porté AJ, et al. (2016) The phyllosphere: Microbial jungle at the plant-climate interface. Ann Rev Ecol Evol Syst 47: 1–24. doi: 10.1146/annurev-ecolsys-121415-032238
    [13] Vorholt JA (2012) Microbial life in the phyllosphere. Nat Rev Microbiol 10: 828–840. doi: 10.1038/nrmicro2910
    [14] Meyer KM, Leveau JHJ (2012) Microbiology of the phyllosphere: A playground for testing ecological concepts. Oecologia 168: 621–629. doi: 10.1007/s00442-011-2138-2
    [15] Heaton JC, Jones K (2008) Microbial contamination of fruit and vegetables and the behaviour of enteropathogens in the phyllosphere: a review. J Appl Microbiol 104: 613–626. doi: 10.1111/j.1365-2672.2007.03587.x
    [16] Lindow SE, Leveau JH (2002) Phyllosphere microbiology. Curr Opin Biotechnol 13: 238–243. doi: 10.1016/S0958-1669(02)00313-0
    [17] Rico L, Ogaya R, Terradas J, et al. (2014) Community structures of N2-fixing bacteria associated with the phyllosphere of a Holm oak forest and their response to drought. Plant Biol 16: 586–593. doi: 10.1111/plb.12082
    [18] Furnkranz M, Wanek W, Richter A, et al. (2008) Nitrogen fixation by phyllosphere bacteria associated with higher plants and their colonizing epiphytes of a tropical lowland rainforest of Costa Rica. ISME J 2: 561–570. doi: 10.1038/ismej.2008.14
    [19] Sandhu A, Halverson LJ, Beattie GA (2007) Bacterial degradation of airborne phenol in the phyllosphere. Environ Microbiol 9: 383–392. doi: 10.1111/j.1462-2920.2006.01149.x
    [20] Manching HC, Balint-Kurti PJ, Stapleton AE (2014) Southern leaf blight disease severity is correlated with decreased maize leaf epiphytic bacterial species richness and the phyllosphere bacterial diversity decline is enhanced by nitrogen fertilization. Front Plant Sci 5: 403.
    [21] Müller T, Behrendt U, Ruppel S, et al. (2016) Fluorescent pseudomonads in the phyllosphere of wheat: potential antagonists against fungal pPhytopathogens. Curr Microbiol 72: 383–389. doi: 10.1007/s00284-015-0966-8
    [22] Ritpitakphong U, Falquet L, Vimoltust A, et al. (2016) The microbiome of the leaf surface of Arabidopsis protects against a fungal pathogen. New Phytol 210: 1033–1043. doi: 10.1111/nph.13808
    [23] Mazinani Z, Zamani M, Sardari S (2017) Isolation and identification of phyllospheric bacteria possessing antimicrobial activity from Astragalus obtusifolius, Prosopis juliflora, Xanthium strumarium and Hippocrepis unisiliqousa. Avicenna J Med Biotechnol 9: 31–37.
    [24] Krechel A, Faupel A, Hallmann J, et al. (2002) Potato-associated bacteria and their antagonistic potential towards plant-pathogenic fungi and the plant-parasitic nematode Meloidogyne incognita (Kofoid & White) Chitwood. Can J Microbiol 48: 772–786. doi: 10.1139/w02-071
    [25] Fravel DR (2005) Commercialization and implementation of biocontrol. Annu Rev Phytopathol 43: 337–359. doi: 10.1146/annurev.phyto.43.032904.092924
    [26] Yadav RKP, Karamanoli K, Vokou D (2005) Bacterial colonization of the phyllosphere of Mediterranean perennial species as influenced by leaf structural and chemical features. Microb Ecol 50: 185–196. doi: 10.1007/s00248-004-0171-y
    [27] Peñuelas J, Rico L, Ogaya R, et al. (2012) Summer season and long-term drought increase the richness of bacteria and fungi in the foliar phyllosphere of Quercus ilex in a mixed Mediterranean forest. Plant Biol 14: 565–575. doi: 10.1111/j.1438-8677.2011.00532.x
    [28] Valverde A, Igual JM, Regina IS, et al. (2005) Preliminary diversity studies of culturable phyllosphere bacteria on chestnut (Castanea sativa). Acta Hortic 693: 263–270.
    [29] Salazar-Iglesias S (2008) Estudio de los procesos ecológicos para el desarrollo sostenible del castaño (Castanea sativa Mill.) de la Sierra de Francia (PhD dissertation). Salamanca, Spain: University of Salamanca.
    [30] Jacobs JL, Sundin GW (2001) Effect of solar UV-B radiation on a phyllosphere bacterial community. Appl Environ Microbiol 67: 5488–5496. doi: 10.1128/AEM.67.12.5488-5496.2001
    [31] 
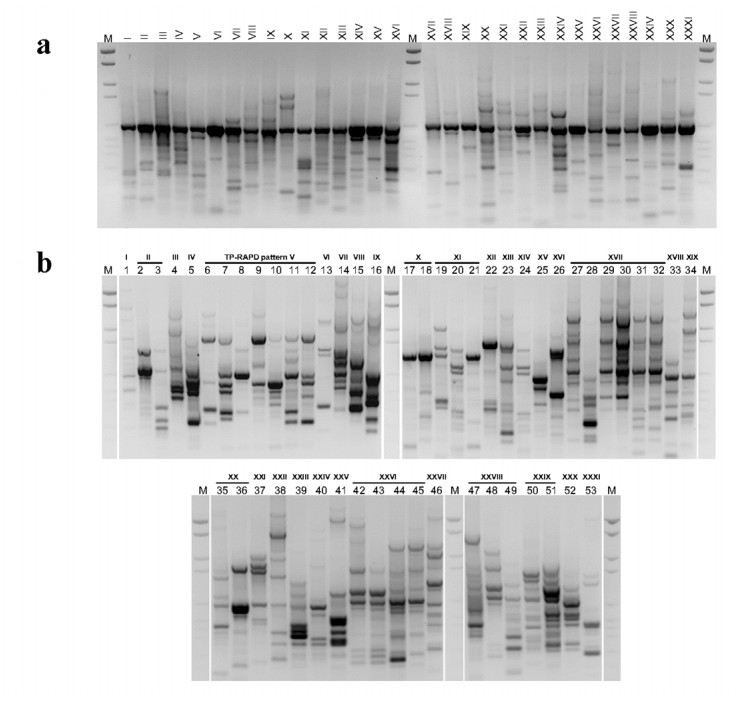
Rivas R, Velazquez E, Valverde A, et al. (2001) A two primers random amplified polymorphic DNA procedure to obtain polymerase chain reaction fingerprints of bacterial species. Electrophoresis 22: 1086–1089. doi: 10.1002/1522-2683()22:6<1086::AID-ELPS1086>3.0.CO;2-6
    [32] Valverde A, Igual JM, Peix A, et al. (2006) Rhizobium lusitanum sp nov a bacterium that nodulates Phaseolus vulgaris. Int J Syst Evol Microbiol 56: 2631–2637. doi: 10.1099/ijs.0.64402-0
    [33] Altschul SF, Madden TL, Schäffer AA, et al. (1997) Gapped BLAST and PSI-BLAST: A new generation of protein database search programs. Nucleic Acids Res 25: 3389–3402. doi: 10.1093/nar/25.17.3389
    [34] Pearson WR, Lipman DJ (1988) Improved tools for biological sequence comparison. Proc Natl Acad Sci USA 85: 2444–2448. doi: 10.1073/pnas.85.8.2444
    [35] Yoon SH, Ha SM, Kwon S, et al. (2017) Introducing EzBioCloud: A taxonomically united database of 16S rRNA and whole genome assemblies. Int J Syst Evol Microbiol (in press).
    [36] Thompson JD, Gibson TJ, Plewniak F, et al. (1997) The CLUSTAL X windows interface: Flexible strategies for multiple sequence alignment aided by quality analysis tools. Nucleic Acids Res 25: 4876–4882. doi: 10.1093/nar/25.24.4876
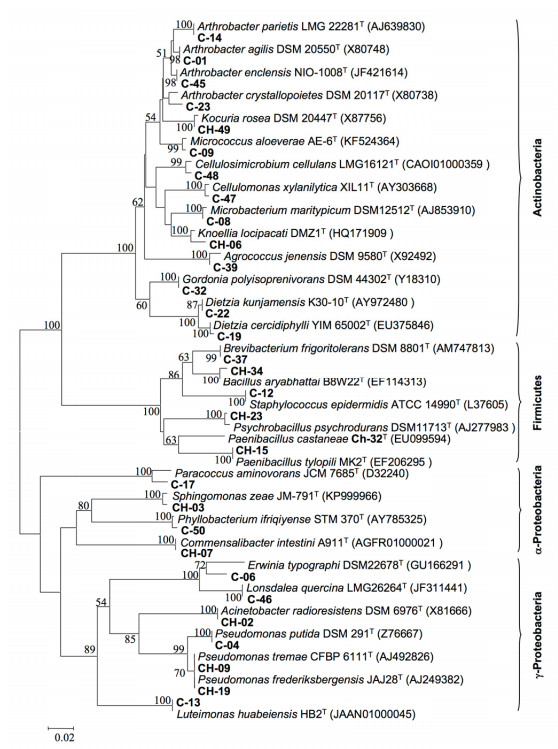
    [37] Saitou N, Nei M (1987) The neighbor-joining method: a new method for reconstructing phylogenetic trees. Mol Biol Evol 4: 406–425.
    [38] Kimura M (1980) A simple method for estimating evolutionary rates of base substitutions through comparative studies of nucleotide sequences. J Mol Evol 16: 111–120. doi: 10.1007/BF01731581
    [39] Tamura K, Dudley J, Nei M, et al. (2007) MEGA4: molecular evolutionary genetics analysis (MEGA) software version 4.0. Mol Biol Evol 24: 1596–1599. doi: 10.1093/molbev/msm092
    [40] Ansari MA, Tirry L, Moens M (2005) Antagonism between entomopathogenic fungi and bacterial symbionts of entomopathogenic nematodes. Biocontrol 50: 465–475. doi: 10.1007/s10526-004-5524-4
    [41] Bric JM, Bostock RM, Silverstone SE (1991) Rapid in situ assay for indoleacetic-acid production by bacteria immobilized on a nitrocellulose membrane. Appl Environ Microbiol 57: 535–538.
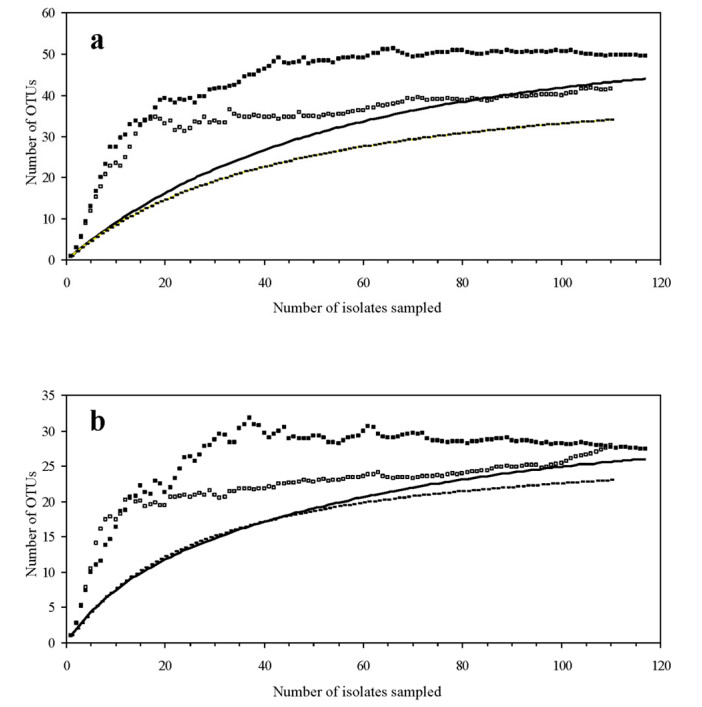
    [42] Chao A, Shen TJ (2003) Program SPADE (Species Prediction and Diversity Estimation), Program and User's Guide. Available from: http://chao.stat.nthu.edu.tw/word press/software_download/.
    [43] 
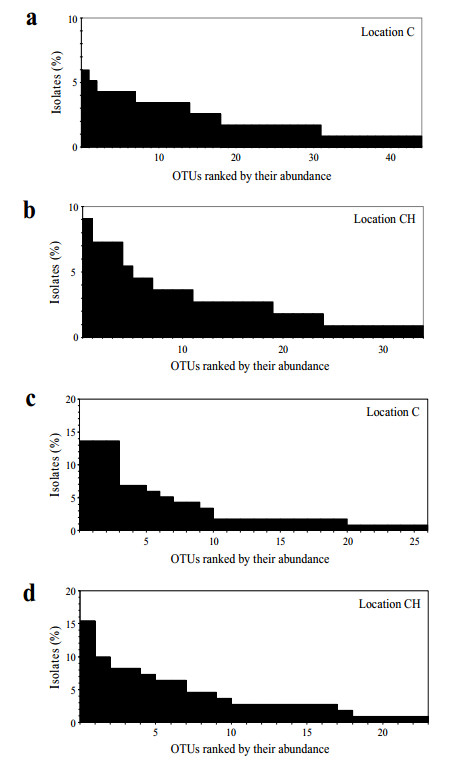
Colwell RK, Elsensohn JE (2014) EstimateS turns 20: Statistical estimation of species richness and shared species from samples, with non-parametric extrapolation. Ecography 37: 609–613. doi: 10.1111/ecog.00814
    [44] Achtman M, Wagner M (2008) Microbial diversity and the genetic nature of microbial species. Nat Rev Microbiol 6: 431–440.
    [45] Stackebrandt E, Frederiksen W, Garrity GM, et al. (2002) Report of the ad hoc committee for the re-evaluation of the species definition in bacteriology. Int J Syst Evol Microbiol 52: 1043–1047.
    [46] Rivas R, Velázquez E, Palomo JL, et al. (2002) Rapid identification of Clavibacter michiganensis subspecies sepedonicus using two primers random amplified polymorphic DNA (TP-RAPD) fingerprints. Eur J Plant Pathol 108: 179–184. doi: 10.1023/A:1015044911913
    [47] Valverde A, Peix A, Rivas R, et al. (2008) Paenibacillus castaneae sp nov., isolated from the phyllosphere of Castanea sativa Miller. Int J Syst Evol Microbiol 58: 2560–2564.
    [48] Velázquez E, Rojas M, Lorite MJ, et al. (2008) Genetic diversity of endophytic bacteria which could be find in the apoplastic sap of the medullary parenchym of the stem of healthy sugarcane plants. J Basic Microbiol 48: 118–124. doi: 10.1002/jobm.200700161
    [49] Huey B, Hall J (1989) Hypervariable DNA fingerprinting in Escherichia coli: minisatellite probe from bacteriophage M13. J Bacteriol 171: 2528–2532. doi: 10.1128/jb.171.5.2528-2532.1989
    [50] Velázquez E, Valverde A, Rivas R, et al. (2010) Strains nodulating Lupinus albus on different continents belong to several new chromosomal and symbiotic lineages within Bradyrhizobium. Antonie Van Leeuwenhoek 97: 363–376. doi: 10.1007/s10482-010-9415-7
    [51] Laforest-Lapointe I, Messier C, Kembel SW (2016) Tree phyllosphere bacterial communities: Exploring the magnitude of intra- and inter-individual variation among host species. PeerJ 4: e2367. doi: 10.7717/peerj.2367
    [52] Becker R, Behrendt U, Hommel B, et al. (2008) Effects of transgenic fructan-producing potatoes on the community structure of rhizosphere and phyllosphere bacteria. FEMS Microbiol Ecol 66: 411–425. doi: 10.1111/j.1574-6941.2008.00562.x
    [53] Redford AJ, Bowers RM, Knight R, et al. (2010) The ecology of the phyllosphere: Geographic and phylogenetic variability in the distribution of bacteria on tree leaves. Environ Microbiol 12: 2885–2893. doi: 10.1111/j.1462-2920.2010.02258.x
    [54] Kumar J, Babele PK, Singh D, et al. (2016) UV-B radiation stress causes alterations in whole cell protein profile and expression of certain genes in the rice phyllospheric bacterium Enterobacter cloacae. Front Microbiol 7: 1440.
    [55] Kadivar H, Stapleton AE (2003) Ultraviolet radiation alters maize phyllosphere bacterial diversity. Microb Ecol 45: 353–361. doi: 10.1007/s00248-002-1065-5
    [56] De la Vega UP, Rettberg P, Douki T, et al. (2005) Sensitivity to polychromatic UV-radiation of strains of Deinococcus radiodurans differing in their DNA repair capacity. Int J Radiat Biol 81: 601–611. doi: 10.1080/09553000500309374
    [57] Jacobs JL, Carroll TL, Sundin GW (2005) The role of pigmentation, ultraviolet radiation tolerance, and leaf colonization strategies in the epiphytic survival of phyllosphere bacteria. Microb Ecol 49: 104–113. doi: 10.1007/s00248-003-1061-4
    [58] Cazorla FM, Codina JC, Abad C, et al. (2008) 62-kb plasmids harboring rulAB homologues confer UV-tolerance and epiphytic fitness to Pseudomonas syringae pv. syringae mango isolates. Microb Ecol 56: 283–291. doi: 10.1007/s00248-007-9346-7
    [59] Martirosyan V, Unc A, Miller G, et al. (2016) Desert Perennial Shrubs Shape the Microbial-Community Miscellany in Laimosphere and Phyllosphere Space. Microb Ecol 72: 659–668. doi: 10.1007/s00248-016-0822-9
    [60] Ueda Y, Frindte K, Knief C, et al. (2016) Effects of elevated tropospheric ozone concentration on the bacterial community in the phyllosphere and rhizoplane of rice. PLoS One 11: e0163178. doi: 10.1371/journal.pone.0163178
    [61] Ren G, Zhu C, Alam MS, et al. (2015) Response of soil, leaf endosphere and phyllosphere bacterial communities to elevated CO2 and soil temperature in a rice paddy. Plant Soil 392: 27–44. doi: 10.1007/s11104-015-2503-8
    [62] Fonseca-García C, Coleman-Derr D, Garrido E, et al. (2016) The cacti microbiome: interplay between habitat-filtering and host-specificity. Front Microbiol 7: 150.
    [63] Kembel SW, O'Connor TK, Arnold HK, et al. (2014) Relationships between phyllosphere bacterial communities and plant functional traits in a neotropical forest. Proc Natl Acad Sci USA 111: 13715–13720. doi: 10.1073/pnas.1216057111
    [64] Dees MW, Lysøe E, Nordskog B, et al. (2015) Bacterial communities associated with surfaces of leafy greens: Shift in composition and decrease in richness over time. Appl Environ Microbiol 81: 1530–1539. doi: 10.1128/AEM.03470-14
    [65] Müler T, Müller M, Behrendt U, et al. (2003) Diversity of culturable phyllosphere bacteria on beech and oak: the effects of lepidopterous larvae. Microbiol Res 158: 291–297. doi: 10.1078/0944-5013-00207
    [66] Lambais MR, Barrera SE, Santos EC, et al. (2017) Phyllosphere metaproteomes of trees from the Brazilian Atlantic forest show high levels of functional redundancy. Microb Ecol 73: 123–134. doi: 10.1007/s00248-016-0878-6
    [67] Behrendt U, Ulrich A, Schumann P (2003) Fluorescent pseudomonads associated with the phyllosphere of grasses; Pseudomonas trivialis sp nov., Pseudomonas poae sp nov and Pseudomonas congelans sp nov. Int J Syst Evol Microbiol 53: 1461–1469.
    [68] Behrendt U, Ulrich A, Schumann P, et al. (2002) Diversity of grass-associated Microbacteriaceae isolated from the phyllosphere and litter layer after mulching the sward; polyphasic characterization of Subtercola pratensis sp nov., Curtobacterium herbarum sp nov and Plantibacter flavus gen. nov., sp nov. Int J Syst Evol Microbiol 52: 1441–1454.
    [69] Lambais MR, Crowley DE, Cury JC, et al. (2006) Bacterial diversity in tree canopies of the Atlantic forest. Science 312: 1917. doi: 10.1126/science.1124696
    [70] Rivas R, Garcia-Fraile P, Mateos PF, et al. (2007) Characterization of xylanolytic bacteria present in the bract phyllosphere of the date palm Phoenix dactylifera. Lett Appl Microbiol 44: 181–187. doi: 10.1111/j.1472-765X.2006.02050.x
    [71] Yang CH, Crowley DE, Borneman J, et al. (2001) Microbial phyllosphere populations are more complex than previously realized. Proc Natl Acad Sci USA 98: 3889–3894. doi: 10.1073/pnas.051633898
    [72] Lindow SE, Brandl MT (2003) Microbiology of the phyllosphere. Appl Environ Microbiol 69: 1875–1883. doi: 10.1128/AEM.69.4.1875-1883.2003
    [73] Jackson EF, Echlin HL, Jackson CR (2006) Changes in the phyllosphere community of the resurrection fern, Polypodium polypodioides, associated with rainfall and wetting. FEMS Microbiol Ecol 58: 236–246. doi: 10.1111/j.1574-6941.2006.00152.x
    [74] Brady CL, Cleenwerck I, Denman S, et al. (2012) Proposal to reclassify Brenneria quercina (Hildebrand and Schroth 1967) Hauben et al. 1999 into a new genus, Lonsdalea gen. nov., as Lonsdalea quercina comb. nov., descriptions of Lonsdalea quercina subsp. quercina comb. nov., Lonsdalea quercina subsp. iberica subsp. nov. and Lonsdalea quercina subsp. britannica subsp. nov. Int J Syst Evol Microbiol 62: 1592–1602.
    [75] Enya J, Shinohara H, Yoshida S, et al. (2007) Culturable leaf-associated bacteria on tomato plants and their potential as biological control agents. Microb Ecol 53: 524–536. doi: 10.1007/s00248-006-9085-1
    [76] Liu CH, Chen X, Liu TT, et al. (2007) Study of the antifungal activity of Acinetobacter baumannii LCH001 in vitro and identification of its antifungal components. Appl Microbiol Biotechnol 76: 459–466. doi: 10.1007/s00253-007-1010-0
    [77] Liu X, Jia J, Atkinson S, et al. (2010) Biocontrol potential of an endophytic Serratia sp G3 and its mode of action. World J Microbiol Biotechnol 26: 1465–1471. doi: 10.1007/s11274-010-0321-y
    [78] Bedini S, Bagnoli G, Sbrana C, et al. (1999) Pseudomonads isolated from within fruit bodies of Tuber borchii are capable of producing biological control or phytostimulatory compounds in pure culture. Symbiosis 26: 223–236.
    [79] Wilhelm E, Arthofer W, Schafleitner R, et al. (1998) Bacillus subtilis an endophyte of chestnut (Castanea sativa) as antagonist against chestnut blight (Cryphonectria parasitica). Plant Cell Tissue Organ Cult 52: 105–108. doi: 10.1023/A:1005917906769
    [80] Aravind R, Kumar A, Eapen SJ, et al. (2009) Endophytic bacterial flora in root and stem tissues of black pepper (Piper nigrum L.) genotype: isolation, identification and evaluation against Phytophthora capsici. Lett Appl Microbiol 48: 58–64.
    [81] Cirvilleri G, Spina S, Iacona C, et al. (2008) Study of rhizosphere and phyllosphere bacterial community and resistance to bacterial canker in genetically engineered phytochrome A cherry plants. J Plant Physiol 165: 1107–1119. doi: 10.1016/j.jplph.2008.01.009
    [82] Sharma A, Wray V, Johri BN (2007) Rhizosphere Pseudomonas sp strains reduce occurrence of pre- and post-emergence damping-off in chile and tomato in Central Himalayan region. Arch Microbiol 187: 321–335. doi: 10.1007/s00203-006-0197-2
    [83] Timmusk S, van West P, Gow NAR, et al. (2009) Paenibacillus polymyxa antagonizes oomycete plant pathogens Phytophthora palmivora and Pythium aphanidermatum. J Appl Microbiol 106: 1473–1481. doi: 10.1111/j.1365-2672.2009.04123.x
    [84] Verma VC, Gond SK, Kumar A, et al. (2009) Endophytic Actinomycetes from Azadirachta indica A. Juss.: isolation, diversity, and anti-microbial activity. Microb Ecol 57: 749–756.
    [85] Weinert N, Meincke R, Gottwald C, et al. (2010) Bacterial diversity on the surface of potato tubers in soil and the influence of the plant genotype. FEMS Microbiol Ecol 74: 114–123. doi: 10.1111/j.1574-6941.2010.00936.x
    [86] Biondi N, Piccardi R, Margheri MC, et al. (2004) Evaluation of Nostoc strain ATCC 53789 as a potential source of natural pesticides. Appl Environ Microbiol 70: 3313–3320. doi: 10.1128/AEM.70.6.3313-3320.2004
    [87] El-Tarabily KA, Sivasithamparam K (2006) Non-streptomycete actinomycetes as biocontrol agents of soil-borne fungal plant pathogens and as plant growth promoters. Soil Biol Biochem 38: 1505–1520. doi: 10.1016/j.soilbio.2005.12.017
    [88] Kavroulakis N, Ntougias S, Besi MI, et al. (2010) Antagonistic bacteria of composted agro-industrial residues exhibit antibiosis against soil-borne fungal plant pathogens and protection of tomato plants from Fusarium oxysporum f.sp radicis-lycopersici. Plant Soil 333: 233–247. doi: 10.1007/s11104-010-0338-x
    [89] Glandorf DCM, Verheggen P, Jansen T, et al. (2001) Effect of genetically modified Pseudomonas putida WCS358r on the fungal rhizosphere microflora of field-grown wheat. Appl Environ Microbiol 67: 3371–3378. doi: 10.1128/AEM.67.8.3371-3378.2001
    [90] Khan MR, Fischer S, Egan D, et al. (2006) Biological control of fusarium seedling blight disease of wheat and barley. Phytopathology 96: 386–394. doi: 10.1094/PHYTO-96-0386
    [91] Lee SW, Cooksey DA (2000) Genes expressed in Pseudomonas putida during colonization of a plant-pathogenic fungus. Appl Environ Microbiol 66: 2764–2772. doi: 10.1128/AEM.66.7.2764-2772.2000
    [92] Brandl MT, Quinones B, Lindow SE (2001) Heterogeneous transcription of an indoleacetic acid biosynthetic gene in Erwinia herbicola on plant surfaces. Proc Natl Acad Sci USA 98: 3454–3459. doi: 10.1073/pnas.061014498
  • This article has been cited by:

    1. Ethan Hain, Hollie Adejumo, Bridget Anger, Joseph Orenstein, Lee Blaney, Advances in antimicrobial activity analysis of fluoroquinolone, macrolide, sulfonamide, and tetracycline antibiotics for environmental applications through improved bacteria selection, 2021, 03043894, 125686, 10.1016/j.jhazmat.2021.125686
    2. Melanie Voigt, Alexander Wirtz, Kerstin Hoffmann-Jacobsen, Martin Jaeger, Prior art for the development of a fourth purification stage in wastewater treatment plant for the elimination of anthropogenic micropollutants-a short-review, 2020, 7, 2372-0352, 69, 10.3934/environsci.2020005
    3. Melanie Voigt, Benjamin Hentschel, Nina Theiss, Christina Savelsberg, Indra Bartels, Anna Nickisch-Hartfiel, Martin Jaeger, Lomefloxacin—Occurrence in the German River Erft, Its Photo-Induced Elimination, and Assessment of Ecotoxicity, 2020, 2, 2571-8797, 74, 10.3390/cleantechnol2010006
    4. Wei Li, Baoling Lyu, Jiping Li, Gregory V. Korshin, Meng Zhang, Yinlong Zhang, Pingping Li, Jiangang Han, Phototransformation of roxithromycin in the presence of dissolved organic matter: Characteriazation of the degradation products and toxicity evaluation, 2020, 733, 00489697, 139348, 10.1016/j.scitotenv.2020.139348
    5. Melanie Voigt, Martin Jaeger, Structure and QSAR analysis of photoinduced transformation products of neonicotinoids from EU watchlist for ecotoxicological assessment, 2021, 751, 00489697, 141634, 10.1016/j.scitotenv.2020.141634
    6. Melanie Voigt, Indra Bartels, Anna Nickisch-Hartfiel, Martin Jaeger, Determination of minimum inhibitory concentration and half maximal inhibitory concentration of antibiotics and their degradation products to assess the eco-toxicological potential, 2019, 101, 0277-2248, 315, 10.1080/02772248.2019.1687706
    7. Melanie Voigt, Indra Bartels, Dorothee Schmiemann, Lars Votel, Kerstin Hoffmann-Jacobsen, Martin Jaeger, Metoprolol and Its Degradation and Transformation Products Using AOPs—Assessment of Aquatic Ecotoxicity Using QSAR, 2021, 26, 1420-3049, 3102, 10.3390/molecules26113102
    8. Dorothee Schmiemann, Lisa Hohenschon, Indra Bartels, Andrea Hermsen, Felix Bachmann, Arno Cordes, Martin Jäger, Jochen Stefan Gutmann, Kerstin Hoffmann-Jacobsen, Enzymatic post-treatment of ozonation: laccase-mediated removal of the by-products of acetaminophen ozonation, 2023, 1614-7499, 10.1007/s11356-023-25913-w
    9. Yichen Xu, Yutong Zhang, Xinhao Wang, Zhe Wang, Liuqing Huang, Hao Wu, Jinghua Ren, Cheng Gu, Zhanghao Chen, Enhanced photodegradation of tylosin in the presence of natural montmorillonite: Synergistic effects of adsorption and surface hydroxyl radicals, 2023, 855, 00489697, 158750, 10.1016/j.scitotenv.2022.158750
    10. Shaoqing Zhang, Jia-Qian Jiang, Michael Petri, Removing imidacloprid, bisphenol-S and azithromycin by ferrate (Fe(VI)): efficiency, oxidation products, toxicity and kinetics, 2022, 8, 26670100, 100552, 10.1016/j.envc.2022.100552
    11. Klaudia Stando, Patrycja Kasprzyk, Ewa Felis, Sylwia Bajkacz, Heterogeneous Photocatalysis of Metronidazole in Aquatic Samples, 2021, 26, 1420-3049, 7612, 10.3390/molecules26247612
    12. Qingjiang Yuan, Meiping Sui, Chengzhi Qin, Hongying Zhang, Yingjie Sun, Siyi Luo, Jianwei Zhao, Migration, Transformation and Removal of Macrolide Antibiotics in The Environment: A Review, 2022, 29, 0944-1344, 26045, 10.1007/s11356-021-18251-2
    13. Melanie Voigt, Victoria Langerbein, Martin Jaeger, In silico ecotoxicity assessment of photoinduced imidacloprid degradation using HPLC–HRMS, QSAR and ecotoxicity equivalents, 2022, 34, 2190-4707, 10.1186/s12302-022-00616-0
    14. Lua Vazquez, Lúcio M.M.T. Gomes, Pedro H. Presumido, Daniela G.D. Rocca, Regina F.P.M. Moreira, Thierry Dagnac, Maria Llompart, Ana I. Gomes, Vítor J.P. Vilar, Tubular membrane photoreactor for the tertiary treatment of urban wastewater towards antibiotics removal: application of different photocatalyst/oxidant combinations and ozonation, 2023, 22133437, 109766, 10.1016/j.jece.2023.109766
    15. Nasser Ibrahim Zouli, Photodegradation of a Broad-Spectrum Antibiotic Azithromycin Using H2O2 under Ultraviolet Irradiation, 2024, 25, 1422-0067, 6702, 10.3390/ijms25126702
    16. Klaudia Stando, Paulina Zogornik, Marta Kopiec, Martyna Pieszczek, Katarzyna Kowalska, Ewa Felis, Sylwia Bajkacz, Degradation of fluoroquinolones and macrolides by solar light-driven heterogeneous photocatalysis – Proposed drug transformation pathways, 2024, 453, 10106030, 115651, 10.1016/j.jphotochem.2024.115651
  • Reader Comments
  • © 2017 the Author(s), licensee AIMS Press. This is an open access article distributed under the terms of the Creative Commons Attribution License (http://creativecommons.org/licenses/by/4.0)
通讯作者: 陈斌, bchen63@163.com
  • 1. 

    沈阳化工大学材料科学与工程学院 沈阳 110142

  1. 本站搜索
  2. 百度学术搜索
  3. 万方数据库搜索
  4. CNKI搜索

Metrics

Article views(8071) PDF downloads(1185) Cited by(10)

Article outline

Figures and Tables

Figures(5)  /  Tables(3)

/

DownLoad:  Full-Size Img  PowerPoint
Return
Return

Catalog