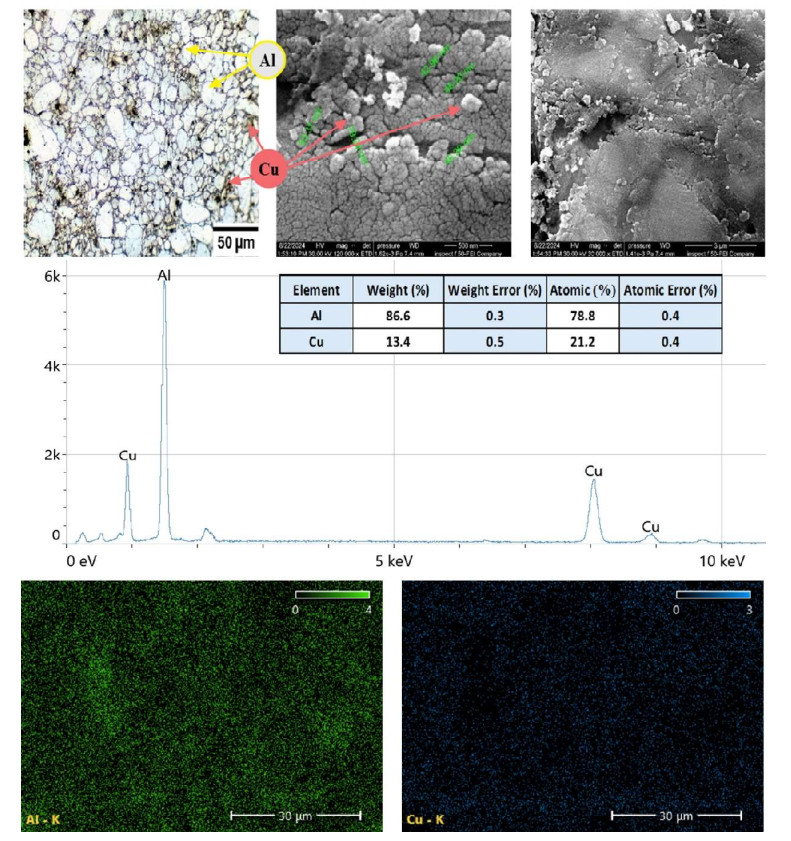
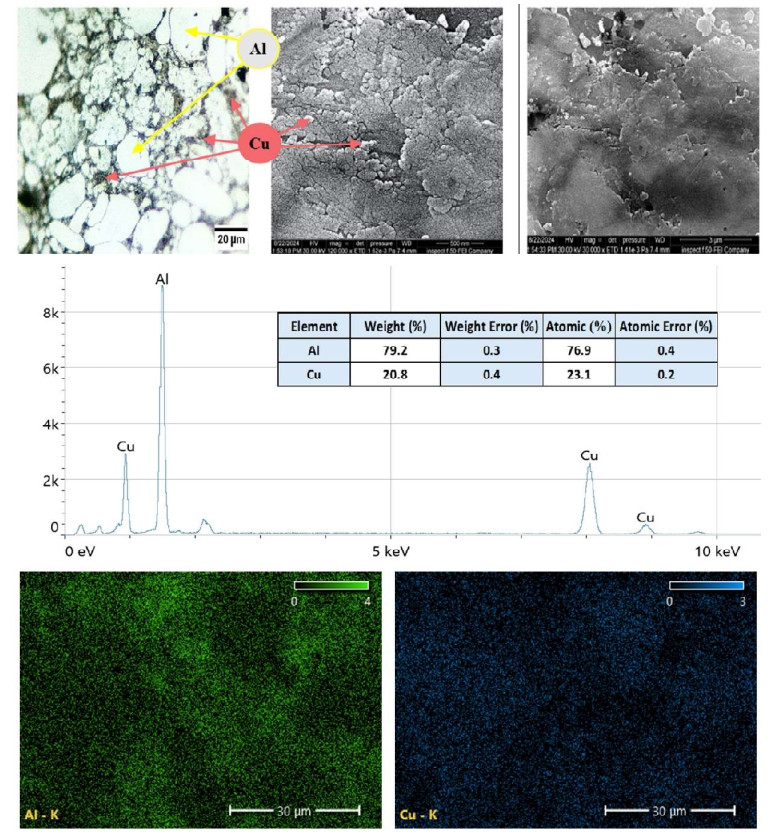
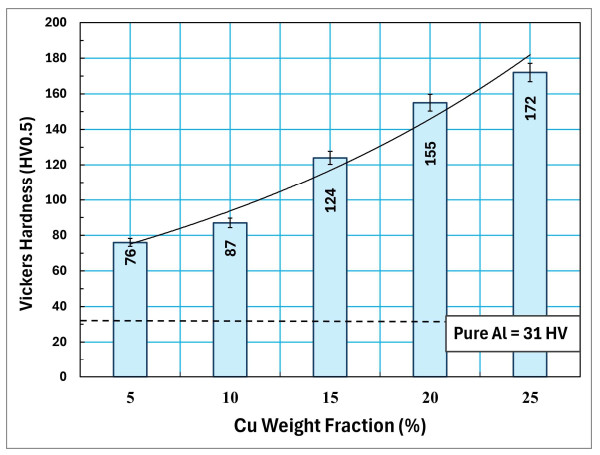
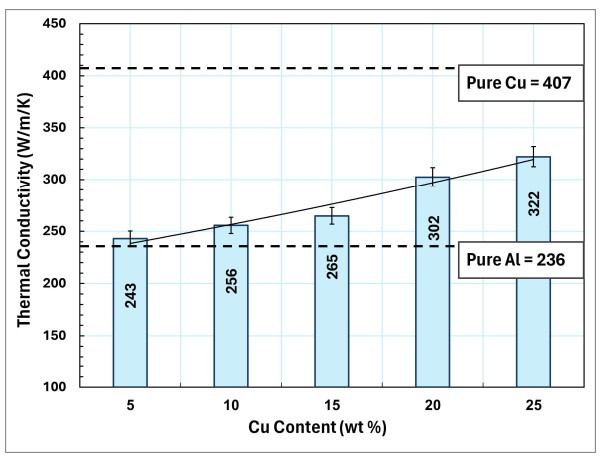
Nanoparticles of metal and other materials are a proven reinforcing material for producing a high-performance aluminum composite utilized in modern engineering applications. The ultrasonic mixing process is conducted to ensure a typical distribution of nanoparticles in the aluminum matrix. The present work aims to study the effect of copper nanoparticles on microhardness and physical properties of Al-composite prepared by powder metallurgy techniques with ultrasonic mixing. The aluminum nanocomposites were fabricated with different volume fractions (0, 5, 10, 15, 20, and 25 wt%) of Cu nanoparticles. To examine the effectiveness of the mixing, compacting, and sintering process, nanocomposites were characterized using field emission scanning electron microscopy (FESEM) and energy-dispersive X-ray (EDX) and elemental mapping analysis. A uniform distribution of Cu nanoparticles was established within the Al matrix. The composite was characterized by an increase in density and a decrease in porosity with increased Cu nanoparticles. Increasing Cu nanoparticles enhanced the mechanical properties of the Al-Cu composite through an increase in its hardness. A direct relationship between Cu nanoparticles and thermal and electrical conductivity was found; in particular, there was a distinct enhancement in electrical conductivity, as the composite with 25 wt% Cu nanoparticles reached 78.87% of the electrical conductivity of pure Cu.
Citation: Omar Hassan Mahmood, Mustafa Sh. Aljanabi, Farouk M. Mahdi. Effect of Cu nanoparticles on microhardness and physical properties of aluminum matrix composite prepared by PM[J]. AIMS Materials Science, 2025, 12(2): 245-257. doi: 10.3934/matersci.2025013
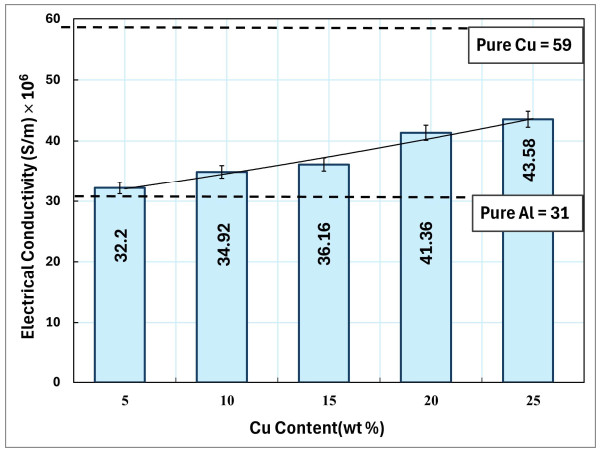
Nanoparticles of metal and other materials are a proven reinforcing material for producing a high-performance aluminum composite utilized in modern engineering applications. The ultrasonic mixing process is conducted to ensure a typical distribution of nanoparticles in the aluminum matrix. The present work aims to study the effect of copper nanoparticles on microhardness and physical properties of Al-composite prepared by powder metallurgy techniques with ultrasonic mixing. The aluminum nanocomposites were fabricated with different volume fractions (0, 5, 10, 15, 20, and 25 wt%) of Cu nanoparticles. To examine the effectiveness of the mixing, compacting, and sintering process, nanocomposites were characterized using field emission scanning electron microscopy (FESEM) and energy-dispersive X-ray (EDX) and elemental mapping analysis. A uniform distribution of Cu nanoparticles was established within the Al matrix. The composite was characterized by an increase in density and a decrease in porosity with increased Cu nanoparticles. Increasing Cu nanoparticles enhanced the mechanical properties of the Al-Cu composite through an increase in its hardness. A direct relationship between Cu nanoparticles and thermal and electrical conductivity was found; in particular, there was a distinct enhancement in electrical conductivity, as the composite with 25 wt% Cu nanoparticles reached 78.87% of the electrical conductivity of pure Cu.

| [1] |
Torralba JD, Da Costa CE, Velasco F (2003) P/M aluminum matrix composites: An overview. J Mater Process Tech 133: 203–206. https://doi.org/10.1016/S0924-0136(02)00234-0 doi: 10.1016/S0924-0136(02)00234-0

|
| [2] | Dieter GE, Bacon D (1988) Mechanical Metallurgy, New York: McGraw-Hill Companies. |
| [3] |
Abtan NS, Jassim AH, Al-Janabi MSM (2018) Tensile strength, micro-hardness and microstructure of friction-stir-welding AA6061-T4 joints. Tikrit J Eng Sci 25: 51–56. https://doi.org/10.25130/tjes.25.4.09 doi: 10.25130/tjes.25.4.09
|
| [4] |
Raturi A, Mer KKS, Pant PK (2017) Synthesis and characterization of mechanical, tribological and micro structural behaviour of Al 7075 matrix reinforced with nano Al2O3 particles. Mater Today Proc 4: 2645–2658. https://doi.org/10.1016/J.MATPR.2017.02.139 doi: 10.1016/J.MATPR.2017.02.139
|
| [5] |
Jiang W, Zhu J, Li G, et al. (2021) Enhanced mechanical properties of 6082 aluminum alloy via SiC addition combined with squeeze casting. J Mater Sci Technol 88: 119–131. https://doi.org/10.1016/j.jmst.2021.01.077 doi: 10.1016/j.jmst.2021.01.077
|
| [6] |
Zhu J, Jiang W, Li G, et al. (2020) Microstructure and mechanical properties of SiCnp/Al6082 aluminum matrix composites prepared by squeeze casting combined with stir casting. J Mater Process Technol 283: 116699. https://doi.org/10.1016/j.jmatprotec.2020.116699 doi: 10.1016/j.jmatprotec.2020.116699
|
| [7] |
Annaz AA, Irhayyim SS, Hamada ML, et al. (2020) Comparative study of mechanical performance between Al–graphite and Cu–graphite self-lubricating composites reinforced by nano-Ag particles. AIMS Mater Sci 7: 534–551. https://doi.org/10.3934/matersci.2020.5.534 doi: 10.3934/matersci.2020.5.534
|
| [8] |
Rahimipour MR, Tofigh AA, Mazahery A, et al. (2013) Enhancement of abrasive wear resistance in consolidated Al matrix composites via extrusion process. Tribol Mater Surf Interfaces 7: 129–134. https://doi.org/10.1179/1751584x13y.0000000034 doi: 10.1179/1751584x13y.0000000034
|
| [9] |
Alaneme KK, Fajemisin AV, Maledi N (2019) Development of aluminium-based composites reinforced with steel and graphite particles: Structural, mechanical and wear characterization. J Mater Res Technol 8: 670–682. https://doi.org/10.1016/J.JMRT.2018.04.019 doi: 10.1016/J.JMRT.2018.04.019
|
| [10] | Talabi HK, Adewuyi BO, Olaniran O, et al. (2019) Mechanical and wear behavior of Al6063 reinforced with snail shell and copper nanoparticles. Ann Fac Eng Hunedoara 17: 81–85. |
| [11] |
Afkham Y, Khosroshahi RA, Rahimpour S, et al. (2017) Enhanced mechanical properties of in situ aluminium matrix composites reinforced by alumina nanoparticles. Arch Civ Mech Eng 18: 215–226. https://doi.org/10.1016/j.acme.2017.06.011 doi: 10.1016/j.acme.2017.06.011
|
| [12] |
Sahin Y, Murphy S (1996) The effect of fibre orientation of the dry sliding wear of borsic-reinforced 2014 aluminium alloy. J Mater Sci 31: 5399–5407. https://doi.org/10.1007/bf01159309 doi: 10.1007/bf01159309
|
| [13] |
Mohanty P, Mahapatra R, Padhi P, et al. (2020) Ultrasonic cavitation: An approach to synthesize uniformly dispersed metal matrix nanocomposites—A review. Nano-Struct Nano-Objects 23: 100475. https://doi.org/10.1016/j.nanoso.2020.100475 doi: 10.1016/j.nanoso.2020.100475
|
| [14] |
Yehia HM, Elmetwally RAH, Elhabak AM, et al. (2023) Manufacturing of aluminum nano-composites reinforced with nano-copper and high graphene ratios using hot pressing technique. Materials 16: 7174. https://doi.org/10.3390/ma16227174 doi: 10.3390/ma16227174
|
| [15] |
Matli PR, Fareeha U, Shakoor RA, et al. (2017) A comparative study of structural and mechanical properties of Al–Cu composites prepared by vacuum and microwave sintering techniques. J Mater Res Technol 7: 165–172. https://doi.org/10.1016/j.jmrt.2017.10.003 doi: 10.1016/j.jmrt.2017.10.003
|
| [16] |
Wu D, Huang C, Wang Y, et al. (2019) Utilization of SiC and Cu particles to enhance thermal and mechanical properties of Al matrix composites. Materials 12: 2770. https://doi.org/10.3390/ma12172770 doi: 10.3390/ma12172770
|
| [17] |
Mahdi FM, Mahmood OH (2021) Effect of adding nano Ag on mechanical and physical properties of Cu–10% Fe prepared by powder metallurgy technique. Tikrit J Eng Sci 28: 13–20. http://dx.doi.org/10.25130/tjes.28.1.02 doi: 10.25130/tjes.28.1.02
|
| [18] |
Mahdi FM, Razooqi RN, Irhayyim SS (2017) The influence of the graphite content and milling time on the hardness, compressive strength and wear volume of copper–graphite composites prepared via powder metallurgy. Tikrit J Eng Sci 24: 38–44. https://doi.org/10.25130/tjes.24.3.07 doi: 10.25130/tjes.24.3.07
|
| [19] |
Humood HS (2017) Effect of pressing pressure on properties of copper-10% graphite composites prepared by powder metallurgy technique. Tikrit J Eng Sci 24: 28–34. https://doi.org/10.25130/tjes.24.2017.15 doi: 10.25130/tjes.24.2017.15
|
| [20] |
Kim K, Kim D, Park K, et al. (2019) Effect of intermetallic compounds on the thermal and mechanical properties of Al–Cu composite materials fabricated by spark plasma sintering. Materials 12: 1546. https://doi.org/10.3390/ma12091546 doi: 10.3390/ma12091546
|
| [21] |
Khamaj A, Farouk WM, Shewakh WM, et al. (2021) Effect of lattice structure evolution on the thermal and mechanical properties of Cu–Al2O3/GNPs nanocomposites. Ceram Int 47: 16511–16520. https://doi.org/10.1016/j.ceramint.2021.02.219 doi: 10.1016/j.ceramint.2021.02.219
|
Figures(9)

Omar Hassan Mahmood, Mustafa Sh. Aljanabi, Farouk M. Mahdi. Effect of Cu nanoparticles on microhardness and physical properties of aluminum matrix composite prepared by PM[J]. AIMS Materials Science, 2025, 12(2): 245-257. doi: 10.3934/matersci.2025013


 DownLoad: