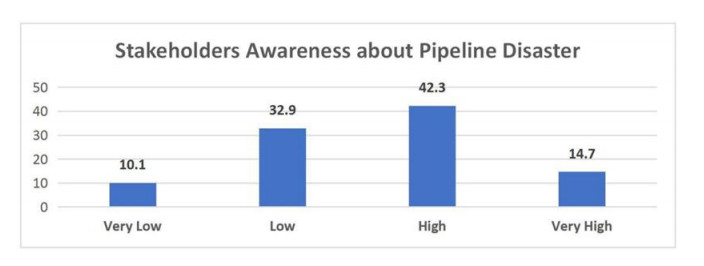
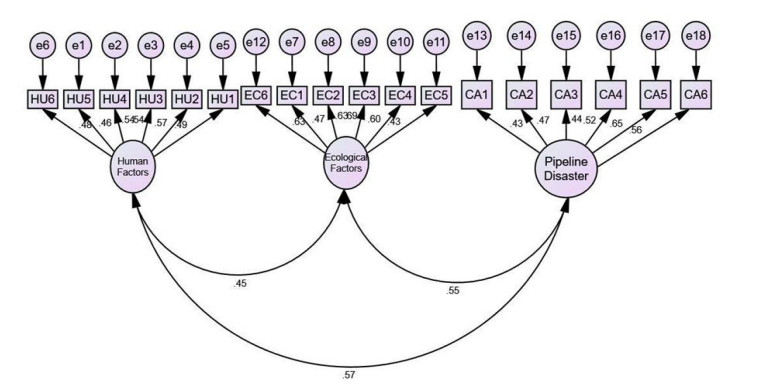
The effect of pipeline vandalism among other pipeline disasters has been drastic on the Nigerian economy. The research aims to examine the level of awareness of stakeholders on the immediate and remote causes of pipeline disasters in Nigeria. This involved comprehensive review of literature along with semi-structured and open-ended interviews (as a pilot study) to enrich and strengthen the literature in Nigerian context and subsequently follow-up with semi-structured questionnaire survey; analyzed through content analysis using both descriptive and inferential statistics. In the methodology, three levels were adopted: confirmatory factor analysis (CFA), measurement model and structural model in the carrying out of structural equation modelling (SEM) analysis. The CFA analyzes the relationship between the dominant's variables and their related indicators. Based on the analysis carried out, activities of vandals has the highest influence on pipeline disasters. Human impacts resulting from pipeline disasters are very significant in Nigeria. Also, ecological impacts resulting from pipeline disasters have been extremely significant in Nigeria. There is high level of awareness of pipeline disasters among the different stakeholders interviewed.
Citation: Francis I. Johnson, Richard Laing, Bassam Bjeirmi, Marianthi Leon. Examining the causes and impacts of pipeline disasters in Nigeria[J]. AIMS Environmental Science, 2022, 9(5): 636-657. doi: 10.3934/environsci.2022037
The effect of pipeline vandalism among other pipeline disasters has been drastic on the Nigerian economy. The research aims to examine the level of awareness of stakeholders on the immediate and remote causes of pipeline disasters in Nigeria. This involved comprehensive review of literature along with semi-structured and open-ended interviews (as a pilot study) to enrich and strengthen the literature in Nigerian context and subsequently follow-up with semi-structured questionnaire survey; analyzed through content analysis using both descriptive and inferential statistics. In the methodology, three levels were adopted: confirmatory factor analysis (CFA), measurement model and structural model in the carrying out of structural equation modelling (SEM) analysis. The CFA analyzes the relationship between the dominant's variables and their related indicators. Based on the analysis carried out, activities of vandals has the highest influence on pipeline disasters. Human impacts resulting from pipeline disasters are very significant in Nigeria. Also, ecological impacts resulting from pipeline disasters have been extremely significant in Nigeria. There is high level of awareness of pipeline disasters among the different stakeholders interviewed.

| [1] |
Johnson S, Robinson J, Thaicharoen Y (2004) Institutional causes, macroeconomic symptoms: Volatility, crises and growth. Journal of Monetary Economics 50: 49–123.. https//doi.org//10.1016/S0304-3932(02)00208-8 doi: 10.1016/S0304-3932(02)00208-8

|
| [2] |
Kishawy H, Gabbar H (2010) Review of Pipeline Integrity Management Practices. International Journal of Pressure Vessel and Process Piping 87: 378–380. https://doi.org/10.1016/j.ijpvp.2010.04.003 doi: 10.1016/j.ijpvp.2010.04.003
|
| [3] | Okoli A, Orinya S (2013) Oil Pipeline Vandalism and Nigeria's National Security. Global Journal of Human Social Science 13: 68–75. |
| [4] |
Omeje K (2005) Oil conflict in Nigeria: contending issues and perspectives of the local Niger Delta people. New Political Economy 10: 321–334. https://doi.org/10.1080/13563460500204183 doi: 10.1080/13563460500204183
|
| [5] |
Onuoha F (2009) Why the poor pay with their lives: Oil pipeline vandalisation, fires and human Security in Nigeria. Disaster 33: 369–389. https://doi.org/10.1111/j.1467-7717.2008.01079.x doi: 10.1111/j.1467-7717.2008.01079.x
|
| [6] | Collins N, Jürgen E (2012) Negative impacts of oil exploration on biodiversity management in the Niger De area of Nigeria. Impact Assessment and Project Appraisal 26: 139–147. |
| [7] | Asumi J (2009) Blood oil in the Niger Delta, United States Institute of Peace. |
| [8] |
Incardona JP, Collier TK, Scholz NK (2010) Oil spills and fish health: exposing the heart of the matter. J. Expo Sci Environ Epidemiol 21: 3–4. https://doi.org/10.1038/jes.2010.51 doi: 10.1038/jes.2010.51
|
| [9] | Wunder S (2005) Oil wealth and the fate of the forest: a comparative study of eight tropical countries, Taylor and Francis e-Library, London, United Kingdom, 432. |
| [10] |
Rajan SR (2002) Disaster, development and governance: reflections on the "Lessons of Bhopal". Environ Values 2002: 369–394. https://doi.org/10.3197/096327102129341136 doi: 10.3197/096327102129341136
|
| [11] |
Anifowose B, Damian M, Van der Horst D (2011) Attacks on oil transport pipelines in Nigeria: a quantitative exploration and possible explanation of observed patterns. Appl Geogr 32: 636–351. https://doi.org/10.1016/j.apgeog.2011.07.012 doi: 10.1016/j.apgeog.2011.07.012
|
| [12] |
Jukic A, Vidovic E, Janovic Z (2005) Alkyl methacrylate and styrene terpolymers as lubricating oil viscosity index improvers. Chemistry and Technology of Fuels and Oils 43: 386–394. https://doi.org/10.1007/s10553-007-0068-9 doi: 10.1007/s10553-007-0068-9
|
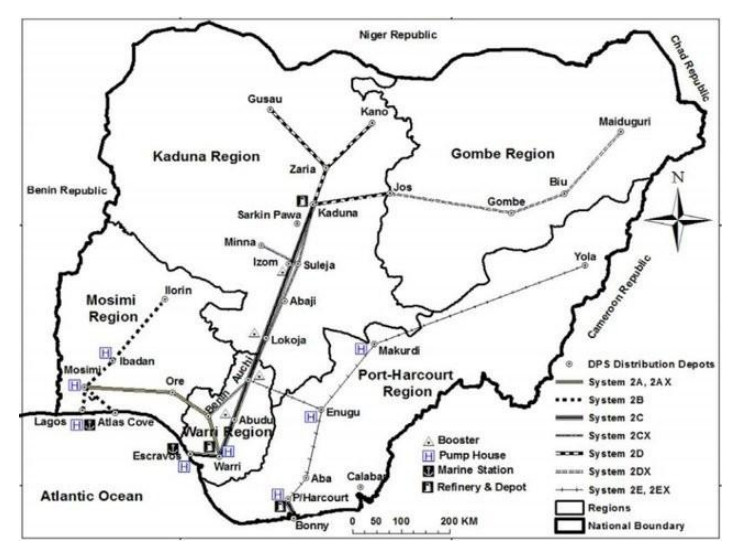
| [13] | ITA, Nigeria Pipelines map - Crude Oil (petroleum) pipelines - Natural Gas pipelines - Products pipelines, 2017. Available from : https://theodora.com/pipelines/nigeria_oil_gas_and_products_pipelines_map.html. |
| [14] | Lawal MO, Pipeline development in the Nigerian petroleum industry, 1989. Available from: http://www.jstor.org/stable/40571568. |
| [15] | Waldman J, How the Oil Pipeline Began, 2017. Available from: https://nautil.us/how-the-oil-pipeline-began-236686. |
| [16] |
Onuoha F (2007) Poverty, pipeline vandalism and explosion and Human Security: Integrating disaster management into poverty reduction in Nigeria. African security Review 16: 32–46. https://doi.org/10.1080/10246029.2007.9627420 doi: 10.1080/10246029.2007.9627420
|
| [17] | Johnson FI, and Marianthi L (2020) Identifying the immediate and remote causes of pipeline disasters in Nigeria. Global journal of science frontier research H: environment and earth sciences 20. https://doi.org/10.34257/GJSFRHVOL20IS3PG1 |
| [18] |
Nanninga N, Slifka A, Levy Y, et al. (2010) White. A Review of Fatigue Crack Growth for Pipeline Steels Exposed to Hydrogen. Journal of Research of the National Institute of Standards and Technology 115: 437. https://doi.org/10.6028/jres.115.030 doi: 10.6028/jres.115.030
|
| [19] | Hopkins P (2006) Oil and Gas Pipelines: Yesterday and Today. International Petroleum Technology Institute, American Society of Mechanical Engineers (ASME), New York, 1–9. |
| [20] | Pipeline Transport, In Wikipedia. The Free Encyclopedia, 2013. Available from http://en.wikipedia.org/w/index.php?title=Pipeline_transport&oldid=550407. |
| [21] | PHMSA, Pipeline Hazardous Materials Safety Administration, "Significant Incidents", 2020. Available from: https://www.phmsa.dot.gov/data-and-statistics/phmsa-data-and-statistics. |
| [22] | Okoli A (2013) The political ecology of the Niger Delta crisis and the prospects lasting peace in the Post-Amnesty Period. Global Journal of Human Social Science 3: 230. |
| [23] |
Nwilo PC, and Badejo OT. (2005) Oil spill problems and management in the Niger Delta. In International oil spill conference 2005: 567–570. https://doi.org/10.7901/2169-3358-2005-1-567 doi: 10.7901/2169-3358-2005-1-567
|
| [24] | James H (2014) Shell is losing more oil sabotage and theft in Niger Delta is causing big jumps in spills. Dow Jones and Company Incorporation: The Wall Street Journal. |
| [25] | Oil and Gas Journal, Nigerian Pipeline Explosions Kills 250, 2012. Available from: https://www.ogj.com/pipelines-transportation/pipelines/article/17254114/nigerian-pipeline-explosion-kills-250. |
| [26] | Aroh KN, Ubong IU, Eze CL, et al. (2010) Oil spill incidents and pipeline vandalization in Nigeria: impact on public health and negation to attainment of Millennium Development Goal: the Ishiagu example. Disaster prevention and management: An international Journal. https://doi.org/10.1108/09653561011022153 |
| [27] | Ntukekpo DS (1996) Spillage: Bane of petroleum, ultimate water technology & environment. Environmental Research Journal 6: 100–105. |
| [28] | Kagan CR, Evans K, Knowles J, et al. (2002) Working with people who are marginalized by the social system: Challenges for community psychological work. In Psicología Comunitaria Europea: Comunidad, Poder, Éticay Valores/European Community Psychology: Community, Power, Ethics and Values 2002: 400–412. |
| [29] |
Tajfel H, Turner JC (1982) Social psychology of intergroup relations. Annual Review of Psychology 33: 1–39. https//doi.org/10.1146/annurev.ps.33.020182.000245 doi: 10.1146/annurev.ps.33.020182.000245
|
| [30] |
Altindag DT (2012) Crime and unemployment: Evidence from Europe. International review of Law and Economics 32: 145–157. https://doi.org/10.1016/j.irle.2011.10.003 doi: 10.1016/j.irle.2011.10.003
|
| [31] |
Aroh KN, Ubong IU, Eze CL, et al. (2010) Oil spill incidents and pipeline vandalization in Nigeria: impact on public health and negation to attainment of Millennium Development Goal: the Ishiagu example. Disaster prevention and management: An international Journal 2010. https://doi.org/10.1108/09653561011022153 doi: 10.1108/09653561011022153
|
| [32] |
Taber KS (2018) The use of Cronbach's alpha when developing and reporting research instruments in science education. Research in science education 48: 1273–1296. https://doi.org/10.1007/s11165-016-9602-2 doi: 10.1007/s11165-016-9602-2
|
| [33] |
Islam MA, Khan MA, Obaidullah AZM, et al. (2011) Effect of entrepreneur and firm characteristics on the business success of small and medium enterprises (SMEs) in Bangladesh. International Journal of Business and Management 6: 289. https://doi.org/10.5539/ijbm.v6n3p289 doi: 10.5539/ijbm.v6n3p289
|
| [34] |
DeCarlo LT (1997) On the meaning and use of kurtosis. Psychological methods 2: 292. https://doi.org/10.1037/1082-989X.2.3.292 doi: 10.1037/1082-989X.2.3.292
|
| [35] | Kline RB (2011) Principles and Practice for Structural Equation Modelling (3rd Eds). |
| [36] | Hoyle RH (1995) Structural equation modeling: Concepts, issues, and applications. Sage. |
| [37] | Ho R (2006) Handbook of univariate and multivariate data analysis and interpretation with SPSS. New York, Chapman and Hall/CRC, 424. https://doi.org/10.1201/9781420011111 |
| [38] |
Omodanisi EO, Eludoyin AO, Salami AT (2014) A multi-perspective view of the effects of a pipeline explosion in Nigeria. International Journal of Disaster Risk Reduction 7: 68–77. https://doi.org/10.1016/j.ijdrr.2013.11.002 doi: 10.1016/j.ijdrr.2013.11.002
|
Figures(5) / Tables(7)

Francis I. Johnson, Richard Laing, Bassam Bjeirmi, Marianthi Leon. Examining the causes and impacts of pipeline disasters in Nigeria[J]. AIMS Environmental Science, 2022, 9(5): 636-657. doi: 10.3934/environsci.2022037


 DownLoad: