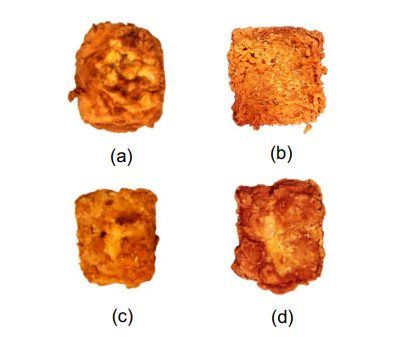
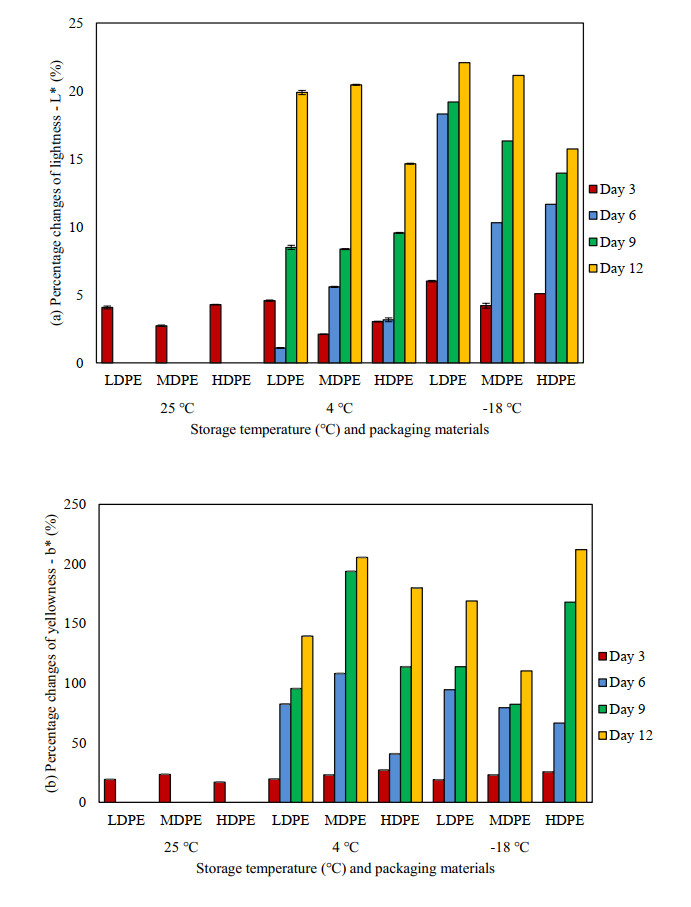
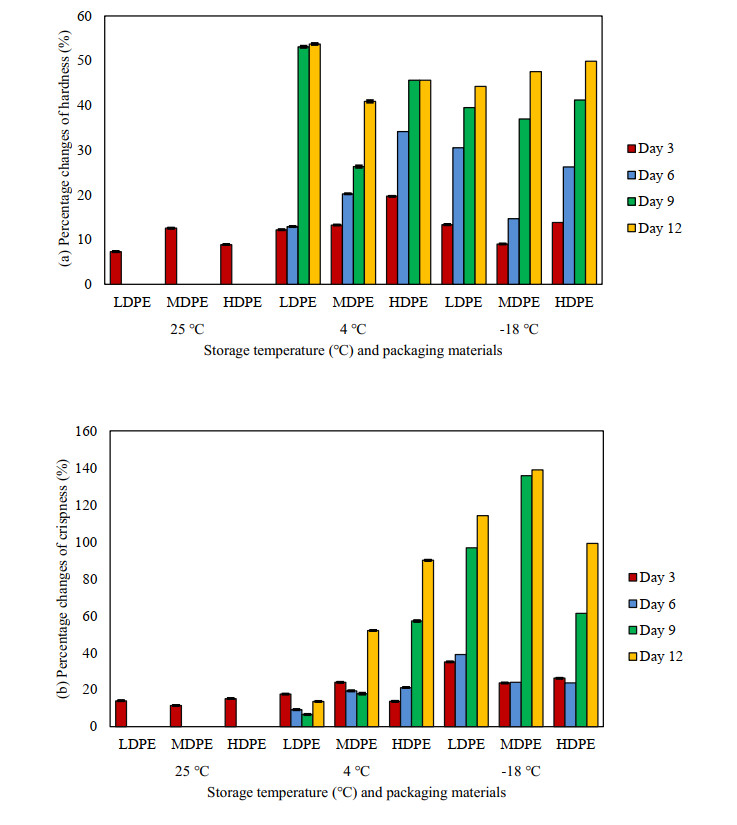
This study formulated the batter systems for crispy chicken burger patties using wheat flour-based batter and rice flour-based batter with the ratios of 2:2:1:1 and 2:1:2:1 (wheat flour/rice flour: corn flour: crispy flour: spicy flour). The crispy chicken burger patties were evaluated in terms of proximate compositions (moisture, ash, fat, protein, and carbohydrate contents) and sensory analysis. Crispy chicken burger patties made from rice flour-based batter with a formula ratio of 2:2:1:1 (RFBB1) were found to exhibit the lowest moisture and fat compositions but the highest protein composition. The sensory properties were evaluated using the 9-point hedonic scaling method in terms of overall acceptability, appearance, taste, crispness, juiciness, and color, which revealed that RFBB1 exhibited the best acceptability scores for all attributes. Then, the storage qualities of crispy chicken patties packed using different types of packaging materials (low-density polyethylene (LDPE), medium-density polyethylene, and high-density polyethylene) and stored at different temperatures (−18, 4, and 25 ℃) for 12 days were investigated in terms of color and texture. Regardless of the types of packaging materials and storage temperature, the hardness of crispy chicken burger patties decreased over time but crispness increased due to the reduction in moisture content. In terms of hardness and crispness, the RFBB1 was best packed in LDPE packaging material and stored at either cold or frozen temperatures.
Citation: Siti Hajar Othman, Nazirah Mohd Rosli, Norhazirah Nordin, Masturina Abdul Aziz. Formulation of crispy chicken burger patty batter: Properties and storage qualities[J]. AIMS Agriculture and Food, 2022, 7(2): 426-443. doi: 10.3934/agrfood.2022027
This study formulated the batter systems for crispy chicken burger patties using wheat flour-based batter and rice flour-based batter with the ratios of 2:2:1:1 and 2:1:2:1 (wheat flour/rice flour: corn flour: crispy flour: spicy flour). The crispy chicken burger patties were evaluated in terms of proximate compositions (moisture, ash, fat, protein, and carbohydrate contents) and sensory analysis. Crispy chicken burger patties made from rice flour-based batter with a formula ratio of 2:2:1:1 (RFBB1) were found to exhibit the lowest moisture and fat compositions but the highest protein composition. The sensory properties were evaluated using the 9-point hedonic scaling method in terms of overall acceptability, appearance, taste, crispness, juiciness, and color, which revealed that RFBB1 exhibited the best acceptability scores for all attributes. Then, the storage qualities of crispy chicken patties packed using different types of packaging materials (low-density polyethylene (LDPE), medium-density polyethylene, and high-density polyethylene) and stored at different temperatures (−18, 4, and 25 ℃) for 12 days were investigated in terms of color and texture. Regardless of the types of packaging materials and storage temperature, the hardness of crispy chicken burger patties decreased over time but crispness increased due to the reduction in moisture content. In terms of hardness and crispness, the RFBB1 was best packed in LDPE packaging material and stored at either cold or frozen temperatures.

| [1] |
Rozzamri A, Atiqah-Izyannie AM, Mat Yusoff M, et al. (2020) Effects of leavening agents in batter system on quality of deep-fried chicken breast meat. Food Res 4: 327-334. https://doi.org/10.26656/fr.2017.4(2).273 doi: 10.26656/fr.2017.4(2).273

|
| [2] |
Albert A, Salvador A, Hough G, et al. (2014) Influence of outer layer formulation on the sensory properties of microwaved breaded nuggets. Int J Food Prop 17: 829-841. https://doi.org/10.1080/10942912.2011.604892 doi: 10.1080/10942912.2011.604892
|
| [3] |
Mukprasirt A, Herald TJ, Boyle DL, et al. (2001) Physicochemical and microbiological properties of selected rice flour-based batters for fried chicken drumsticks. Poult Sci 80: 988-996. https://doi.org/10.1093/ps/80.7.988 doi: 10.1093/ps/80.7.988
|
| [4] |
Luo S, Yan X, Fu Y, et al. (2021) The quality of gluten-free bread made of brown rice flour prepared by low temperature impact mill. Food Chem 348: 129032. https://doi.org/10.1016/j.foodchem.2021.129032 doi: 10.1016/j.foodchem.2021.129032
|
| [5] |
Rahimi J, Ngadi MO (2014) Effect of batter formulation and pre-drying time on oil distribution fractions in fried batter. LWT-Food Sci Technol 59: 820-826. https://doi.org/10.1016/j.lwt.2014.05.038 doi: 10.1016/j.lwt.2014.05.038
|
| [6] |
Jackson V, Schilling MW, Coggins PC, et al. (2006) Utilization of rice starch in the formulation of low-fat, wheat-free chicken nuggets. J Appl Poult Res 15: 417-424. https://doi.org/10.1093/JAPR/15.3.417 doi: 10.1093/JAPR/15.3.417
|
| [7] |
Al-Kuraieef AN, Alshawi AH, Alsuhaibani A (2019) Quality characteristics of beef patties fortified with husk tomato and the effect on tannic acid-induced anaemia in rats. J Food Qual 2019: 3930908. https://doi.org/10.1155/2019/3930908 doi: 10.1155/2019/3930908
|
| [8] | Parafati L, Palmeri R, Trippa D, et al. (2019) Quality maintenance of beef burger patties by direct addiction or encapsulation of a prickly pear fruit extract. Front Microbiol 10: 1760. https://dx.doi.org/10.3389%2Ffmicb.2019.01760 |
| [9] |
Taylor J, Ahmed IAM, Al-Juhaimi FY, et al. (2020) Consumers' perceptions and sensory properties of beef patty analogues. Foods 9: 63. https://doi.org/10.3390/foods9010063 doi: 10.3390/foods9010063
|
| [10] |
Banovic M, Grunert KG, Barreira MM, et al. (2009) Beef quality perception at the point of purchase: A study from Portugal. Food Qual Prefer 20: 335-342. https://doi.org/10.1016/j.foodqual.2009.02.009 doi: 10.1016/j.foodqual.2009.02.009
|
| [11] |
Grunert KG, Bredahl L, Brunsø K (2004) Consumer perception of meat quality and implications for product development in the meat sector-a review. Meat Sci 66: 259-272. https://doi.org/10.1016/S0309-1740(03)00130-X doi: 10.1016/S0309-1740(03)00130-X
|
| [12] | Ashish R, Jha P, Shah P (2020) The role of food packaging. In: Himanshu MM, Goswami B (Eds.), Global Challenges and Innovation in Science and Management, Delhi: KAAV Publications, 158-167. |
| [13] | Galanakis CM (2019) Food packaging and migration. In: Cruz RMS, Rico BPM, Vieira MC (Eds.), Food Quality and Shelf Life, Massachusetts: Academic Press, 281-301. https://doi.org/10.1016/B978-0-12-817190-5.00009-4 |
| [14] | Association of Official Analytical Chemists (AOAC) (2016) Official methods of analysis of AOAC international (G. W. Latimer (ed.); 20th ed.), Rockville: AOAC International. |
| [15] | Lawless HT, Heymann H (2013) Sensory evaluation of food: Principles and practices, New York: Springer. |
| [16] | Saklar S, Ungan S, Katnas S (1999) Instrumental crispness and crunchiness of roasted hazelnuts and correlations with sensory assessment. J Food Sci 64: 1015-1019. |
| [17] |
Kim H, Kim K, Lee J, et al. (2015) Quality evaluation of chicken nugget formulated with various contents of chicken skin and wheat fiber mixture. Korean J Food Sci Anim Resour 35: 19-26. https://doi.org/10.5851/kosfa.2015.35.1.19 doi: 10.5851/kosfa.2015.35.1.19
|
| [18] |
Adedeji AA, Ngadi MO (2011). Microstructural properties of deep-fat fried chicken nuggets coated with different batter formulation. Int J Food Prop 14: 68-83. https://doi.org/10.1080/10942910903131423 doi: 10.1080/10942910903131423
|
| [19] |
Gujral HS, Sharma B, Khatri M (2018) Influence of replacing wheat bran with barley bran on dough rheology, digestibility and retrogradation behavior of chapatti. Food Chem 240: 1154-1160. https://doi.org/10.1016/j.foodchem.2017.08.042 doi: 10.1016/j.foodchem.2017.08.042
|
| [20] |
Shih F, Daigle K (1999) Oil uptake properties of fried batters from rice flour. J Agric Food Chem 47: 1611-1615. https://doi.org/10.1093/japr/15.3.417 doi: 10.1093/japr/15.3.417
|
| [21] | Bamforth CW, Ward RE (2014) The Oxford handbook of food fermentations, New York: Oxford University Press. |
| [22] |
Tortoe C, Akonor PT, Nketia S, et al. (2014) Evaluation of the sensory characteristics and consumer acceptability of deep-fried yam (Dioscorearotundata) crisps in the Accra Metropolitan area. J Food Nutr Sci 2: 19. https://doi.org/10.11648/j.jfns.20140201.13 doi: 10.11648/j.jfns.20140201.13
|
| [23] |
Banerjee DK, Devadason IP, Mendiratta SK, et al. (2019) Physico-chemical, sensory andlations microbiological quality characteristics of tray packaged chicken nuggets wrapped with different films and stored at frozen condition. Int J Curr Microbiol Appl Sci 8: 793-808. https://doi.org/10.20546/ijcmas.2019.807.096 doi: 10.20546/ijcmas.2019.807.096
|
| [24] |
Ibadullah WZW, Idris AA, Shukri R, et al. (2019) Stability of fried fish crackers as influenced by packaging material and storage temperatures. Curr Res Nutr Food Sci 7: 369-381. https://doi.org/10.12944/CRNFSJ.7.2.07 doi: 10.12944/CRNFSJ.7.2.07
|
| [25] | Rawat S (2015) Food Spoilage: Microorganisms and their prevention. Asian J Plant Sci Res 5: 47-56. |
| [26] | Keller PE, Kouzes R (2017) Water Vapor Permeation in Plastics. U.S. Department of Energy Office of Scientific and Technical Information. Available from: https://www.osti.gov/biblio/1411940. |
| [27] |
Adrah K, Ananey-Obiri D, Tahergorabi R (2021) Physicochemical changes of deep-fat-fried chicken drumsticks treated with quercetin-in-edible coating during storage time. Foods 10: 1-11. https://doi.org/10.3390/foods10020467 doi: 10.3390/foods10020467
|
| [28] |
Grillo O, Rizzo V, Saccone R, et al. (2014) Use of image analysis to evaluate the shelf life of bakery products. Food Res Int 62: 514-522. https://doi.org/10.1016/j.foodres.2014.03.034 doi: 10.1016/j.foodres.2014.03.034
|
| [29] | Feiner G (2006) Definitions of terms used in meat science and technology. In: Meat Products Handbook, Practical Science and Technology, Cambridge: Woodhead Publishing Series in Food Science, Technology and Nutrition, 46-71. https://doi.org/10.1533/9781845691721.1.46 |
| [30] |
Lund MN, Ray CA (2017) Control of Maillard reactions in foods: Strategies and chemical mechanisms. J Agric Food Chem 65: 4537-4552. https://doi.org/10.1021/acs.jafc.7b00882 doi: 10.1021/acs.jafc.7b00882
|
| [31] |
Amit SK, Uddin MM, Rahman R, et al. (2017) A review on mechanisms and commercial aspects of food preservation and processing. Agric Food Secur 6: 1-22. https://doi.org/10.1186/s40066-017-0130-8 doi: 10.1186/s40066-017-0130-8
|
Figures(3) / Tables(5)

Siti Hajar Othman, Nazirah Mohd Rosli, Norhazirah Nordin, Masturina Abdul Aziz. Formulation of crispy chicken burger patty batter: Properties and storage qualities[J]. AIMS Agriculture and Food, 2022, 7(2): 426-443. doi: 10.3934/agrfood.2022027


 DownLoad: