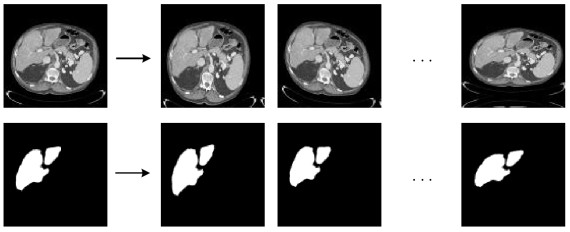
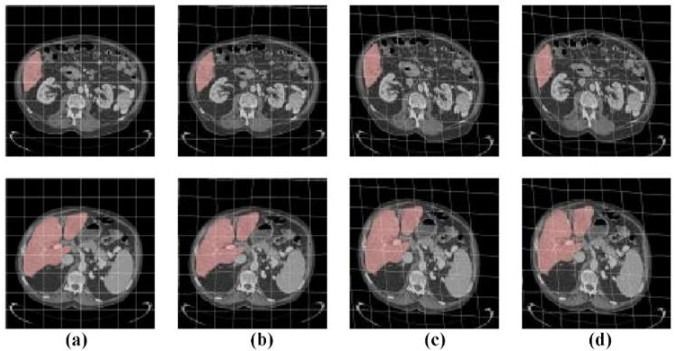
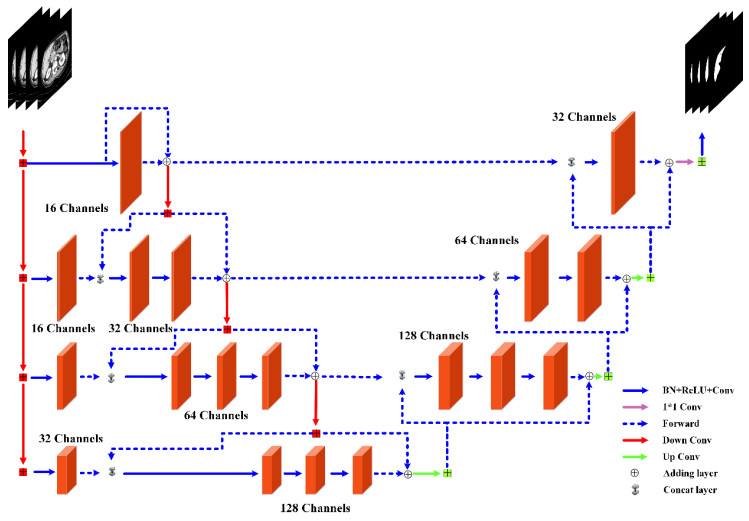
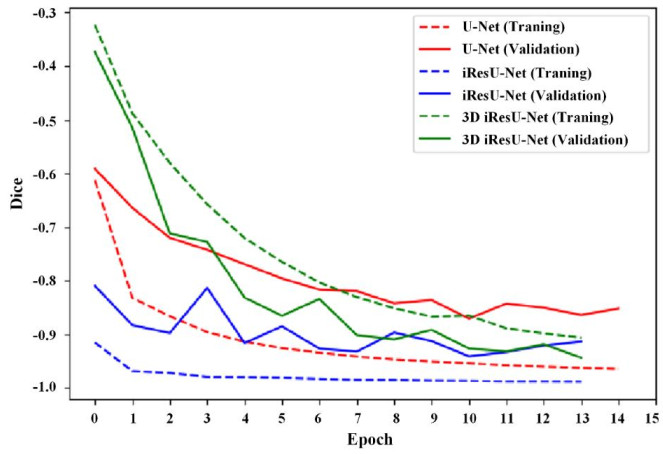
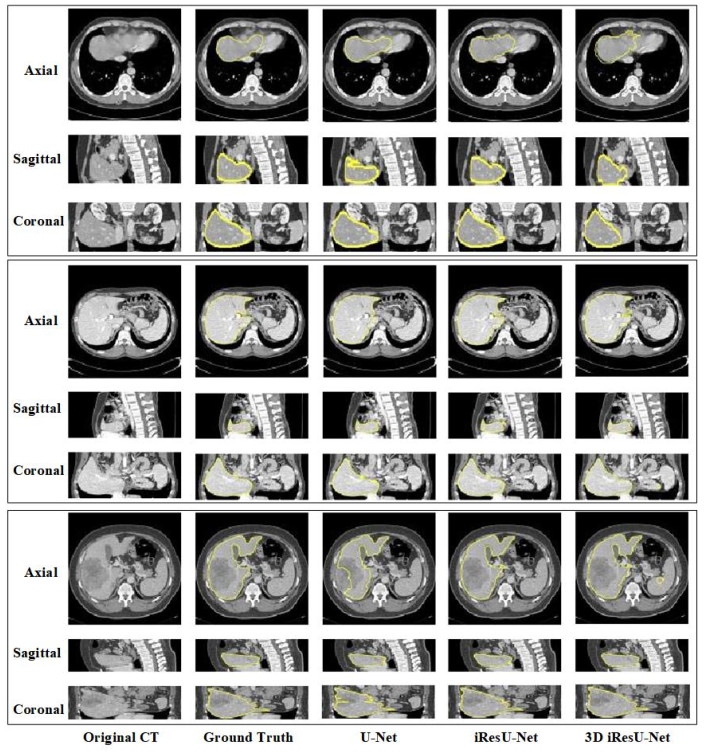
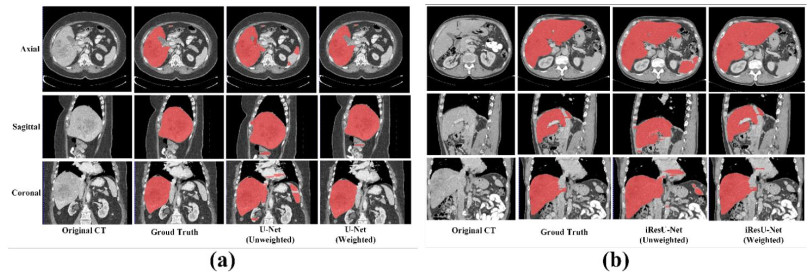
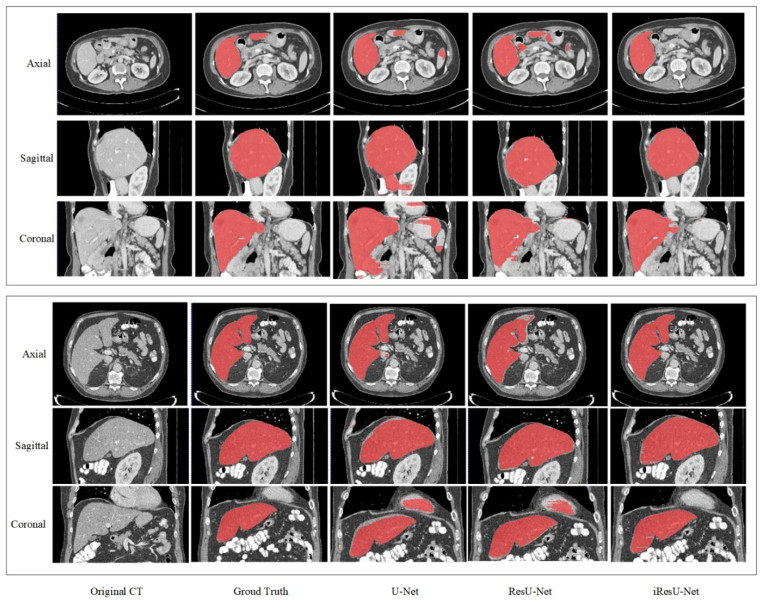
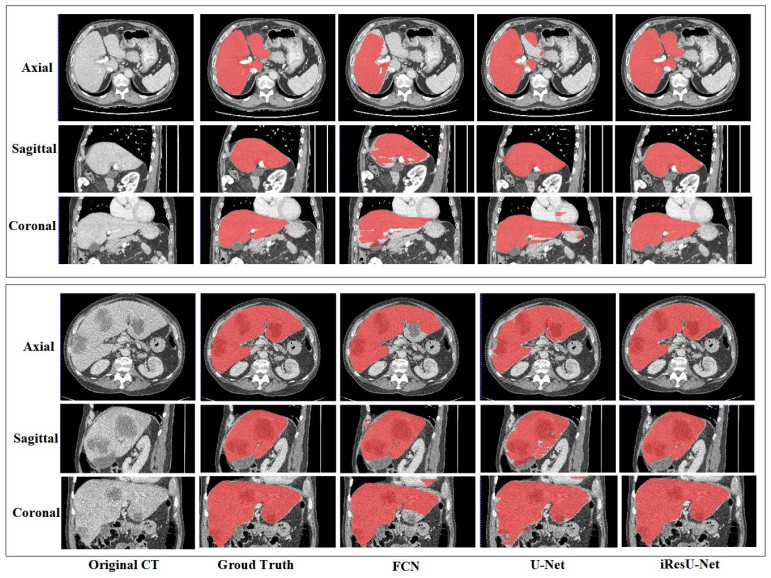
This paper proposes an improved ResU-Net framework for automatic liver CT segmentation. By employing a new loss function and data augmentation strategy, the accuracy of liver segmentation is improved, and the performance is verified on two public datasets LiTS17 and SLiver07. Firstly, to speed up the convergence of the model, the residual module is used to replace the original convolution module of U-Net. Secondly, to suppress the problem of pixel imbalance, the opposite number of Dice is proposed to replace the cross-entropy loss function, and the morphological method is introduced to weigh the pixels. Finally, to improve the generalization ability of the model, random affine transformation and random elastic deformation are employed for data augmentation. From 20 training datasets of Sliver07, 16 sets were selected as the training set, two sets were used for verification, and two sets were used for the test; meanwhile, from 131 training datasets of LiTS2017, eight sets were selected as the test set. In the experiment, four evaluation metrics, including DICE global, DICE per case, VOE, and RVD, were calculated, with the accuracies of 94.28, 94.24 ± 2.07, 10.83 ± 3.70, and -0.25 ± 2.74, respectively. Compared with U-Net and ResU-Net, the performance of the proposed method is significantly improved. The experimental results show that, although the method's complexity is high, it has a faster convergence speed and stronger generalization ability. The segmentation effect on the 2D image is significantly improved, and the scalability on 3D data is also robust. In addition, the proposed method performs well in the case of low-contrast neighboring organs, which proves the robustness of the proposed method.
Citation: Peiqing Lv, Jinke Wang, Xiangyang Zhang, Chunlei Ji, Lubiao Zhou, Haiying Wang. An improved residual U-Net with morphological-based loss function for automatic liver segmentation in computed tomography[J]. Mathematical Biosciences and Engineering, 2022, 19(2): 1426-1447. doi: 10.3934/mbe.2022066
This paper proposes an improved ResU-Net framework for automatic liver CT segmentation. By employing a new loss function and data augmentation strategy, the accuracy of liver segmentation is improved, and the performance is verified on two public datasets LiTS17 and SLiver07. Firstly, to speed up the convergence of the model, the residual module is used to replace the original convolution module of U-Net. Secondly, to suppress the problem of pixel imbalance, the opposite number of Dice is proposed to replace the cross-entropy loss function, and the morphological method is introduced to weigh the pixels. Finally, to improve the generalization ability of the model, random affine transformation and random elastic deformation are employed for data augmentation. From 20 training datasets of Sliver07, 16 sets were selected as the training set, two sets were used for verification, and two sets were used for the test; meanwhile, from 131 training datasets of LiTS2017, eight sets were selected as the test set. In the experiment, four evaluation metrics, including DICE global, DICE per case, VOE, and RVD, were calculated, with the accuracies of 94.28, 94.24 ± 2.07, 10.83 ± 3.70, and -0.25 ± 2.74, respectively. Compared with U-Net and ResU-Net, the performance of the proposed method is significantly improved. The experimental results show that, although the method's complexity is high, it has a faster convergence speed and stronger generalization ability. The segmentation effect on the 2D image is significantly improved, and the scalability on 3D data is also robust. In addition, the proposed method performs well in the case of low-contrast neighboring organs, which proves the robustness of the proposed method.

| [1] |
A. Das, S. K. Sabut, Kernelized fuzzy c-means clustering with adaptive thresholding for segmenting liver tumors, Procedia Comput. Sci., 92 (2016), 389-395. doi: 10.1016/j.procs.2016.07.395. doi: 10.1016/j.procs.2016.07.395

|
| [2] | E. Göçeri, A comparative evaluation for liver segmentation from SPIR images and a novel level set method using signed pressure force function, Ph.D thesis, İzmir Institute of Technology, 2013. |
| [3] | E. Goceri, M. Z. Unlu, C. Guzelis, O. Dicle, An automatic level set based liver segmentation from MRI data sets, in 2012 3rd International conference on image processing theory, tools and applications (IPTA), (2012), 192-197. doi: 10.1109/IPTA.2012.6469551. |
| [4] |
E. Dura, J. Domingo, E. Göçeri, L. M. Bonmati, A method for liver segmentation in perfusion MR images using probabilistic atlases and viscous reconstruction, Pattern Anal. Appl., 21 (2018), 1083-1095. doi: 10.1007/s10044-017-0666-z. doi: 10.1007/s10044-017-0666-z
|
| [5] |
E. Dura, J. Domingo, G. Ayala, L. M. Bonmati, E. Goceri, Probabilistic liver atlas construction, Biomed. Eng. Online, 15 (2017), 1-25. doi: 10.1186/s12938-016-0305-8. doi: 10.1186/s12938-016-0305-8
|
| [6] |
S. Zhou, J. Wang, S. Zhang, Y. Liang, Y. Gong, Active contour model based on local and global intensity information for medical image segmentation, Neurocomputing, 186 (2016), 107-118. doi: 10.1016/j.neucom.2015.12.073. doi: 10.1016/j.neucom.2015.12.073
|
| [7] | J. Domingo, E. Dura, E. Göçeri, Iteratively learning a liver segmentation using probabilistic atlases: preliminary results, in 2016 15th IEEE International Conference on Machine Learning and Applications (ICMLA), (2016), 593-598. doi: 10.1109/ICMLA.2016.0104. |
| [8] |
E. Göçeri, M. Z. Ünlü, O. Dicle, A comparative performance evaluation of various approaches for liver segmentation from SPIR images, Turk. J. Electr. Eng. Comput. Sci., 23 (2015). 741-768. doi: 10.3906/elk-1304-36. doi: 10.3906/elk-1304-36
|
| [9] |
J. Tang, A multi-direction GVF snake for the segmentation of skin cancer images. Pattern Recognit., 42 (2009), 1172-1179. doi: 10.1016/j.patcog.2008.09.007. doi: 10.1016/j.patcog.2008.09.007
|
| [10] | Z. Tu, Probabilistic boosting-tree: Learning discriminative models for classification, recognition, and clustering, in Tenth IEEE International Conference on Computer Vision (ICCV'05), 1 (2005), 1589-1596. doi: 10.1109/ICCV.2005.194. |
| [11] |
X. Ying, T. M. Monticello, Modern imaging technologies in toxicologic pathology: An overview, Toxicol. Pathol., 34 (2006), 815-26. doi: 10.1080/01926230600918983. doi: 10.1080/01926230600918983
|
| [12] | E. Göçeri, Impact of deep learning and smartphone technologies in dermatology: Automated diagnosis, in 2020 Tenth International Conference on Image Processing Theory, Tools and Applications (IPTA), (2020), 1-6. doi: 10.1080/01926230600918983. |
| [13] |
E. Goceri, Capsnet topology to classify tumours from brain images and comparative evaluation, IET Image Process., 14 (2020), 882-889. doi: 10.1049/iet-ipr.2019.0312. doi: 10.1049/iet-ipr.2019.0312
|
| [14] | T. Ojala, M. Pietikainen, D. Harwood, Performance evaluation of texture measures with classification based on Kullback discrimination of distributions, in Proceedings of 12th international conference on pattern recognition, 1 (1994), 582-585. doi: 10.1109/ICPR.1994.576366. |
| [15] | J. Long, E. Shelhamer, T. Darrell, Fully convolutional networks for semantic segmentation, in Proceedings of the IEEE conference on computer vision and pattern recognition (CVPR), (2015), 3431-3440. doi: 10.1109/CVPR.2015.7298965. |
| [16] | O. Ronneberger, P. Fischer, T. Brox, U-Net: convolutional networks for biomedical image segmentation, in International Conference on Medical Image Computing and Computer-Assisted Intervention, Springer, Cham, 9351 (2015), 234-241. doi: 10.1007/978-3-319-24574-4_28. |
| [17] | A. Ben-Cohen, I. Diamant, E. Klang, M. Amitai, H. Greenspan, Fully convolutional network for liver segmentation and lesions detection, in Deep Learning and Data Labeling for Medical Applications, Springer, Cham, 10008 (2016), 77-85. doi: 10.1007/978-3-319-46976-8_9. |
| [18] | Ö. Çiçek, A. Abdulkadir, S. S. Lienkamp, T. Brox, O. Ronneberger, 3D U-Net: learning dense volumetric segmentation from sparse annotation, in International conference on medical image computing and computer-assisted intervention, Springer, Cham, 9901 (2016), 424-432. doi: 10.1007/978-3-319-46723-8_49. |
| [19] | Q. Dou, H. Chen, Y. Jin, L. Yu, J. Qin, P. A. Heng, 3D deeply supervised network for automatic liver segmentation from CT volumes, in International conference on medical image computing and computer-assisted intervention. Springer, Cham, 9901 (2016), 149-157. doi: 10.1007/978-3-319-46723-8_18. |
| [20] |
C. Zhao, Y. Xu, H Zhou, J. Tang, Y. Zhang, J. Han, et al., Lung Segmentation and Automatic detection of COVID-19 using radiomic features from chest CT images, Pattern Recognit., 119 (2021), 108071. doi: 10.1016/j.patcog.2021.108071. doi: 10.1016/j.patcog.2021.108071
|
| [21] |
C. Zhao, A. Vij, S. Malhotra, J. Tang, H. Tang, D. Pienta, et al., Automatic extraction and stenosis evaluation of coronary arteries in invasive coronary angiograms, Comput. Biol. and Med., 136 (2021), 104667. doi: 10.1016/j.compbiomed.2021.104667. doi: 10.1016/j.compbiomed.2021.104667
|
| [22] | A. Hoogi, A. Subramaniam, R. Veerapaneni, D. L. Rubin, Adaptive estimation of active contour parameters using convolutional neural networks and texture analysis, in IEEE Transactions on Medical Imaging, 36 (2017), 781-791. doi: 10.1109/TMI.2016.2628084. |
| [23] |
P. Hu, F. Wu, J. Peng, P. Liang, D. Kong, Automatic 3D liver segmentation based on deep learning and globally optimized surface evolution, Phys. Med. Biol., 61 (2016), 8676-8698. doi: 10.1088/1361-6560/61/24/8676. doi: 10.1088/1361-6560/61/24/8676
|
| [24] |
F. Lu, F. Wu, P. Hu, Z. Peng, D. Kong, Automatic 3D liver location and segmentation via convolutional neural network and graph cut, Int. J. CARS, 12 (2017), 171-182. doi: 10.1007/s11548-016-1467-3. doi: 10.1007/s11548-016-1467-3
|
| [25] | C. Szegedy, V. Vanhoucke, S. Ioffe, J. Shlens, Z. Wojna, Rethinking the inception architecture for computer vision, in 2016 IEEE Conference on Computer Vision and Pattern Recognition (CVPR), (2016), 2818-2826. doi: 10.1109/CVPR.2016.308. |
| [26] | K. He, X. Zhang, S. Ren, J. Sun, Deep residual learning for image recognition, in Proceedings of the IEEE Conference on Computer Vision and Pattern Recognition (CVPR), (2016), 770-778. |
| [27] | F. Milletari, N. Navab, S. A. Ahmadi, V-Net: Fully Convolutional Neural Networks for Volumetric Medical Image Segmentation, in 2016 Fourth International Conference on 3D Vision (3DV), (2016), 565-571. doi: 10.1109/3DV.2016.79. |
| [28] |
Q. Jin, Z. Meng, C. Sun, H. Cui, R. Su, RA-UNet: A hybrid deep attention-aware network to extract liver and tumor in CT scans, Front. Bioeng. Biotechnol., 2020. doi: 10.3389/fbioe.2020.605132. doi: 10.3389/fbioe.2020.605132
|
| [29] | P. F. Christ, M. E. A. Elshaer, F. Ettlinger, S. Tatavarty, M. Bickel, P. Bilic, et al., Automatic liver and lesion segmentation in CT using cascaded fully convolutional neural networks and 3D conditional random fields, in International Conference on Medical Image Computing and Computer-Assisted Intervention. Springer, Cham, 9901 (2016), 415-423. doi: 10.1007/978-3-319-46723-8_48. |
| [30] | S. S. M. Salehi, D. Erdogmus, A. Gholipour, Tversky loss function for image egmentation using 3D fully convolutional deep network, in International Workshop on Machine Learning in Medical Imaging, Switzerland, Springer, (2017), 379-387. doi: 10.1007/978-3-319-67389-9_44. |
| [31] |
E. Goceri, Diagnosis of skin diseases in the era of deep learning and mobile technology, Comput. Biol. Med., 134 (2021), 104458. doi: 10.1016/j.compbiomed.2021.104458. doi: 10.1016/j.compbiomed.2021.104458
|
| [32] |
E. Goceri, Deep learning based classification of facial dermatological disorders, Comput. Biol. Med., 128 (2021), 104118. doi: 10.1016/j.compbiomed.2020.104118. doi: 10.1016/j.compbiomed.2020.104118
|
Figures(12) / Tables(5)

Peiqing Lv, Jinke Wang, Xiangyang Zhang, Chunlei Ji, Lubiao Zhou, Haiying Wang. An improved residual U-Net with morphological-based loss function for automatic liver segmentation in computed tomography[J]. Mathematical Biosciences and Engineering, 2022, 19(2): 1426-1447. doi: 10.3934/mbe.2022066


 DownLoad: