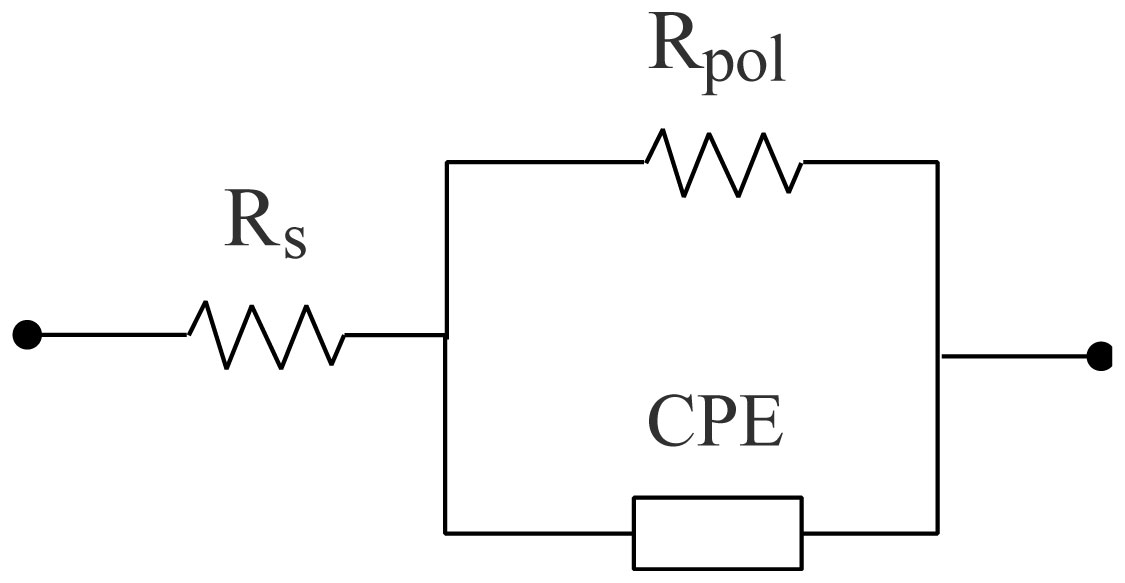
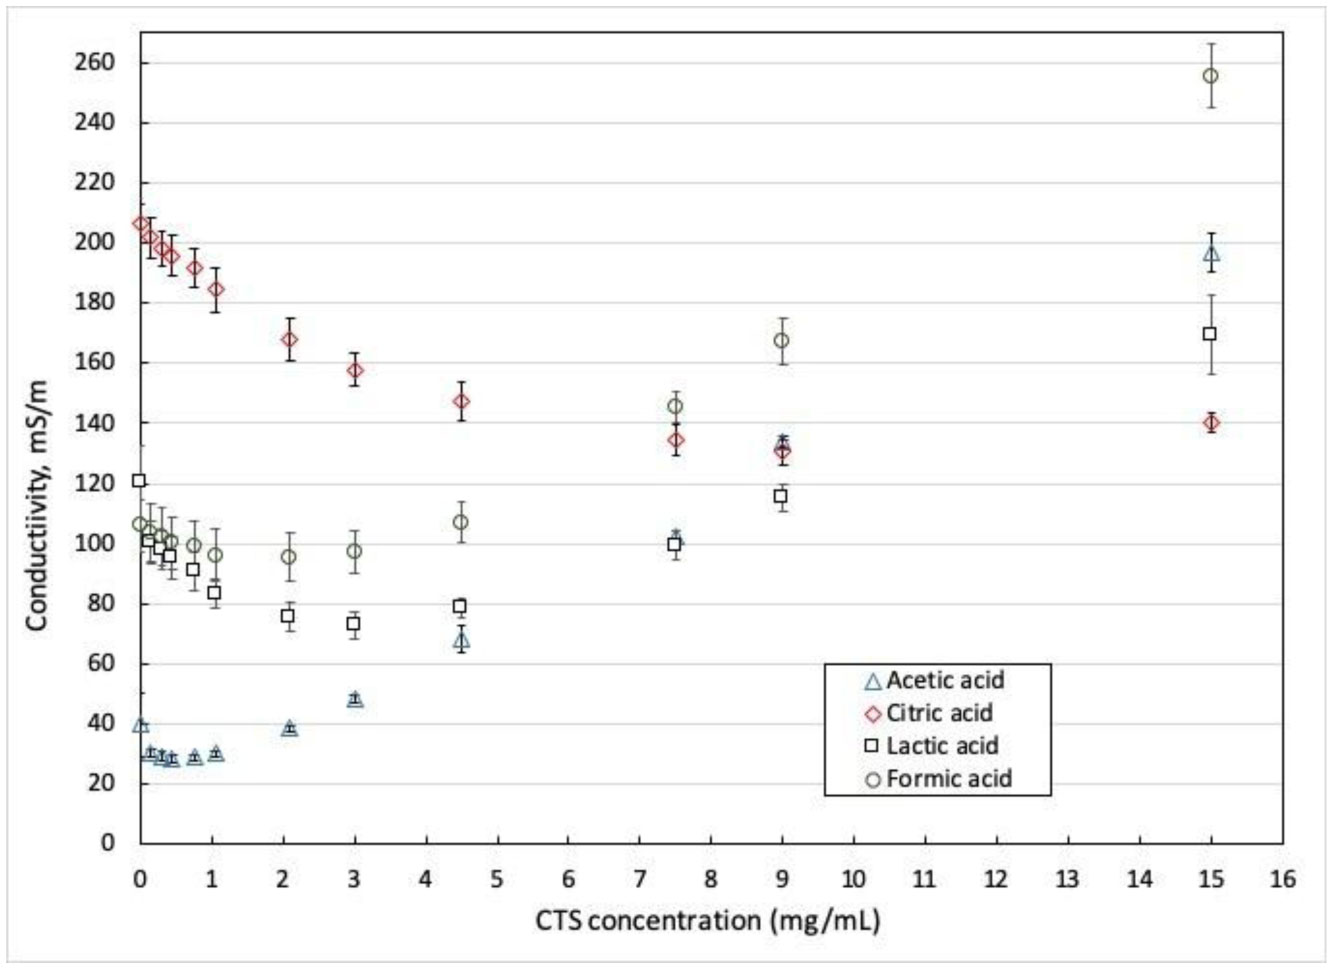
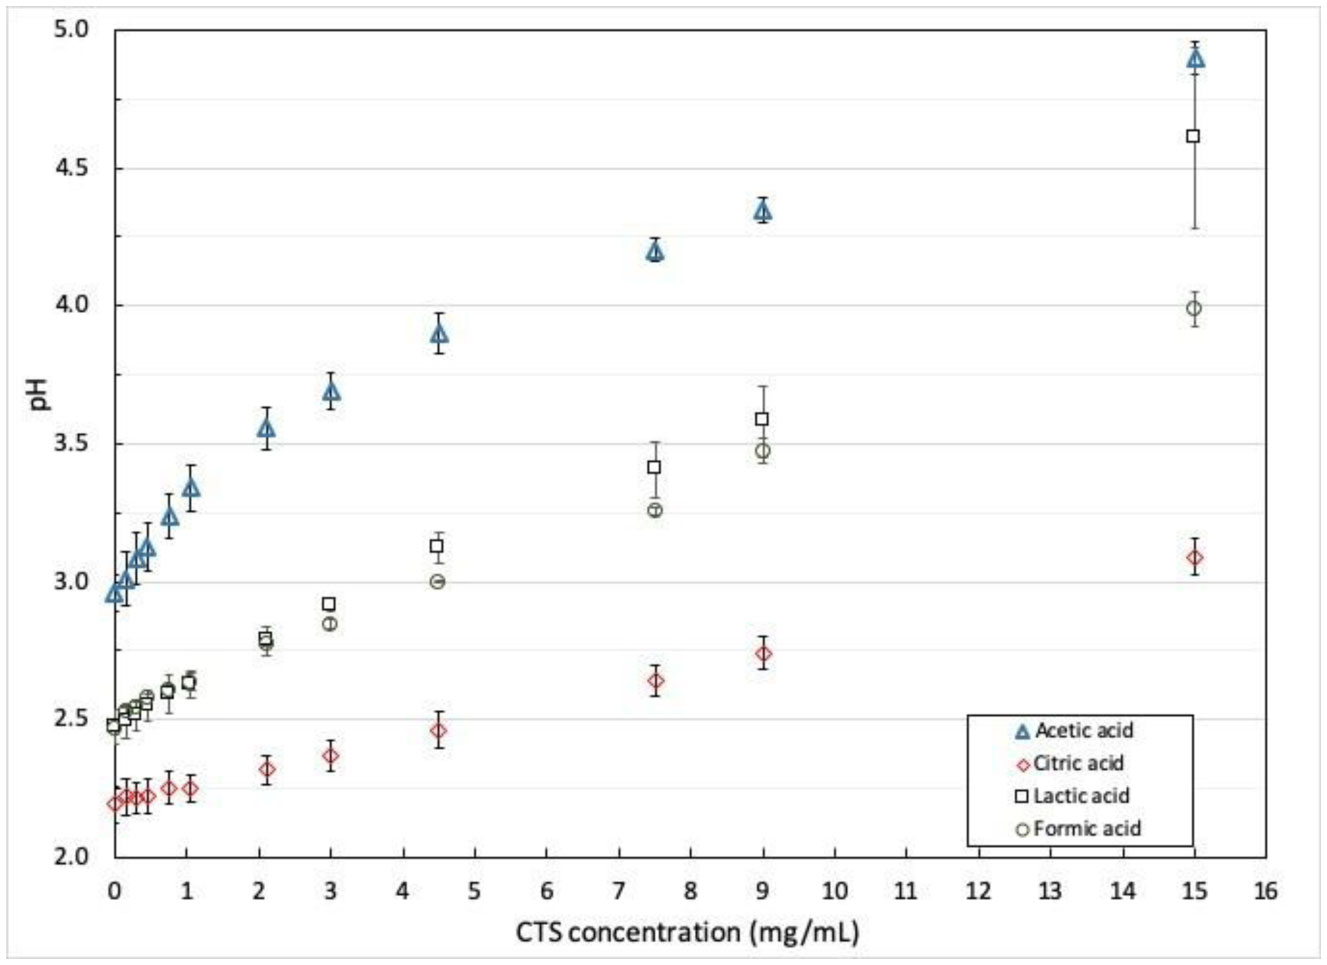
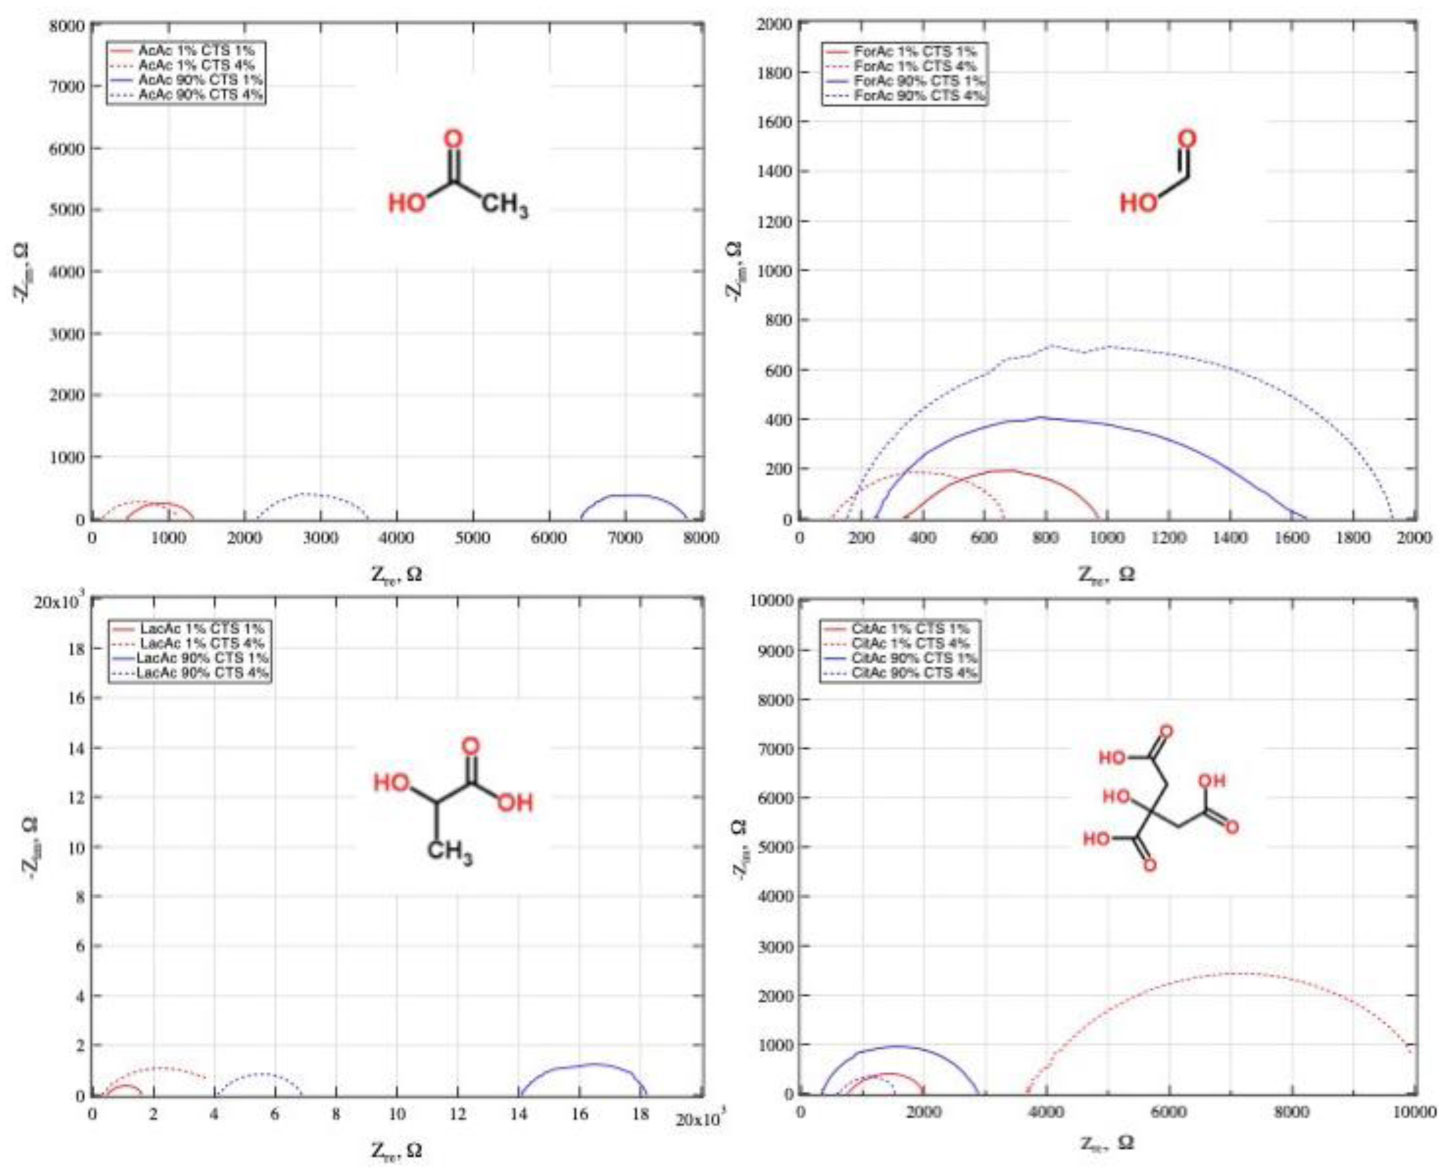
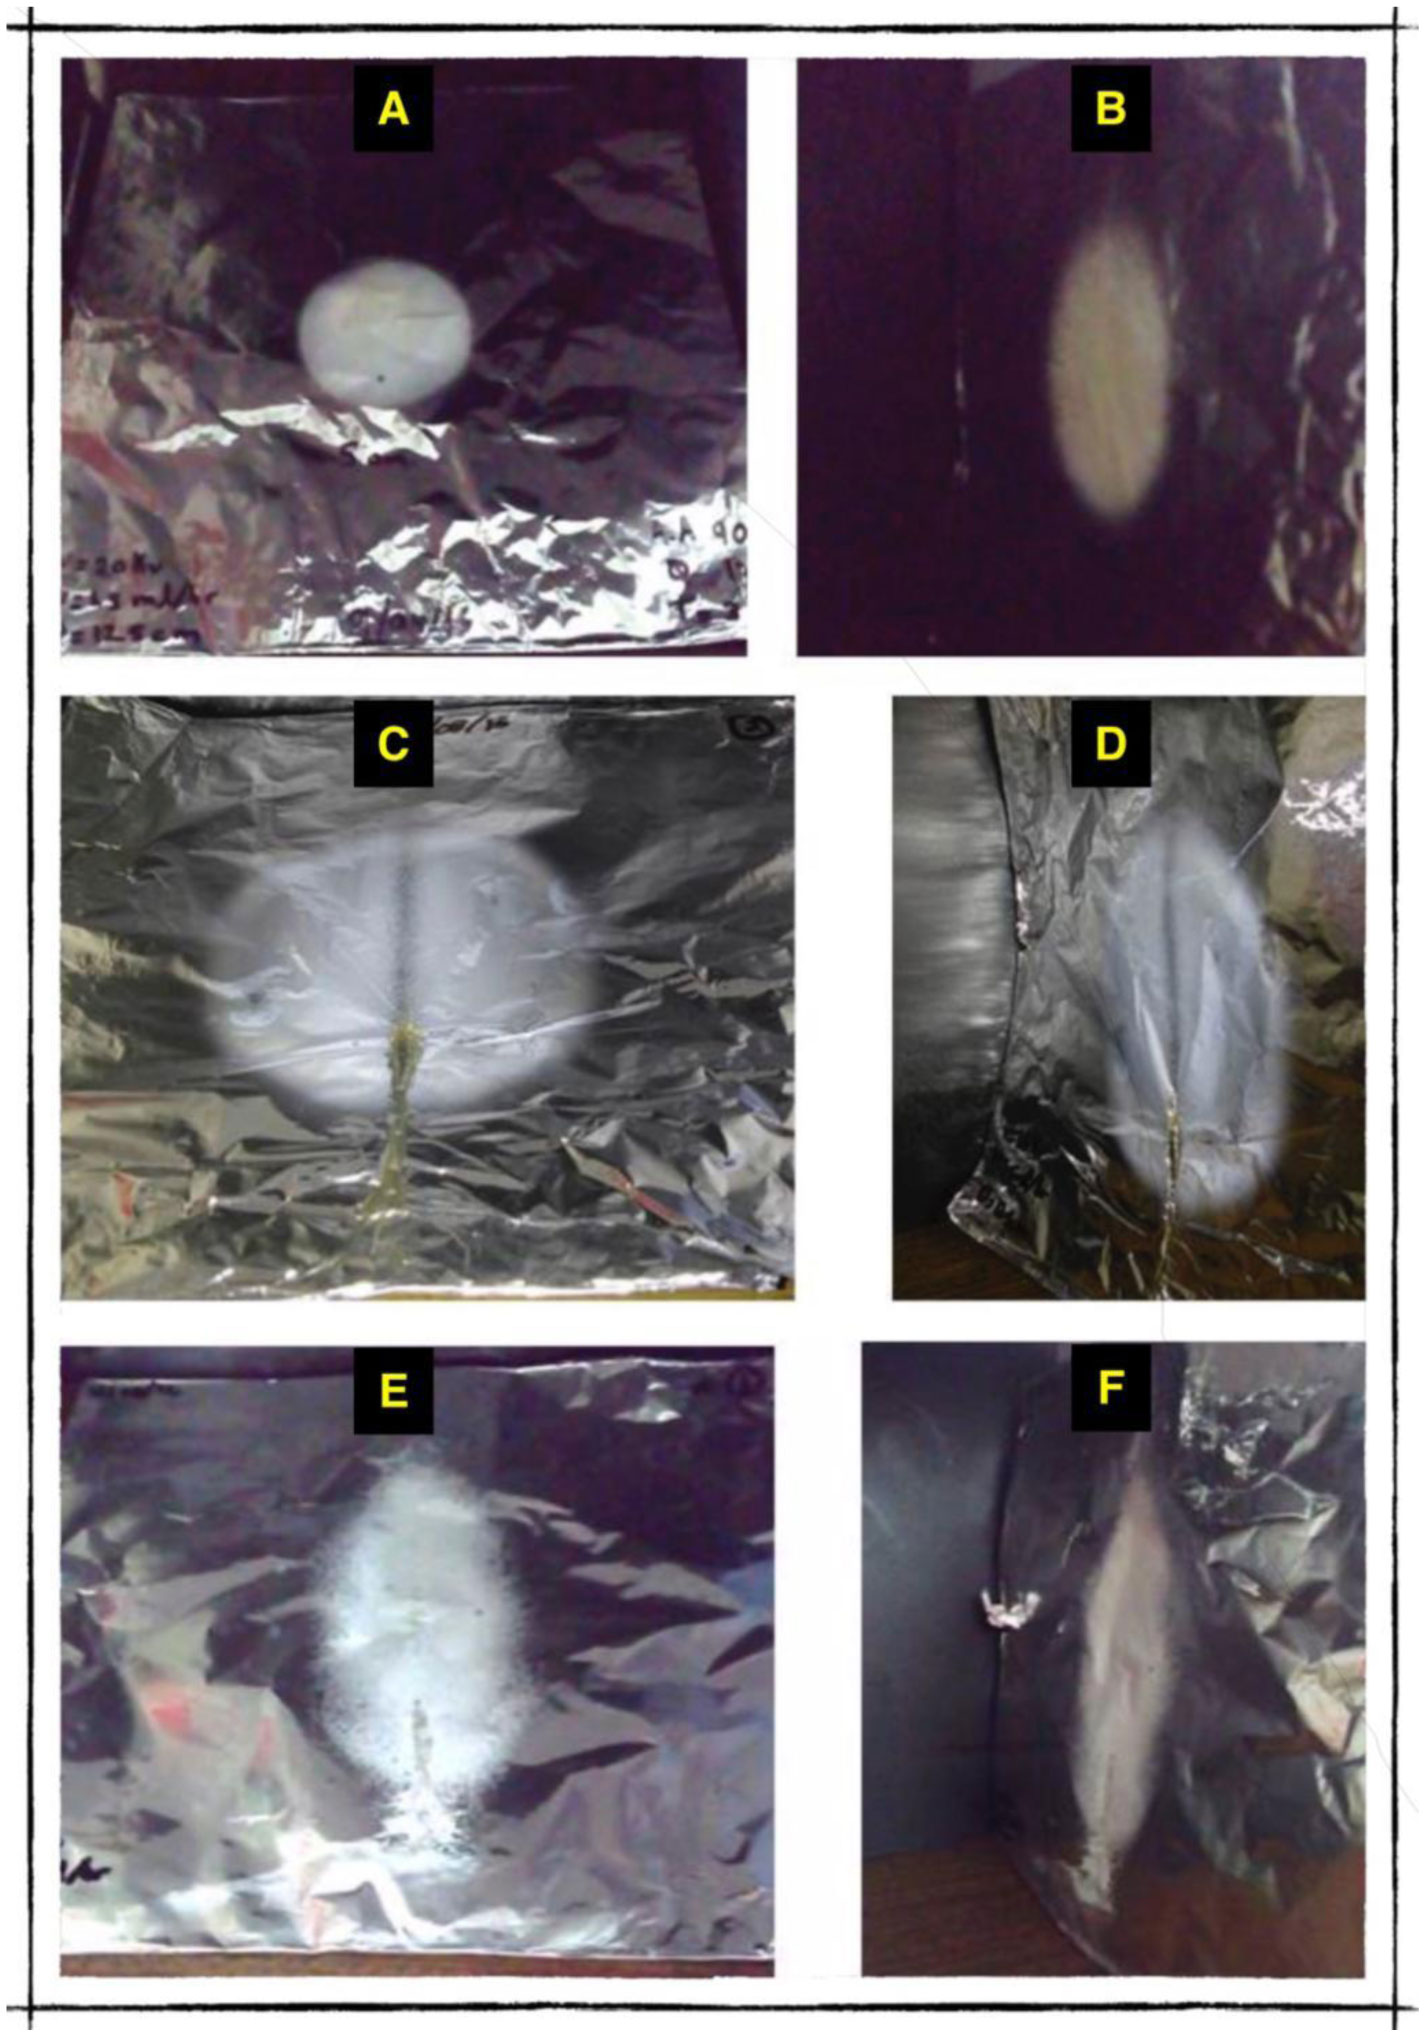
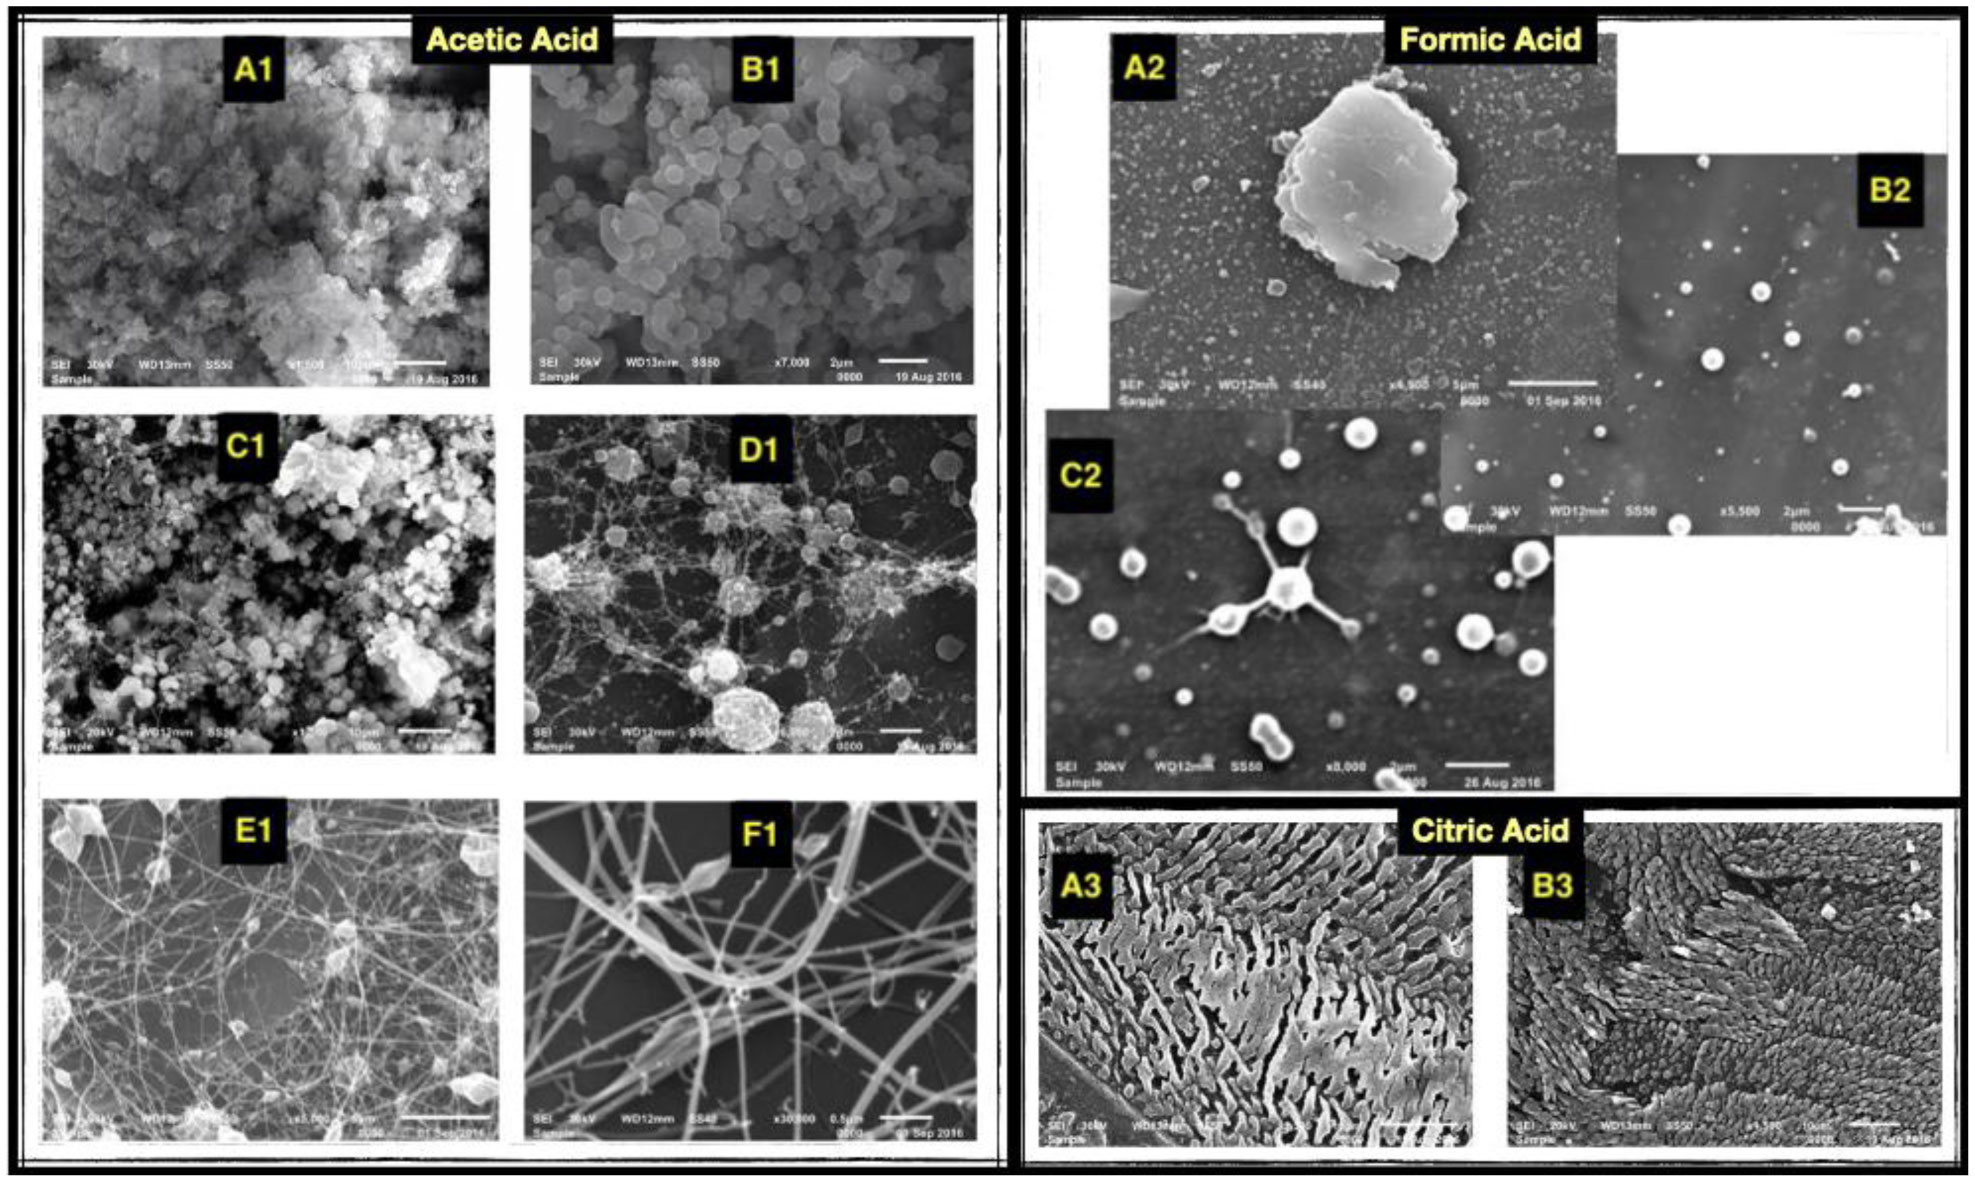
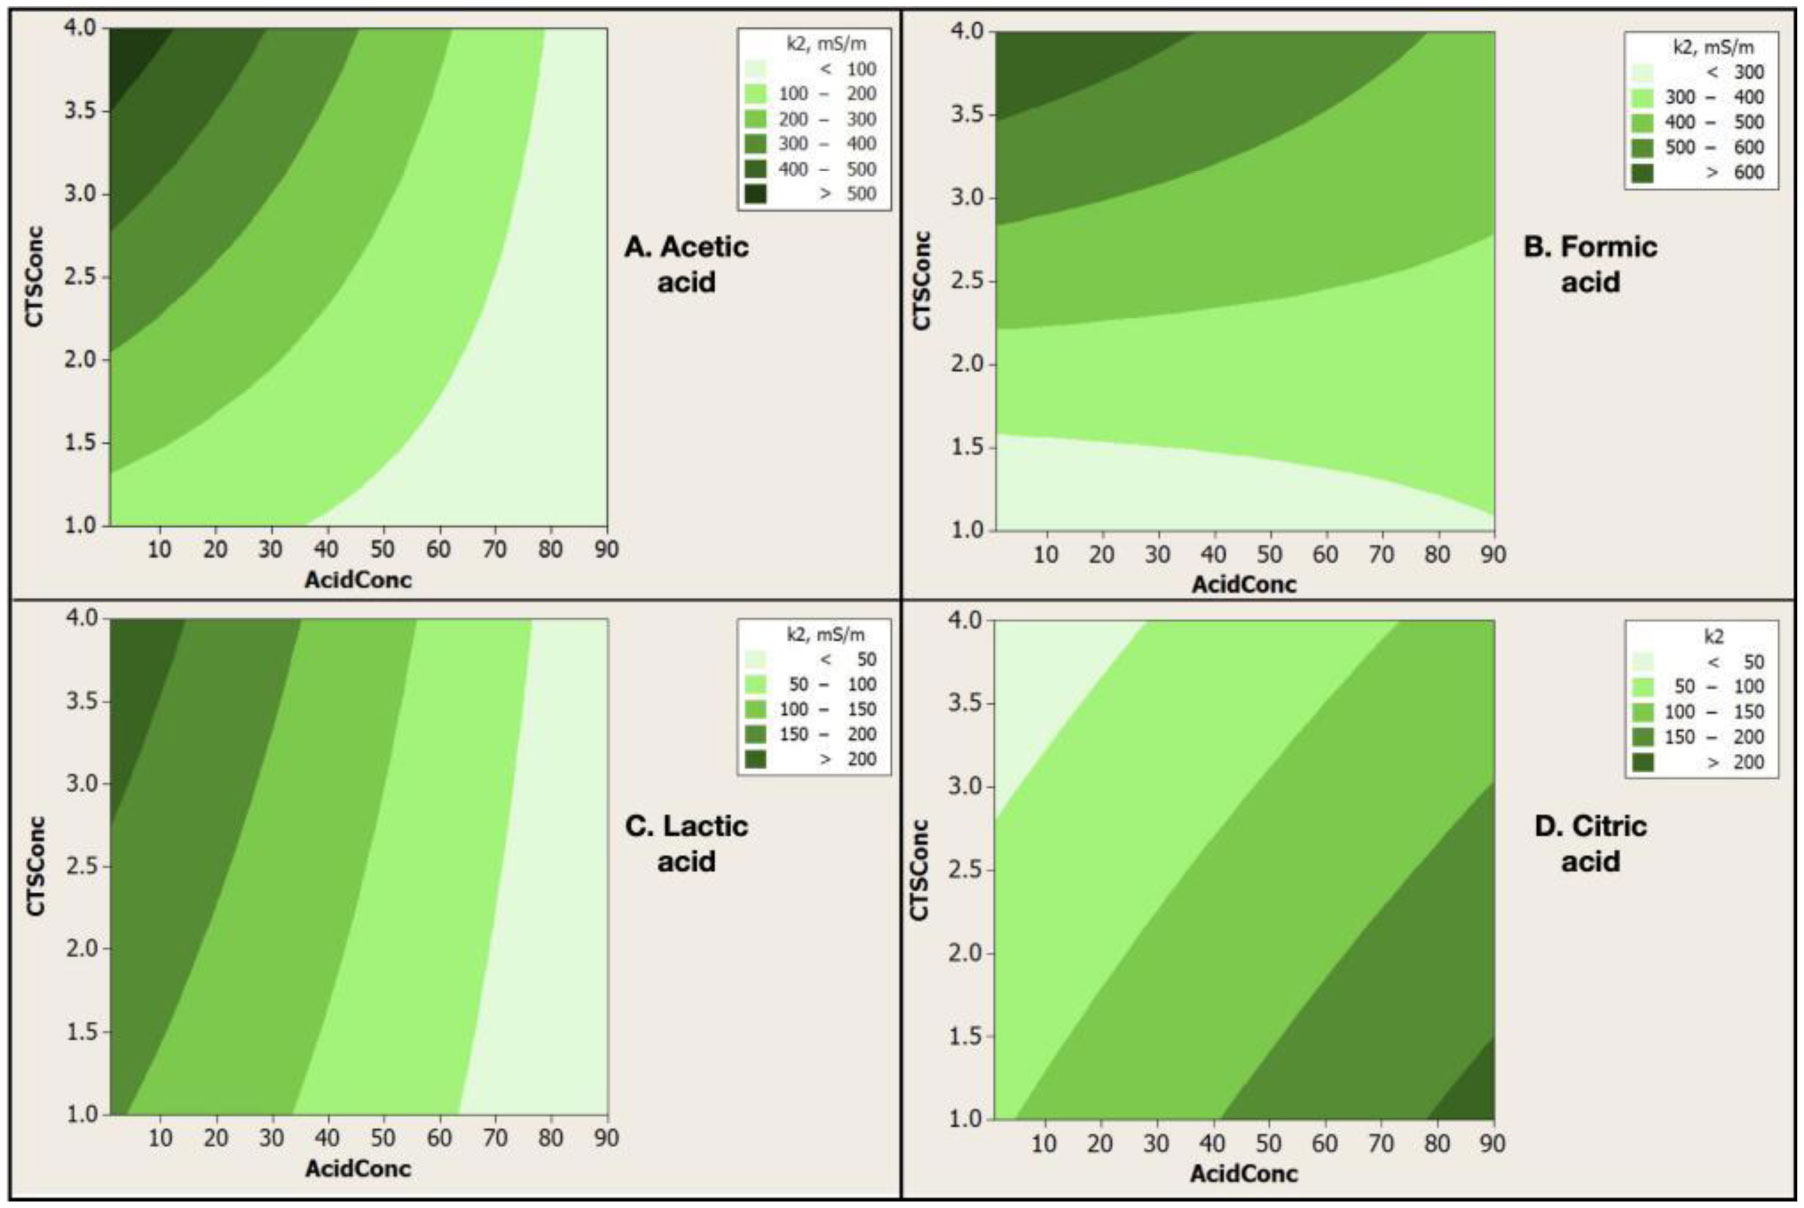
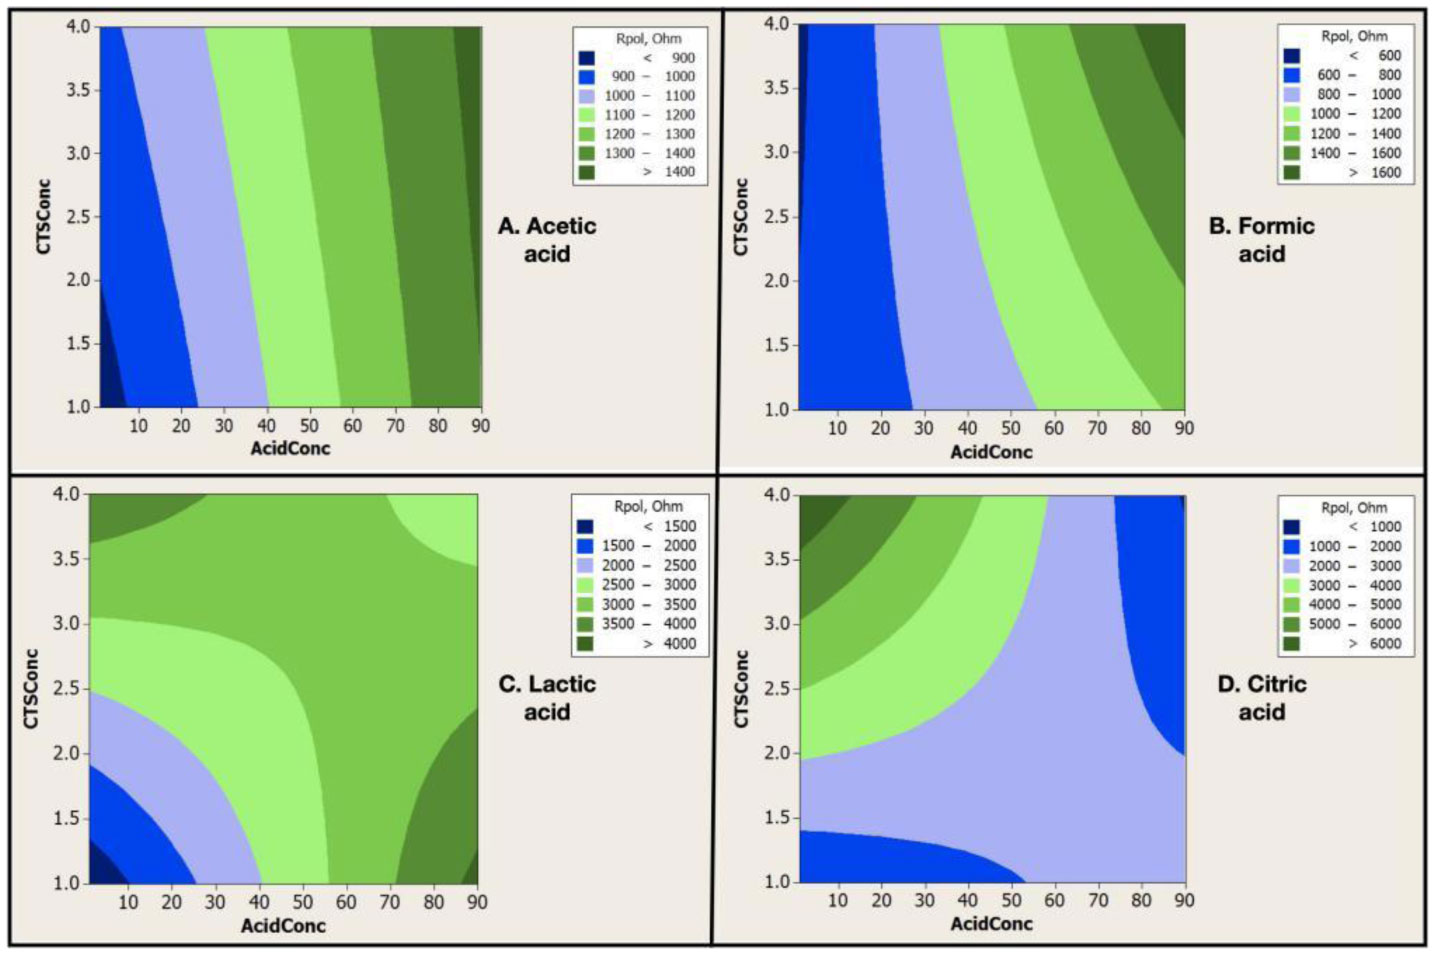
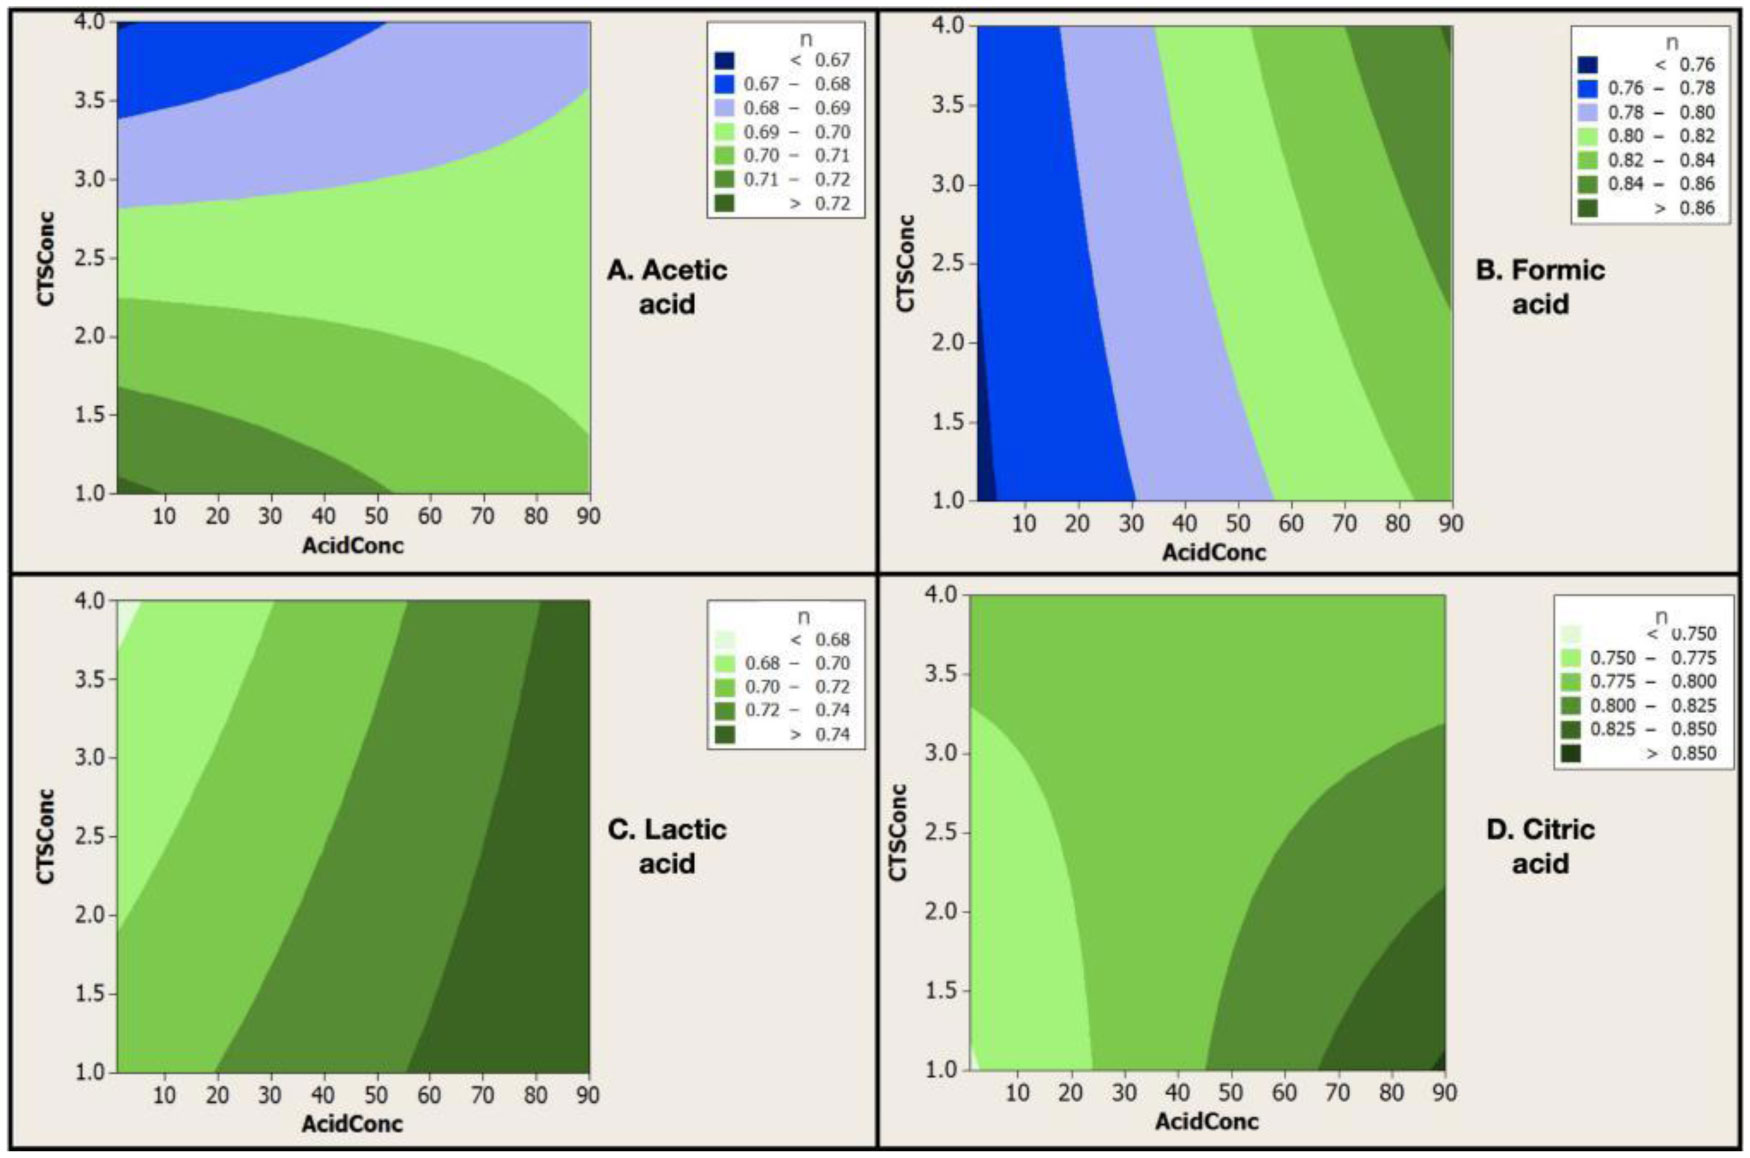
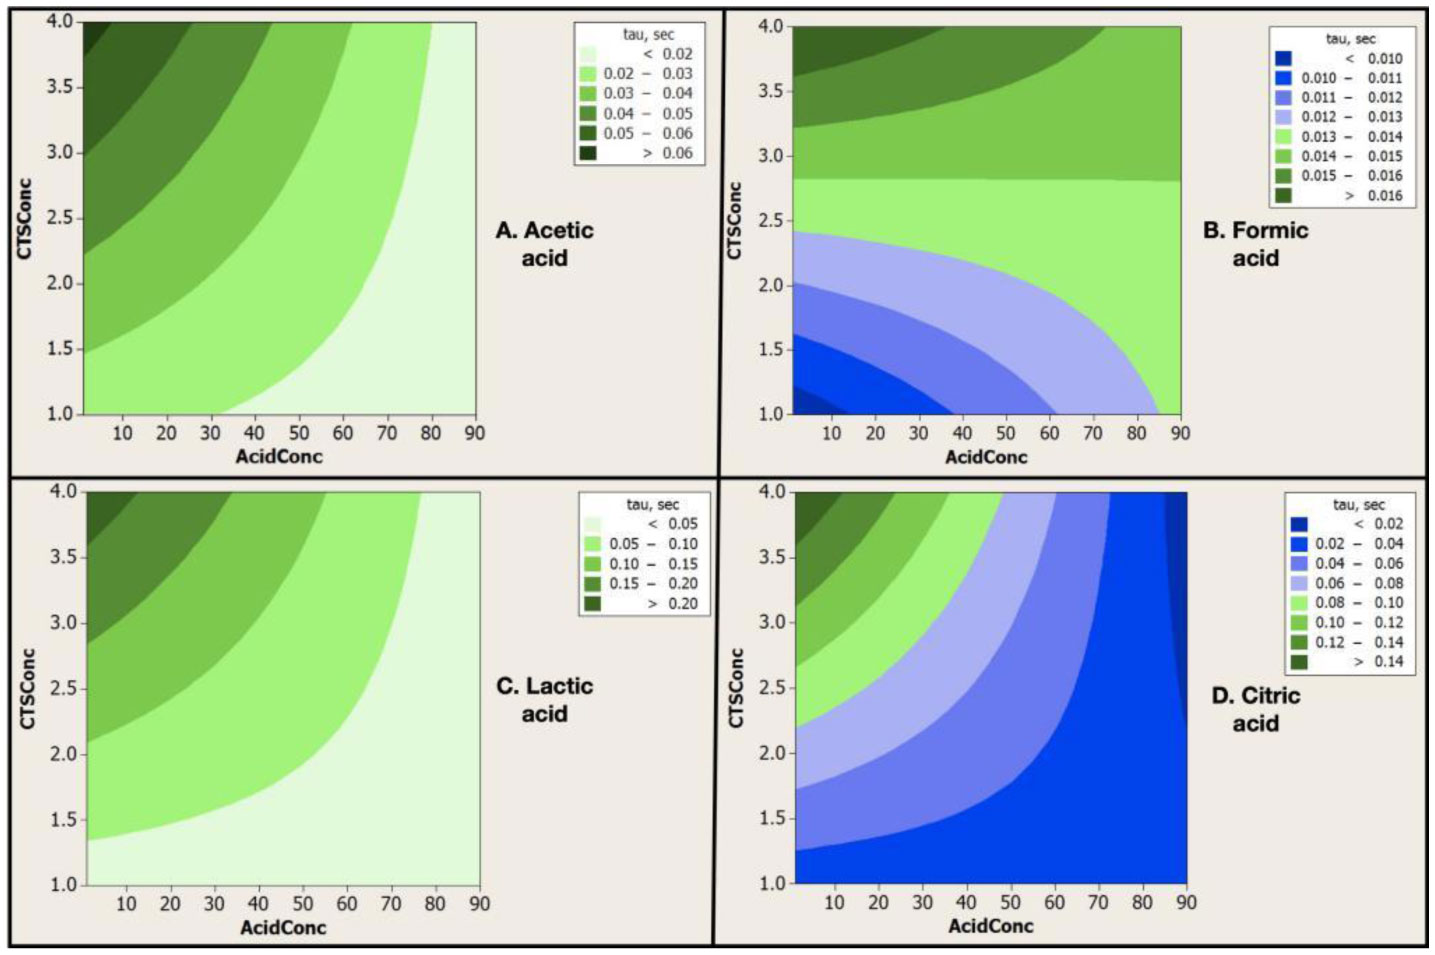
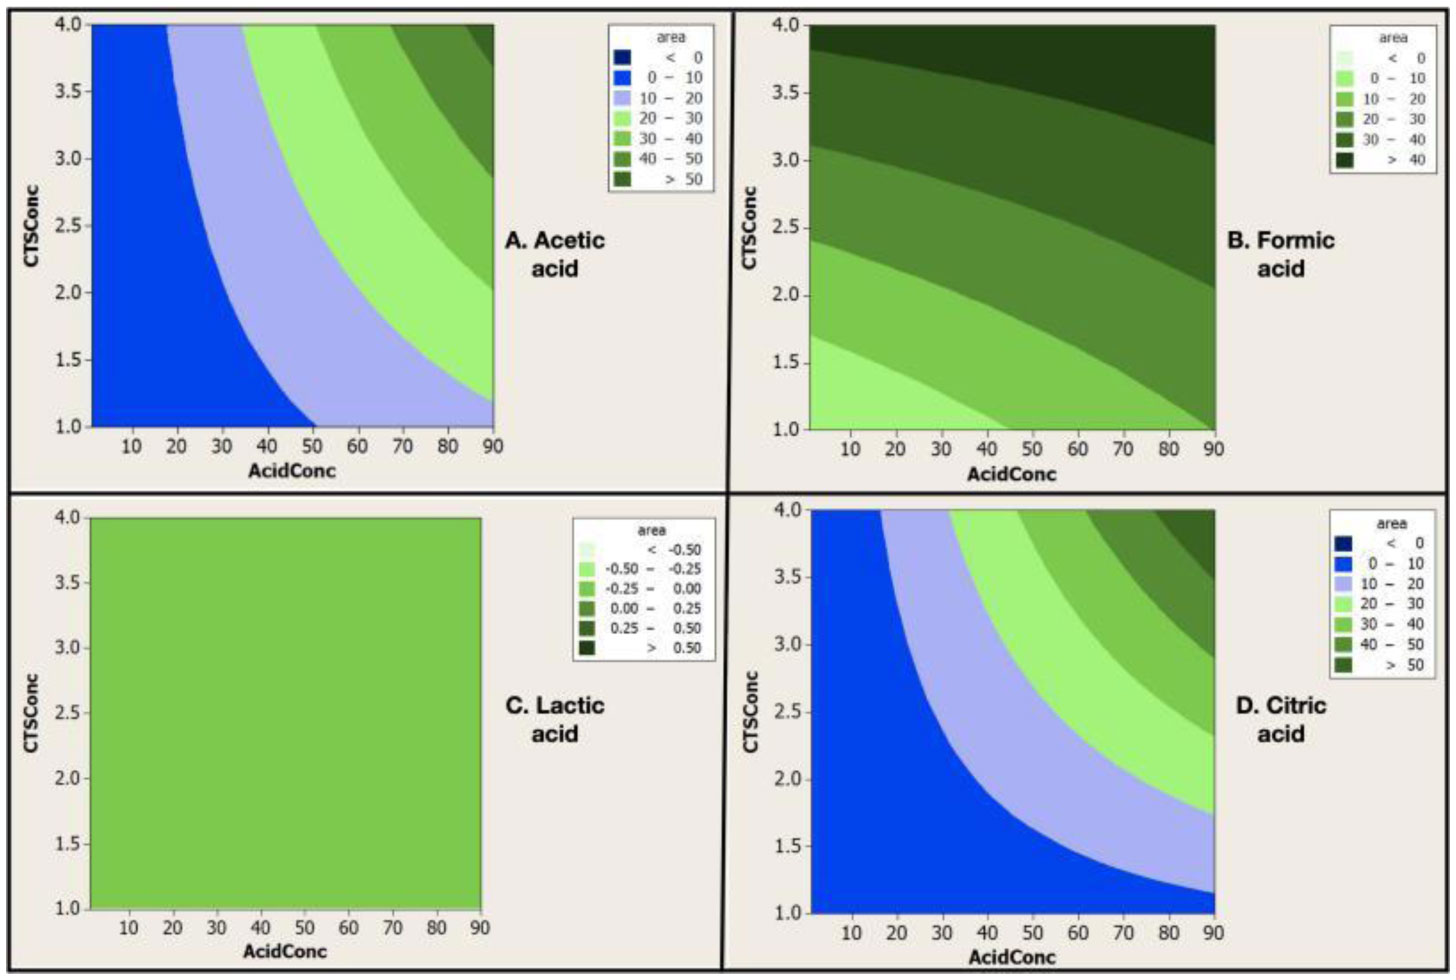
Electrospinning is a production technique for obtaining polymer nanofibers relatively low-cost and straightforward to produce fine fibers. Chitosan (CTS) is a well-known biopolymer widely used for drug delivery, hydrogels, tissue engineering, wound healing, and mats. This work aims to study different chitosan-organic acid solutions' conductivity using electrochemical impedance spectroscopy and equivalent circuit fitting to understand this parameter's influence in the electrospinning process for fiber formation in different organic acids as solvents. The conductivity of dilute chitosan solutions decreases until reaching a minimum value as chitosan concentration increases; conductivity increases linearly as concentration increases. We measured solution resistance, polarization resistance, and relaxation time of chitosan solutions in acetic, formic, lactic, and citric acids using electrical impedance spectroscopy with equivalent circuit modeling. There is no direct correlation between the electrospinnability of the different organic acids solutions with their solution conductivity. We obtained chitosan nanofibers and particles when electrospun a chitosan concentrated solution (4 wt%) in concentrated acetic acid (90 vol%) and obtained submicron particles with a more diluted solution (1 wt%) in concentrated acetic acid (90 vol%). We also obtained chitosan particles from formic acid solutions and completely different ordered and elongated particles with citric acid solutions. Getting insight into the organic acid-chitosan interactions will help improve the electrospinning process to obtain fibers, particles, or both in a controlled fashion and may help design tailored materials.
Citation: Sergio A. Salazar-Brann, Rosalba Patiño-Herrera, Jaime Navarrete-Damián, José F. Louvier-Hernández. Electrospinning of chitosan from different acid solutions[J]. AIMS Bioengineering, 2021, 8(1): 112-129. doi: 10.3934/bioeng.2021011
Electrospinning is a production technique for obtaining polymer nanofibers relatively low-cost and straightforward to produce fine fibers. Chitosan (CTS) is a well-known biopolymer widely used for drug delivery, hydrogels, tissue engineering, wound healing, and mats. This work aims to study different chitosan-organic acid solutions' conductivity using electrochemical impedance spectroscopy and equivalent circuit fitting to understand this parameter's influence in the electrospinning process for fiber formation in different organic acids as solvents. The conductivity of dilute chitosan solutions decreases until reaching a minimum value as chitosan concentration increases; conductivity increases linearly as concentration increases. We measured solution resistance, polarization resistance, and relaxation time of chitosan solutions in acetic, formic, lactic, and citric acids using electrical impedance spectroscopy with equivalent circuit modeling. There is no direct correlation between the electrospinnability of the different organic acids solutions with their solution conductivity. We obtained chitosan nanofibers and particles when electrospun a chitosan concentrated solution (4 wt%) in concentrated acetic acid (90 vol%) and obtained submicron particles with a more diluted solution (1 wt%) in concentrated acetic acid (90 vol%). We also obtained chitosan particles from formic acid solutions and completely different ordered and elongated particles with citric acid solutions. Getting insight into the organic acid-chitosan interactions will help improve the electrospinning process to obtain fibers, particles, or both in a controlled fashion and may help design tailored materials.

| [1] |
Ghorbani-Choghamarani A, Taherinia Z, Heidarnezhad Z, et al. Application of nanofibers based on natural materials as catalyst in organic reactions (2020) . doi: 10.1016/j.jiec.2020.10.028

|
| [2] |
Phan DN, Khan MQ, Nguyen NT, et al. (2021) A review on the fabrication of several carbohydrate polymers into nanofibrous structures using electrospinning for removal of metal ions and dyes. Carbohyd Polym 252: 117175. doi: 10.1016/j.carbpol.2020.117175
|
| [3] |
Liu M, Deng N, Ju J, et al. (2019) A review: electrospun nanofiber materials for lithium-sulfur batteries. Adv Funct Mater 29: 1905467. doi: 10.1002/adfm.201905467
|
| [4] |
Wang H, Niu H, Wang H, et al. (2021) Micro-meso porous structured carbon nanofibers with ultra-high surface area and large supercapacitor electrode capacitance. J Power Sources 482: 228986. doi: 10.1016/j.jpowsour.2020.228986
|
| [5] |
Zhang L, Tang Y, Tong L (2020) Micro-/nanofiber optics: Merging photonics and material science on nanoscale for advanced sensing technology. Iscience 23: 100810. doi: 10.1016/j.isci.2019.100810
|
| [6] |
Aytac Z, Huang R, Vaze N, et al. (2020) Development of biodegradable and antimicrobial electrospun zein fibers for food packaging. ACS Sustain Chem Eng 8: 15354-15365. doi: 10.1021/acssuschemeng.0c05917
|
| [7] |
Feng X, Li J, Zhang X, et al. (2019) Electrospun polymer micro/nanofibers as pharmaceutical repositories for healthcare. J Control Release 302: 19-41. doi: 10.1016/j.jconrel.2019.03.020
|
| [8] |
Ngadiman NHA, Yusof NM, Idris A, et al. (2017) Development of highly porous biodegradable γ-Fe2O3/polyvinyl alcohol nanofiber mats using electrospinning process for biomedical application. Mater Sci Eng C 70: 520-534. doi: 10.1016/j.msec.2016.09.002
|
| [9] |
Horne J, McLoughlin L, Bridgers B, et al. (2020) Recent developments in nanofiber-based sensors for disease detection, immunosensing, and monitoring. Sensor Actuat Rep 2: 100005. doi: 10.1016/j.snr.2020.100005
|
| [10] |
Haghdoost F, Bahrami SH, Barzin J, et al. (2021) Preparation and characterization of electrospun polyethersulfone/polyvinylpyrrolidone-zeolite core–shell composite nanofibers for creatinine adsorption. Sep Purif Technol 257: 117881. doi: 10.1016/j.seppur.2020.117881
|
| [11] |
Zhao Y, Qiu Y, Wang H, et al. Preparation of nanofibers with renewable polymers and their application in wound dressing (2016) . doi: 10.1155/2016/4672839
|
| [12] |
Parham S, Kharazi AZ, Bakhsheshi-Rad HR, et al. (2020) Electrospun nano-fibers for biomedical and tissue engineering applications: A comprehensive review. Materials 13: 2153. doi: 10.3390/ma13092153
|
| [13] |
Haider A, Haider S, Kang IK (2018) A comprehensive review summarizing the effect of electrospinning parameters and potential applications of nanofibers in biomedical and biotechnology. Arab J Chem 11: 1165-1188. doi: 10.1016/j.arabjc.2015.11.015
|
| [14] |
Rezaei Soulegani S, Sherafat Z, Rasouli M (2021) Morphology, physical, and mechanical properties of potentially applicable coelectrospun polysulfone/chitosan-polyvinyl alcohol fibrous membranes in water purification. J Appl Polym Sci 138: 49933. doi: 10.1002/app.49933
|
| [15] |
Sarode S, Upadhyay P, Khosa MA, et al. (2019) Overview of wastewater treatment methods with special focus on biopolymer chitin-chitosan. Int J Biol Macromol 121: 1086-1100. doi: 10.1016/j.ijbiomac.2018.10.089
|
| [16] |
Lee M, Chen BY, Den W (2015) Chitosan as a natural polymer for heterogeneous catalysts support: a short review on its applications. Appl Sci 5: 1272-1283. doi: 10.3390/app5041272
|
| [17] |
Ma J, Sahai Y (2013) Chitosan biopolymer for fuel cell applications. Carbohyd Polym 92: 955-975. doi: 10.1016/j.carbpol.2012.10.015
|
| [18] |
Nasr A, Gawad SA, Fekry AM (2020) A sensor for monitoring the corrosion behavior of orthopedic drug calcium hydrogen phosphate on a surgical 316L stainless steel alloy as implant. J Bio/Tribo-Corros 6: 36. doi: 10.1007/s40735-020-0334-5
|
| [19] |
Dizaji BF, Azerbaijan MH, Sheisi N, et al. (2020) Synthesis of PLGA/chitosan/zeolites and PLGA/chitosan/metal organic frameworks nanofibers for targeted delivery of Paclitaxel toward prostate cancer cells death. Int J Biol Macromol 164: 1461-1474. doi: 10.1016/j.ijbiomac.2020.07.228
|
| [20] |
Nitta S, Kaketani S, Iwamoto H (2015) Development of chitosan-nanofiber-based hydrogels exhibiting high mechanical strength and pH-responsive controlled release. Eur Polym J 67: 50-56. doi: 10.1016/j.eurpolymj.2015.03.053
|
| [21] |
Mombini S, Mohammadnejad J, Bakhshandeh B, et al. (2019) Chitosan-PVA-CNT nanofibers as electrically conductive scaffolds for cardiovascular tissue engineering. Int J Biol Macromol 140: 278-287. doi: 10.1016/j.ijbiomac.2019.08.046
|
| [22] |
Bayat S, Amiri N, Pishavar E, et al. (2019) Bromelain-loaded chitosan nanofibers prepared by electrospinning method for burn wound healing in animal models. Life Sci 229: 57-66. doi: 10.1016/j.lfs.2019.05.028
|
| [23] |
Qiu H, Zhu S, Pang L, et al. (2020) ICG-loaded photodynamic chitosan/polyvinyl alcohol composite nanofibers: Anti-resistant bacterial effect and improved healing of infected wounds. Int J Pharmaceut 588: 119797. doi: 10.1016/j.ijpharm.2020.119797
|
| [24] |
Kalantari K, Afifi AM, Jahangirian H, et al. (2019) Biomedical applications of chitosan electrospun nanofibers as a green polymer–Review. Carbohyd Polym 207: 588-600. doi: 10.1016/j.carbpol.2018.12.011
|
| [25] |
Kurita K (2006) Chitin and chitosan: functional biopolymers from marine crustaceans. Mar Biotechnol 8: 203-226. doi: 10.1007/s10126-005-0097-5
|
| [26] |
Kaya M, Akyuz B, Bulut E, et al. (2016) Chitosan nanofiber production from Drosophila by electrospinning. Int J Biol Macromol 92: 49-55. doi: 10.1016/j.ijbiomac.2016.07.021
|
| [27] |
Wang W, Meng Q, Li Q, et al. (2020) Chitosan derivatives and their application in biomedicine. Int J Mol Sci 21: 487. doi: 10.3390/ijms21020487
|
| [28] |
Rinaudo M (2006) Chitin and chitosan: Properties and applications. Prog Polym Sci 31: 603-632. doi: 10.1016/j.progpolymsci.2006.06.001
|
| [29] |
Liu Y, Park M, Shin HK, et al. (2014) Facile preparation and characterization of poly (vinyl alcohol)/chitosan/graphene oxide biocomposite nanofibers. J Ind Eng Chem 20: 4415-4420. doi: 10.1016/j.jiec.2014.02.009
|
| [30] |
Xu J, Zhang J, Gao W, et al. (2009) Preparation of chitosan/PLA blend micro/nanofibers by electrospinning. Mater Lett 63: 658-660. doi: 10.1016/j.matlet.2008.12.014
|
| [31] |
Zhang H, Wu C, Zhang Y, et al. (2010) Elaboration, characterization and study of a novel affinity membrane made from electrospun hybrid chitosan/nylon-6 nanofibers for papain purification. J Mater Sci 45: 2296-2304. doi: 10.1007/s10853-009-4191-3
|
| [32] |
Spasova M, Manolova N, Paneva D, et al. (2004) Preparation of chitosan-containing nanofibres by electrospinning of chitosan/poly (ethylene oxide) blend solutions. E-Polymers 4: 056. doi: 10.1515/epoly.2004.4.1.624
|
| [33] |
Desai K, Kit K, Li J, et al. (2008) Morphological and surface properties of electrospun chitosan nanofibers. Biomacromolecules 9: 1000-1006. doi: 10.1021/bm701017z
|
| [34] |
Mengistu Lemma S, Bossard F, Rinaudo M (2016) Preparation of pure and stable chitosan nanofibers by electrospinning in the presence of poly (ethylene oxide). Int J Mol Sci 17: 1790. doi: 10.3390/ijms17111790
|
| [35] |
Ohkawa K, Cha D, Kim H, et al. (2004) Electrospinning of chitosan. Macromol Rapid Comm 25: 1600-1605. doi: 10.1002/marc.200400253
|
| [36] |
Ohkawa K, Minato KI, Kumagai G, et al. (2006) Chitosan nanofiber. Biomacromolecules 7: 3291-3294. doi: 10.1021/bm0604395
|
| [37] |
Nirmala R, Il BW, Navamathavan R, et al. (2011) Preparation and characterizations of anisotropic chitosan nanofibers via electrospinning. Macromol Res 19: 345. doi: 10.1007/s13233-011-0402-2
|
| [38] |
Nirmala R, Navamathavan R, El-Newehy MH, et al. (2011) Preparation and electrical characterization of polyamide-6/chitosan composite nanofibers via electrospinning. Mater Lett 65: 493-496. doi: 10.1016/j.matlet.2010.10.066
|
| [39] |
Geng X, Kwon OH, Jang J (2005) Electrospinning of chitosan dissolved in concentrated acetic acid solution. Biomaterials 26: 5427-5432. doi: 10.1016/j.biomaterials.2005.01.066
|
| [40] |
Homayoni H, Ravandi SAH, Valizadeh M (2009) Electrospinning of chitosan nanofibers: Processing optimization. Carbohyd Polym 77: 656-661. doi: 10.1016/j.carbpol.2009.02.008
|
| [41] |
Ibrahim HM, Klingner A (2020) A review on electrospun polymeric nanofibers: Production parameters and potential applications. Polym Test 90: 106647. doi: 10.1016/j.polymertesting.2020.106647
|
| [42] |
Rinaudo M, Milas M, Le Dung P (1993) Characterization of chitosan. Influence of ionic strength and degree of acetylation on chain expansion. Int J Biol Macromol 15: 281-285. doi: 10.1016/0141-8130(93)90027-J
|
| [43] |
Tan SC, Khor E, Tan T K, et al. (1998) The degree of deacetylation of chitosan: advocating the first derivative UV-spectrophotometry method of determination. Talanta 45: 713-719. doi: 10.1016/S0039-9140(97)00288-9
|
| [44] | ASTM D1125-14 Standard Test Methods for Electrical Conductivity and Resistivity of Water, ASTM International, West Conshohocken, PA (2014) . |
| [45] |
Viera DF, Avellaneda CO, Pawlicka A (2008) AC impedance, X-ray diffraction and DSC investigation on gelatin based-electrolyte with LiClO4. Mol Cryst Liq Cryst 485: 843-852. doi: 10.1080/15421400801922304
|
| [46] |
Shukur MF, Majid NA, Ithnin R, et al. (2013) Effect of plasticization on the conductivity and dielectric properties of starch–chitosan blend biopolymer electrolytes infused with NH4Br. Phys Scr 2013: 014051. doi: 10.1088/0031-8949/2013/T157/014051
|
| [47] |
Bossard F, Rinaudo M (2019) Biomaterials from chitosan processed by electrospinning. Nanoworld J 5: 32-35. doi: 10.17756/nwj.2019-069
|
| [48] |
Li Q, Song B, Yang Z, et al. (2006) Electrolytic conductivity behaviors and solution conformations of chitosan in different acid solutions. Carbohyd Polym 63: 272-282. doi: 10.1016/j.carbpol.2005.09.024
|
| [49] |
Andrady AL (2008) Science and Technology of Polymer Nanofibers New Jersey: John Wiley & Sons. doi: 10.1002/9780470229842
|
 bioeng-08-01-011-s001.pdf bioeng-08-01-011-s001.pdf |
 |
Figures(12) / Tables(1)

Sergio A. Salazar-Brann, Rosalba Patiño-Herrera, Jaime Navarrete-Damián, José F. Louvier-Hernández. Electrospinning of chitosan from different acid solutions[J]. AIMS Bioengineering, 2021, 8(1): 112-129. doi: 10.3934/bioeng.2021011


 DownLoad: