Parenting is a demanding undertaking, requiring continuous vigilance to ensure children's emotional, physical, and spiritual well-being. It has become even more challenging in the context of COVID-19 restrictions that have led to drastic changes in family life. Based on the results of a qualitative interpretive descriptive study that aimed to understand the experiences of immigrants living in apartment buildings in the Greater Toronto Area, Ontario, Canada, this paper reports the experiences of 50 immigrant parents. During the summer and fall of 2020, semi-structured interviews were conducted by phone or virtually, audio-recorded, then translated and transcribed. The transcripts were analyzed using thematic analysis. Results revealed that parenting experiences during the pandemic entailed dealing with changing relationships, coping with added burdens and pressures, living in persistent fear and anxiety, and rethinking lifestyles and habits. Amid these changes and challenges, some parents managed to create opportunities for their children to improve their diet, take a break from their rushed lives, get in touch with their cultural and linguistic backgrounds, and spend more quality time with their family. While immigrant parents exhibit remarkable resilience in dealing with the pandemic-related meso and macro-levels restrictions, funding and programs are urgently needed to support them in addressing the impact of these at the micro level.
Citation: Sepali Guruge, Paula Lamaj, Charlotte Lee, Charlene Esteban Ronquillo, Souraya Sidani, Ernest Leung, Andrew Ssawe, Jason Altenberg, Hasina Amanzai, Lynn Morrison. COVID-19 restrictions: experiences of immigrant parents in Toronto[J]. AIMS Public Health, 2021, 8(1): 172-185. doi: 10.3934/publichealth.2021013
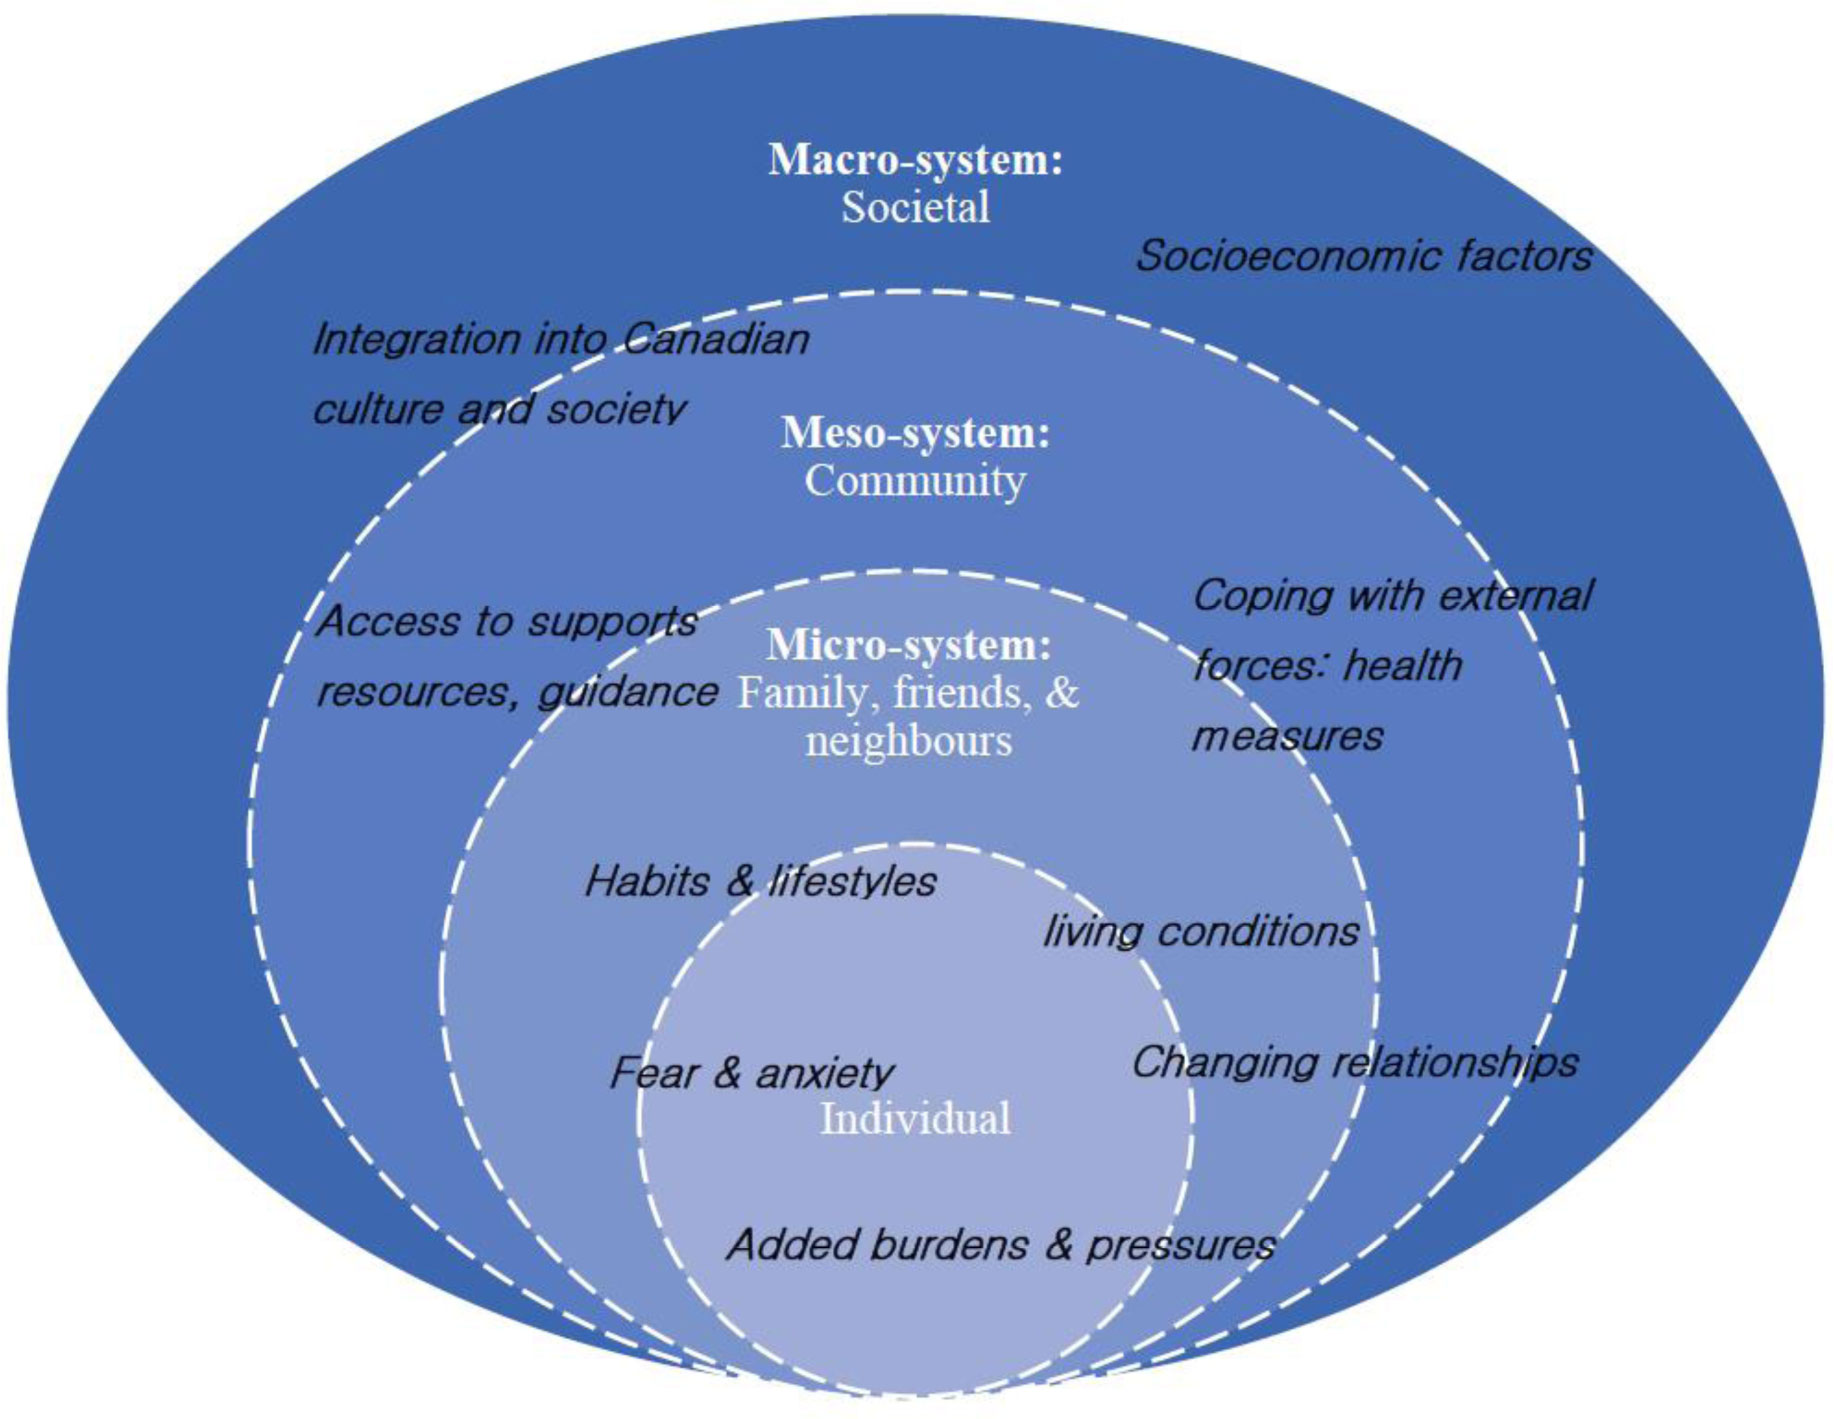
Parenting is a demanding undertaking, requiring continuous vigilance to ensure children's emotional, physical, and spiritual well-being. It has become even more challenging in the context of COVID-19 restrictions that have led to drastic changes in family life. Based on the results of a qualitative interpretive descriptive study that aimed to understand the experiences of immigrants living in apartment buildings in the Greater Toronto Area, Ontario, Canada, this paper reports the experiences of 50 immigrant parents. During the summer and fall of 2020, semi-structured interviews were conducted by phone or virtually, audio-recorded, then translated and transcribed. The transcripts were analyzed using thematic analysis. Results revealed that parenting experiences during the pandemic entailed dealing with changing relationships, coping with added burdens and pressures, living in persistent fear and anxiety, and rethinking lifestyles and habits. Amid these changes and challenges, some parents managed to create opportunities for their children to improve their diet, take a break from their rushed lives, get in touch with their cultural and linguistic backgrounds, and spend more quality time with their family. While immigrant parents exhibit remarkable resilience in dealing with the pandemic-related meso and macro-levels restrictions, funding and programs are urgently needed to support them in addressing the impact of these at the micro level.

| [1] | Griffith A (2020) Parental burnout and child maltreatment during the COVID-19 pandemic. J Fam Violence 1-7. |
| [2] |
Hiraoka D, Tomoda A (2020) Relationship between parenting stress and school closures due to the COVID-19 pandemic. Psychiatry Clin Neurosci 74: 497-498. doi: 10.1111/pcn.13088

|
| [3] | Crook S (2020) Parenting during the Covid-19 pandemic of 2020: Academia, labour and care work. Women's Hist Rev 1-13. |
| [4] | Chung G, Lanier P, Wong P (2020) Mediating effects of parental stress on harsh parenting and parent-child relationship during coronavirus (COVID-19) pandemic in Singapore. J Fam Violence 1-12. |
| [5] | Craig L (2020) Coronavirus, domestic labour and care: Gendered roles locked down. J Sociol 1-9. |
| [6] | Feng Z, Savani K (2020) Covid-19 created a gender gap in perceived work productivity and job satisfaction: Implications for dual-career parents working from home. Gender Manage . |
| [7] |
Falicov C, Niño A, D'Urso S (2020) Expanding possibilities: Flexibility and solidarity with Under-resourced immigrant families during the COVID-19 pandemic. Fam Process 59: 865-882. doi: 10.1111/famp.12578
|
| [8] | Brown S, Doom J, Lechuga-Peña S, et al. (2020) Stress and parenting during the global COVID-19 pandemic. Child Abuse Neglect 1-14. |
| [9] |
Waller M (2001) Resilience in ecosystemic context: Evolution of the concept. Am J Orthopsychiatry 71: 290-297. doi: 10.1037/0002-9432.71.3.290
|
| [10] | Guruge S, Khanlou N (2004) Intersectionalities of influence: Researching the health of immigrant and refugee women. Can J Nurs Res 36: 32-47. |
| [11] |
Thorne S, Kirkham S, O'Flynn-Magee K (2004) The analytic challenge in interpretive description. Int J Qual Methods 3: 1-11. doi: 10.1177/160940690400300101
|
| [12] | Elliott R, Timulak L (2005) Descriptive and interpretive approaches to qualitative research. A handbook of research methods for clinical and health psychology Oxford: Oxford University Press, 147-159. |
| [13] | Thorne S (2016) Interpretive description: Qualitative research for applied practice New York: Routledge. |
| [14] | Bryman A (2001) Social research methods New York: Oxford University Press. |
| [15] | Chang GC, Yano S (2020) How are countries addressing the COVID-19 challenges in education? A snapshot of policy measures. World Education Blog Available from: https://gemreportunesco.wordpress.com/2020/03/24/how-are-countriesaddressing-the-covid-19-challenges-in-education-a-snapshot-of-policy-measures. |
| [16] | Carius A (2020) Teaching Practices in Mathematics During COVID-19 Pandemic: Challenges for Technological Inclusion in a Rural Brazilian School. Am Scientific Res J Eng Technol Sci 72: 35-43. |
| [17] | Corlatean T (2020) Risks, discrimination and opportunities for education during the times of COVID-19 pandemic. Proceedings of the 17th Research Association for Interdisciplinary Studies Conference 37-46. |
| [18] | Brown S, Doom J, Lechuga-Peña S, et al. (2020) Stress and parenting during the global COVID-19 pandemic. Child Abuse Neglect 1-14. |
| [19] |
Haque E (2010) Homegrown, Muslim and other: Tolerance, secularism and the limits of multiculturalism. Soc Identities 16: 79-101. doi: 10.1080/13504630903465902
|
| [20] | Lai Y, Hynie M (2010) Community engagement and well-being of immigrants: The role of knowledge. Can Issues 93-98. |
| [21] | McKenzie J, Pinger R, Kotecki J (2011) An introduction to community health Sudbury, MA: Jones & Bartlett Publishers. |
Figures(1) / Tables(1)

Sepali Guruge, Paula Lamaj, Charlotte Lee, Charlene Esteban Ronquillo, Souraya Sidani, Ernest Leung, Andrew Ssawe, Jason Altenberg, Hasina Amanzai, Lynn Morrison. COVID-19 restrictions: experiences of immigrant parents in Toronto[J]. AIMS Public Health, 2021, 8(1): 172-185. doi: 10.3934/publichealth.2021013


 DownLoad: