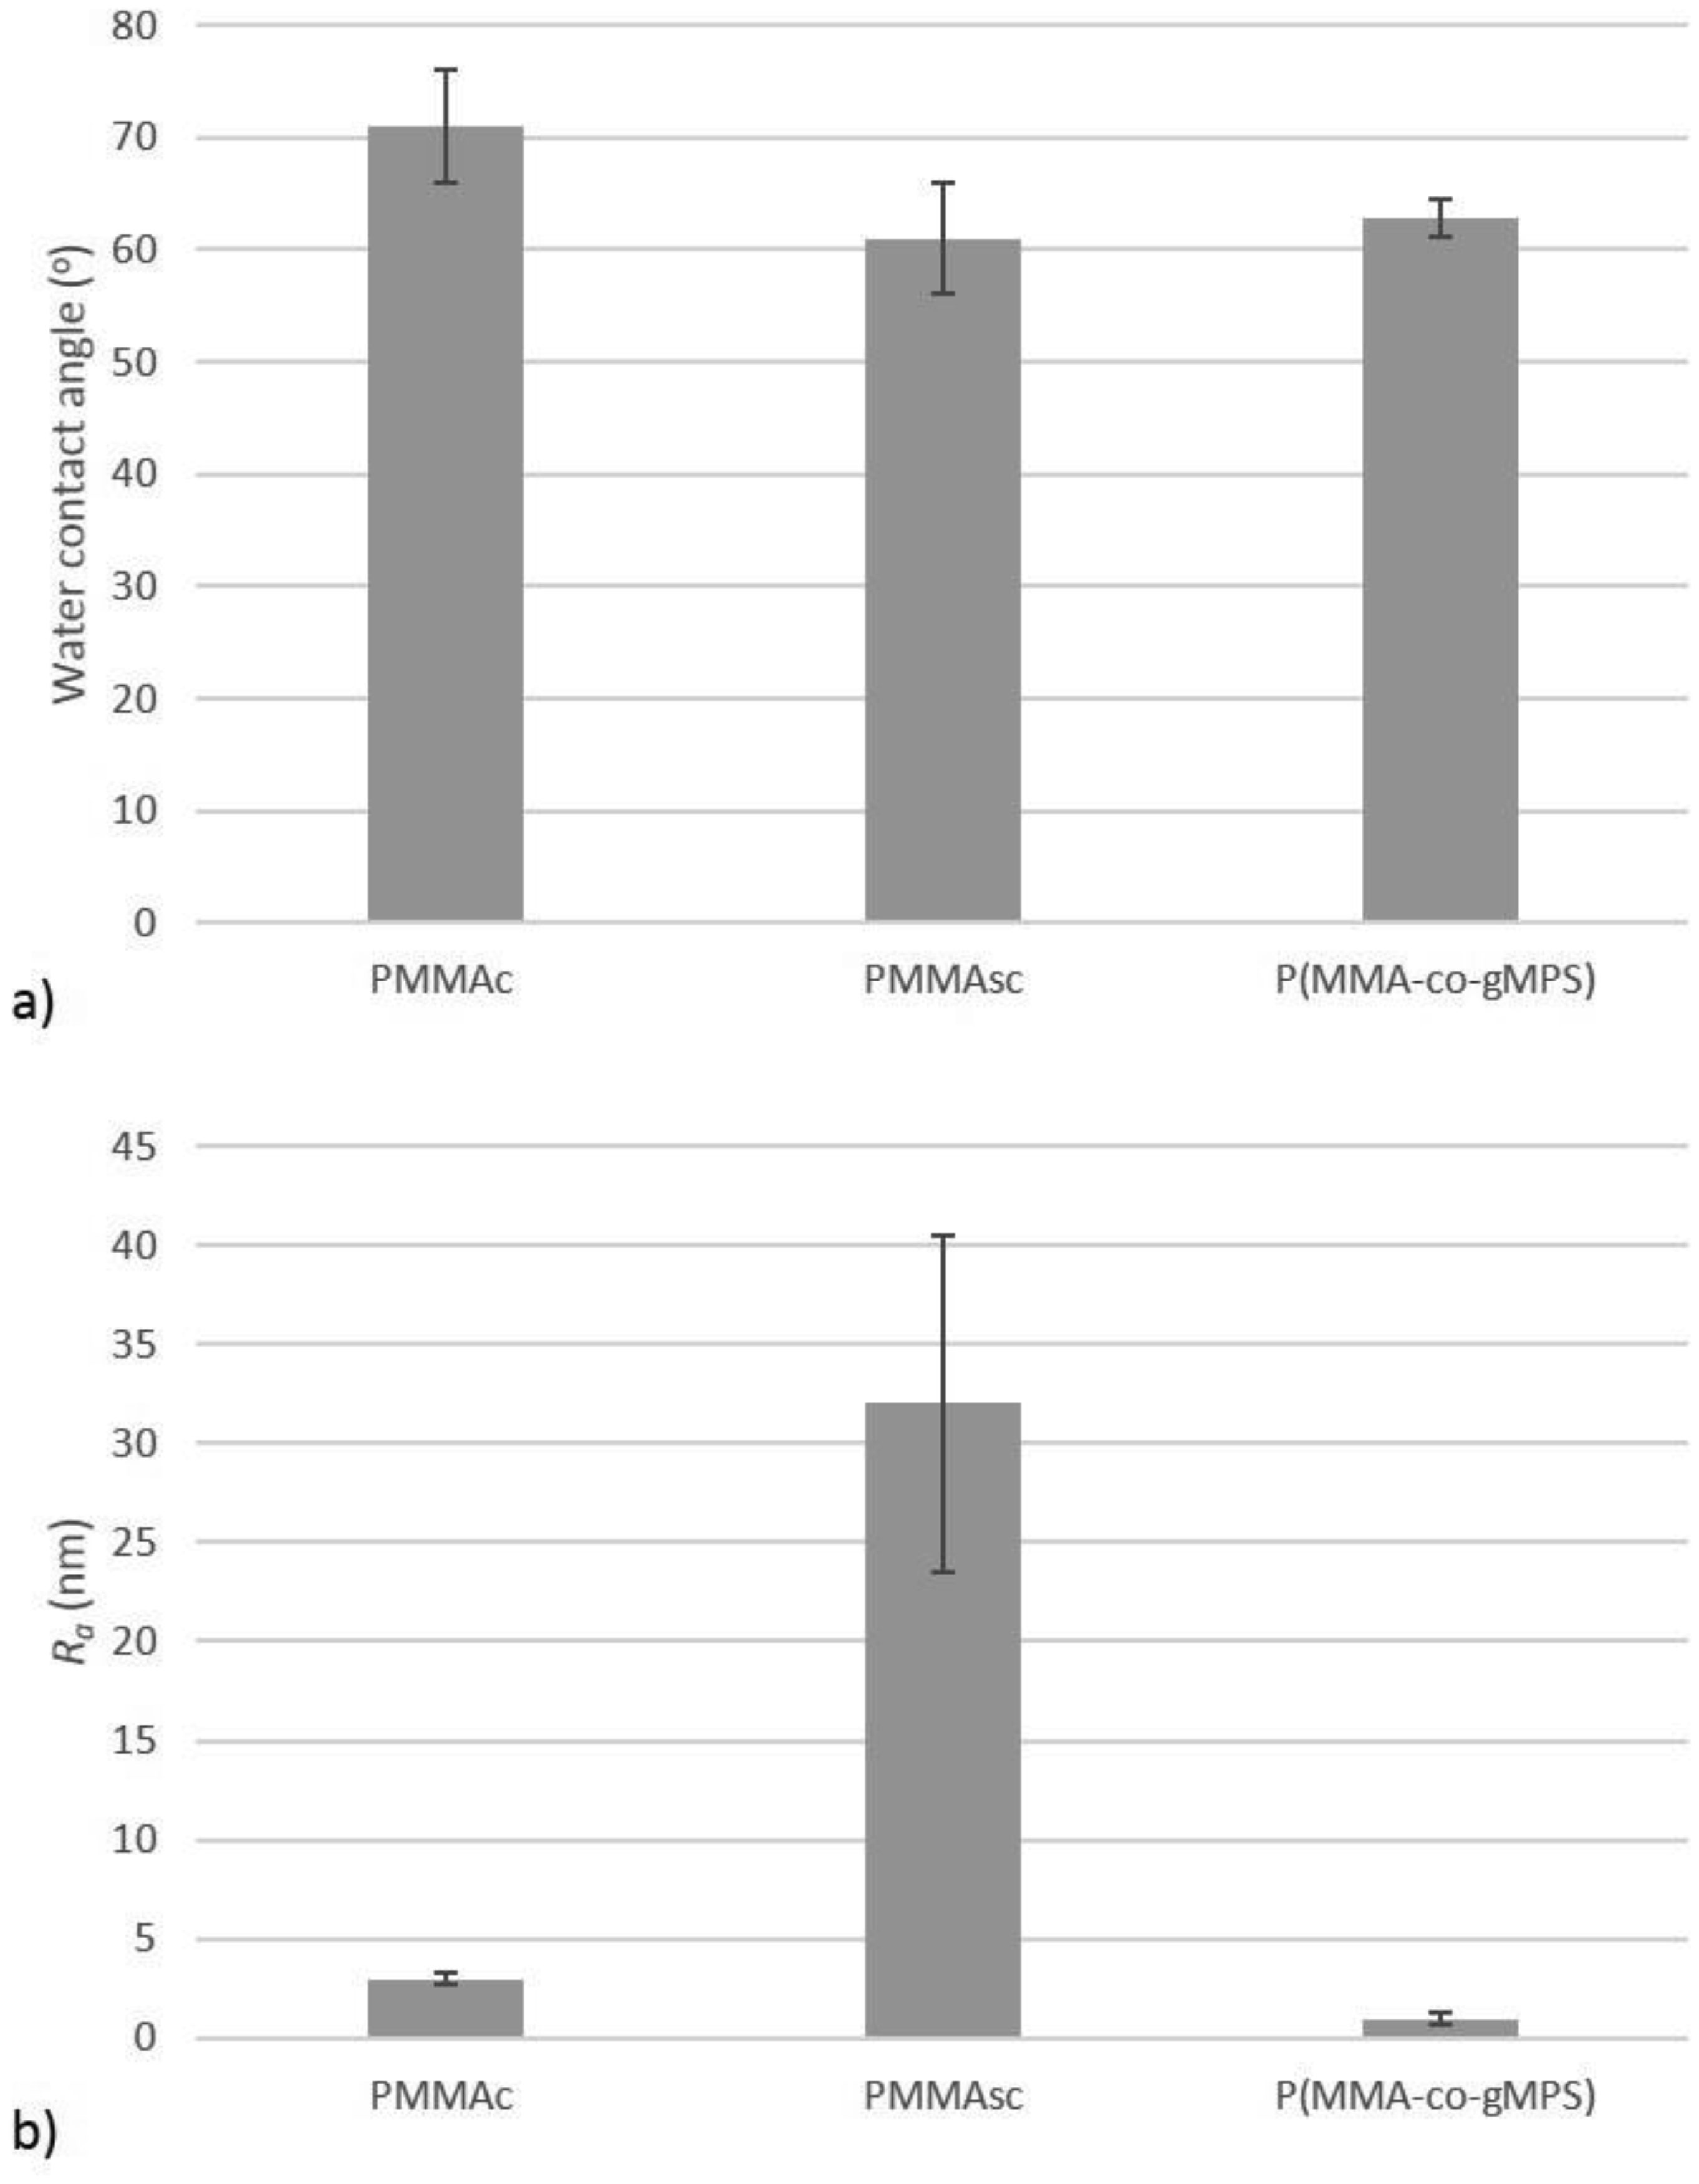
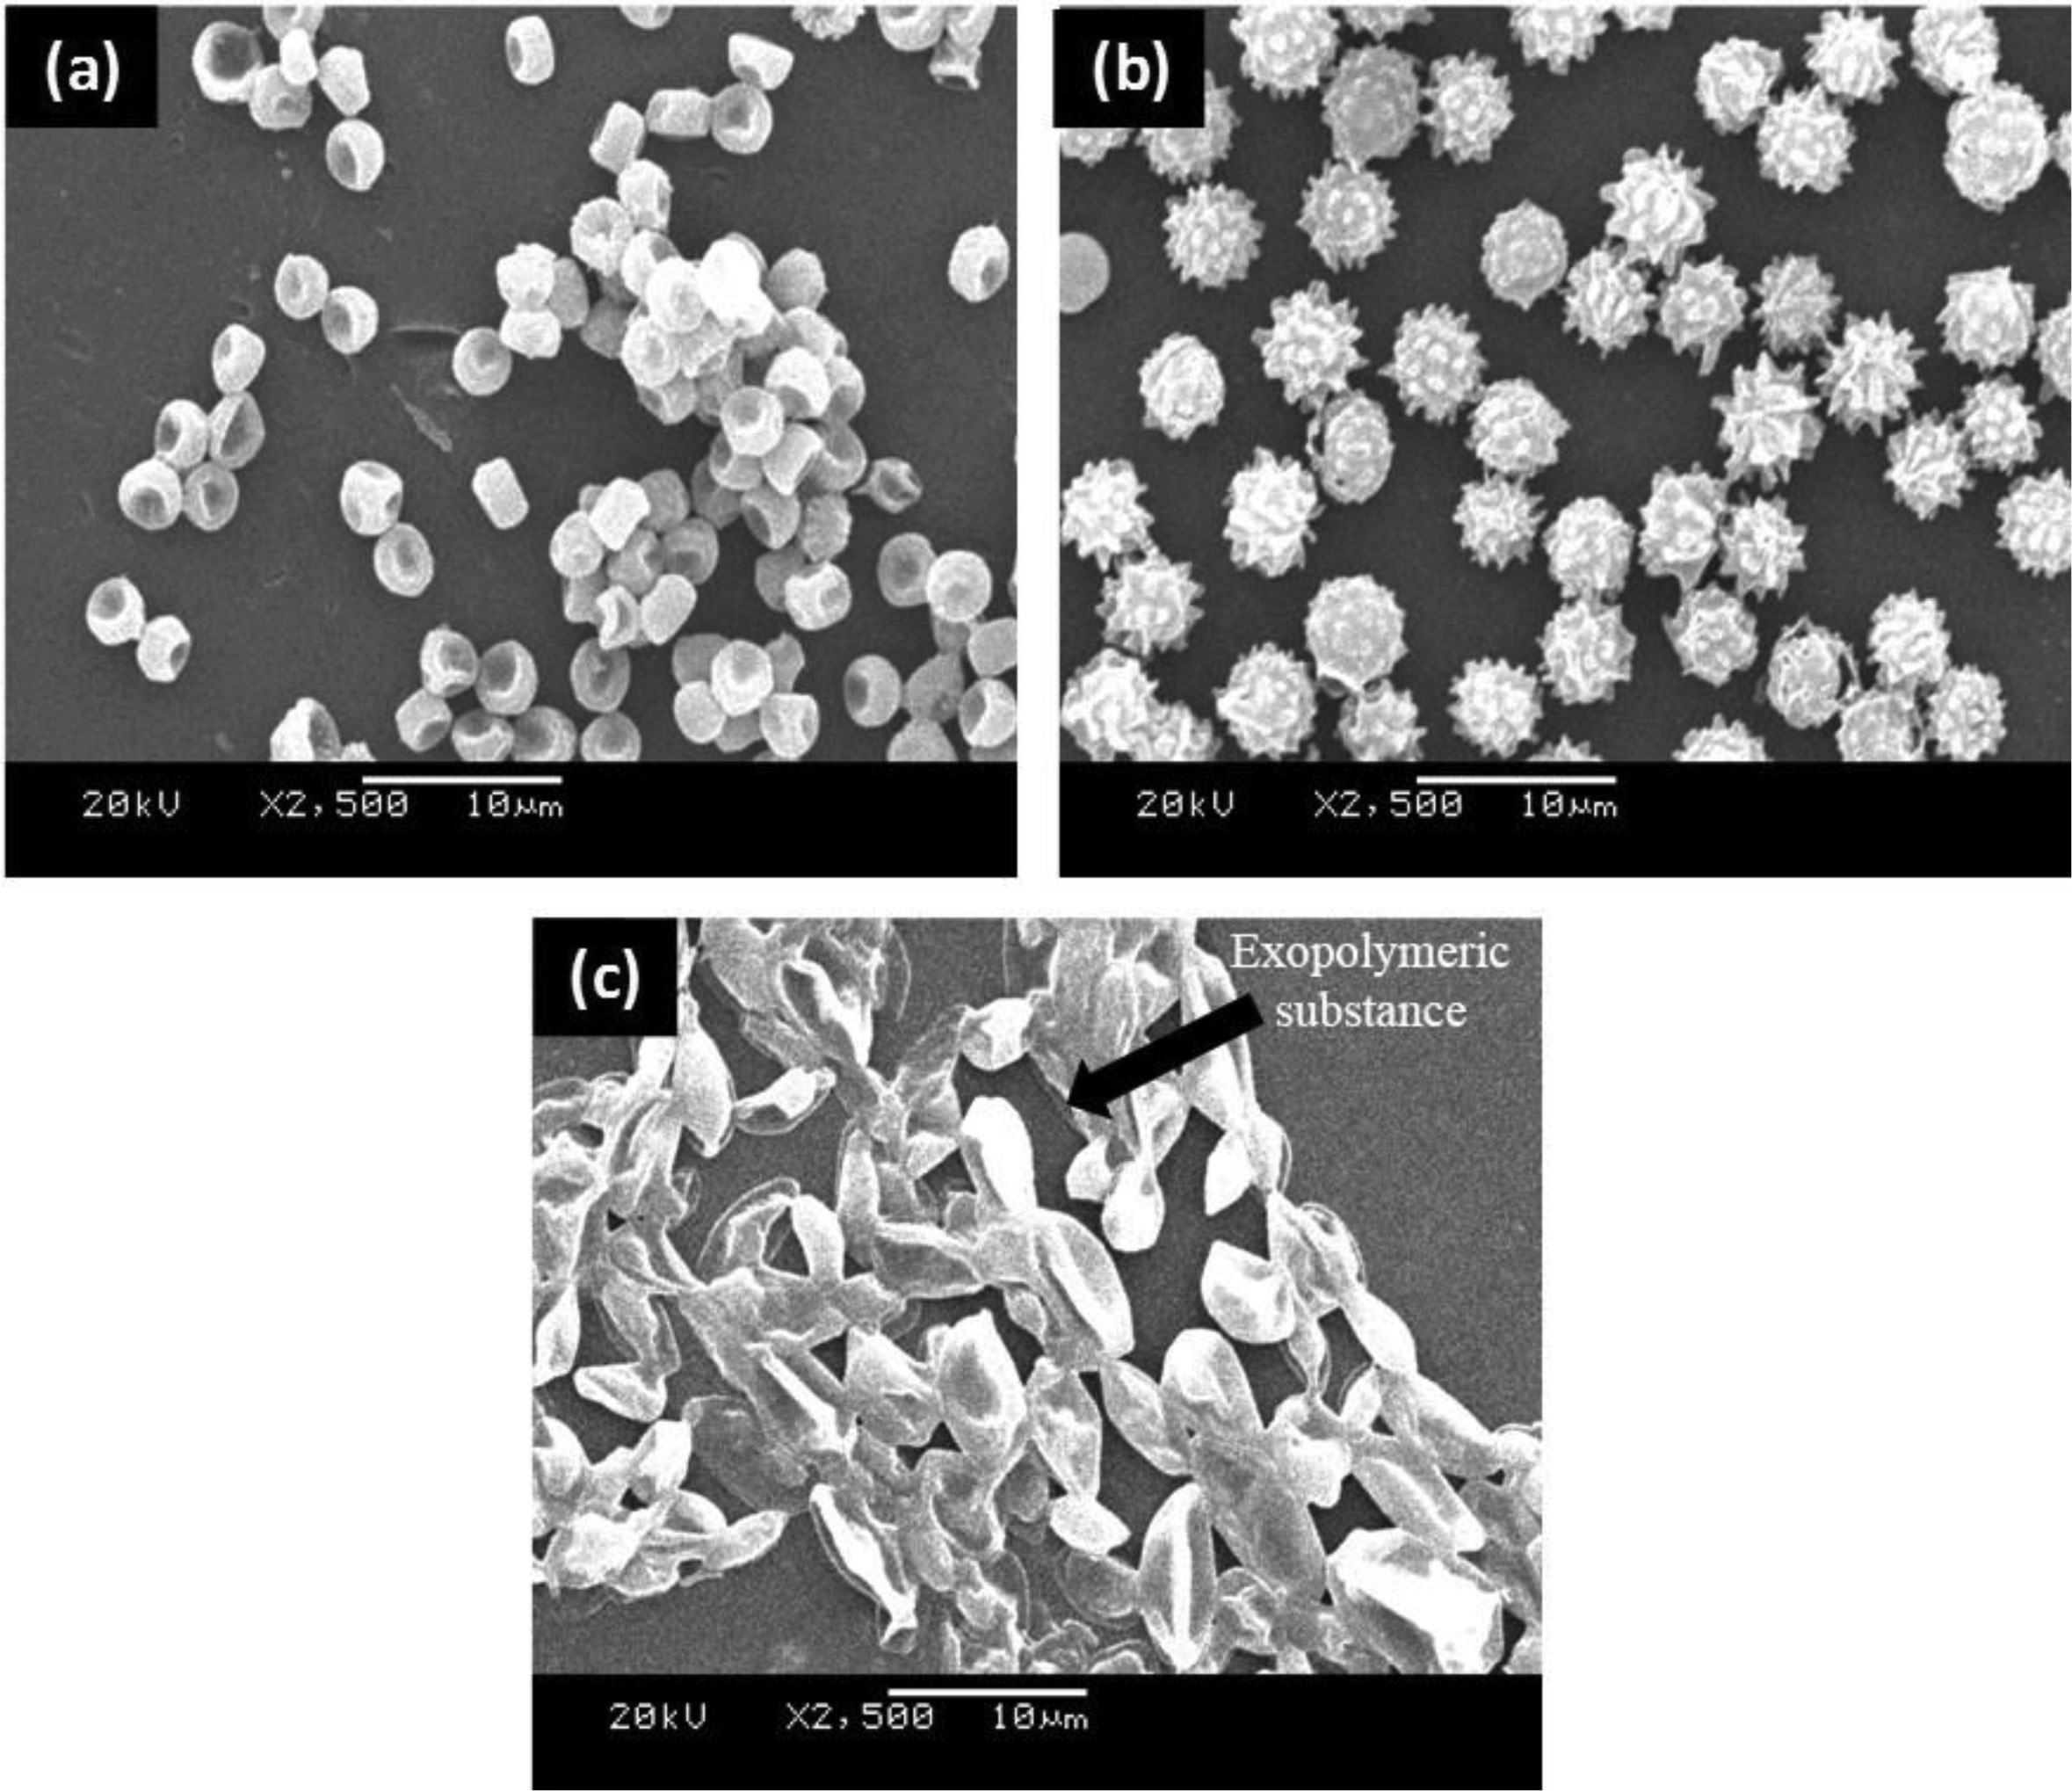
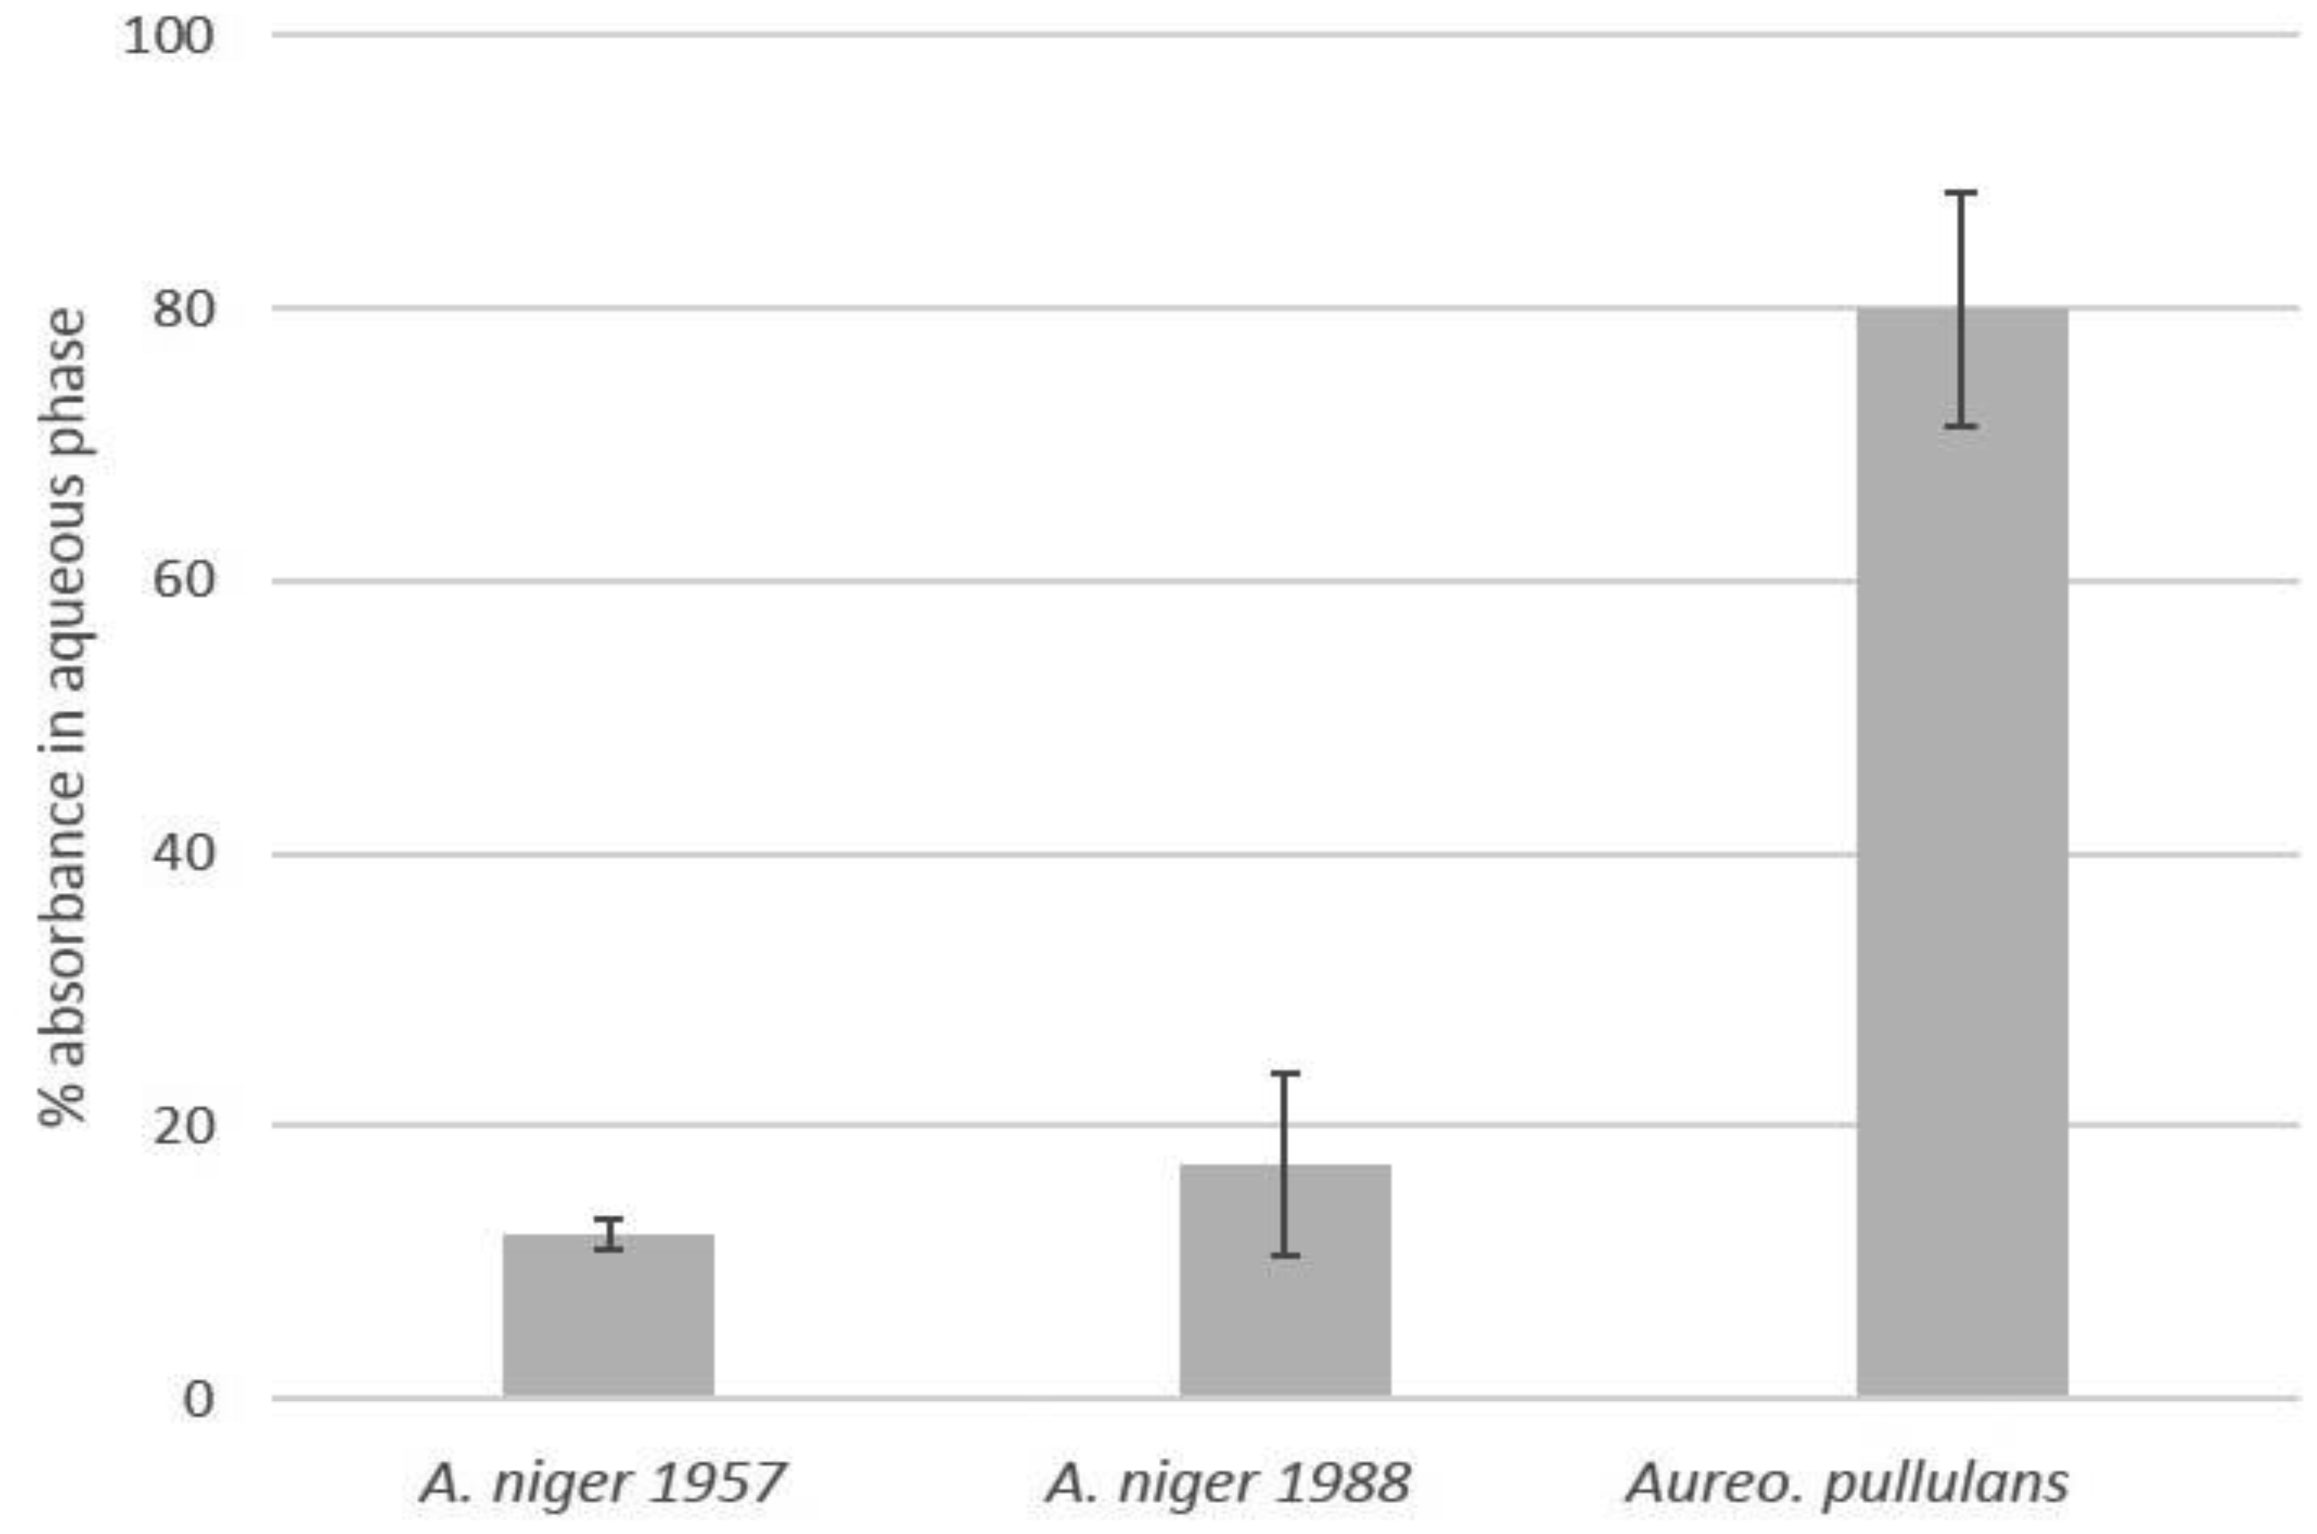
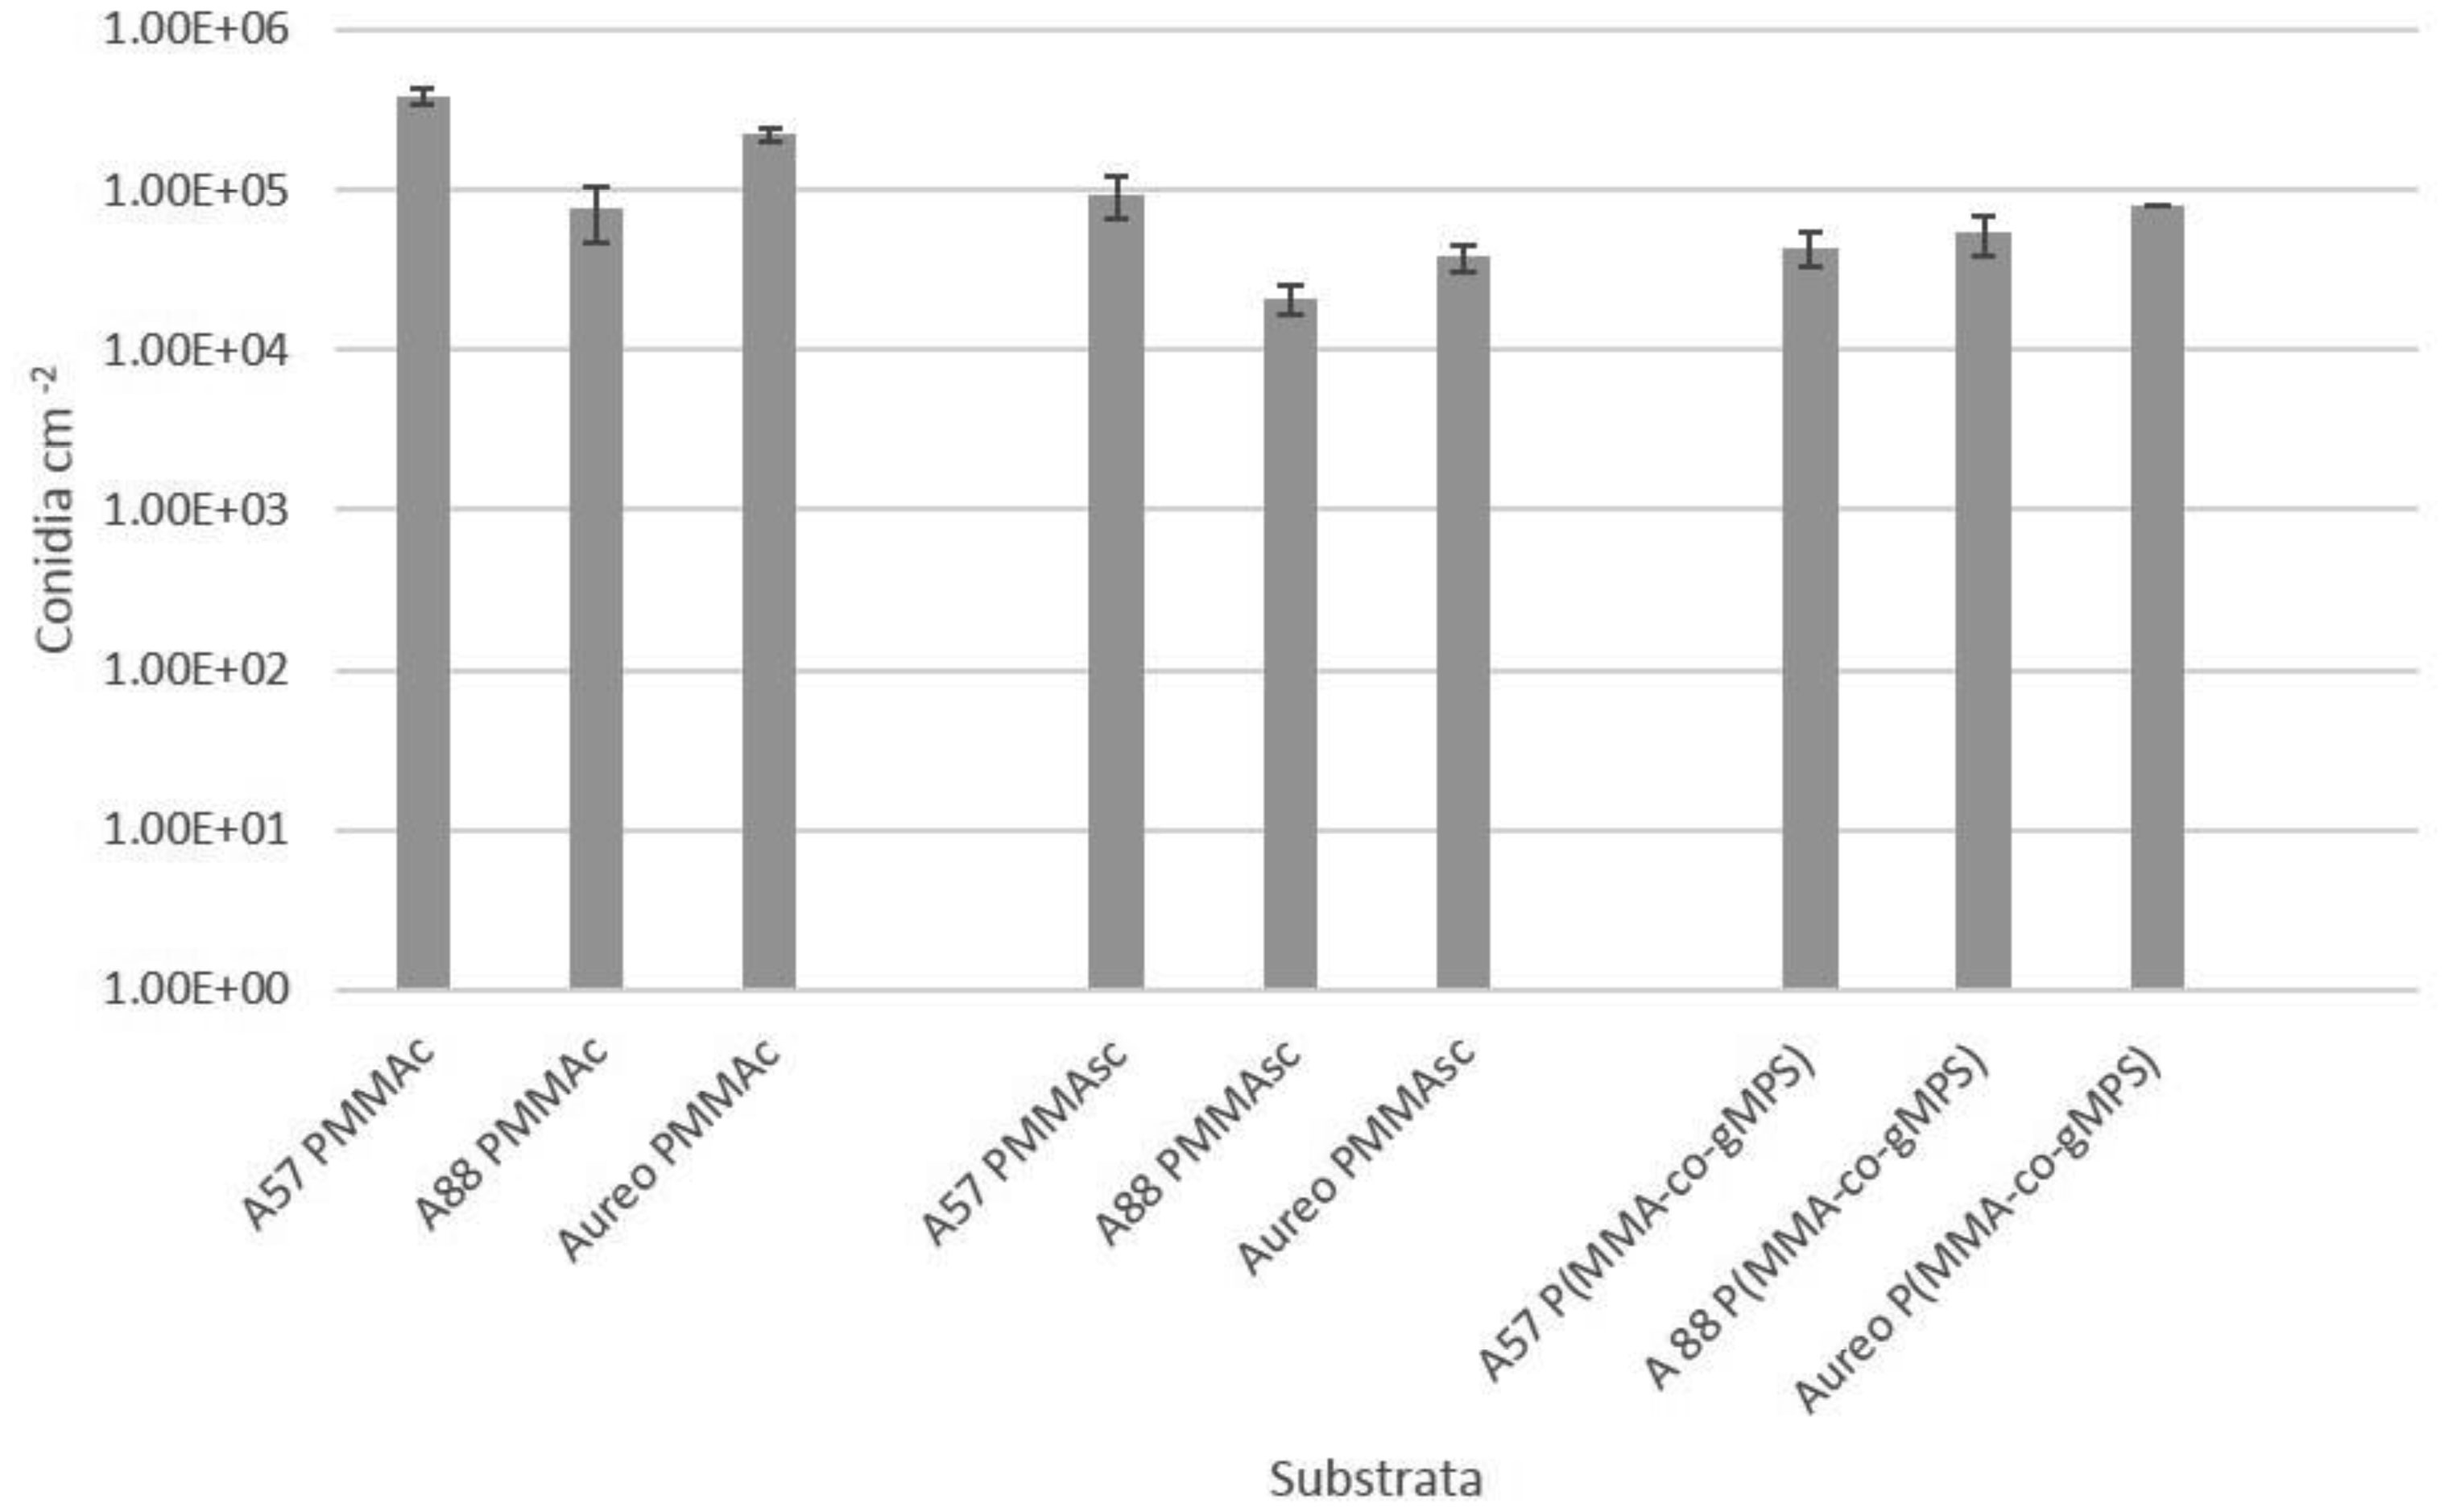
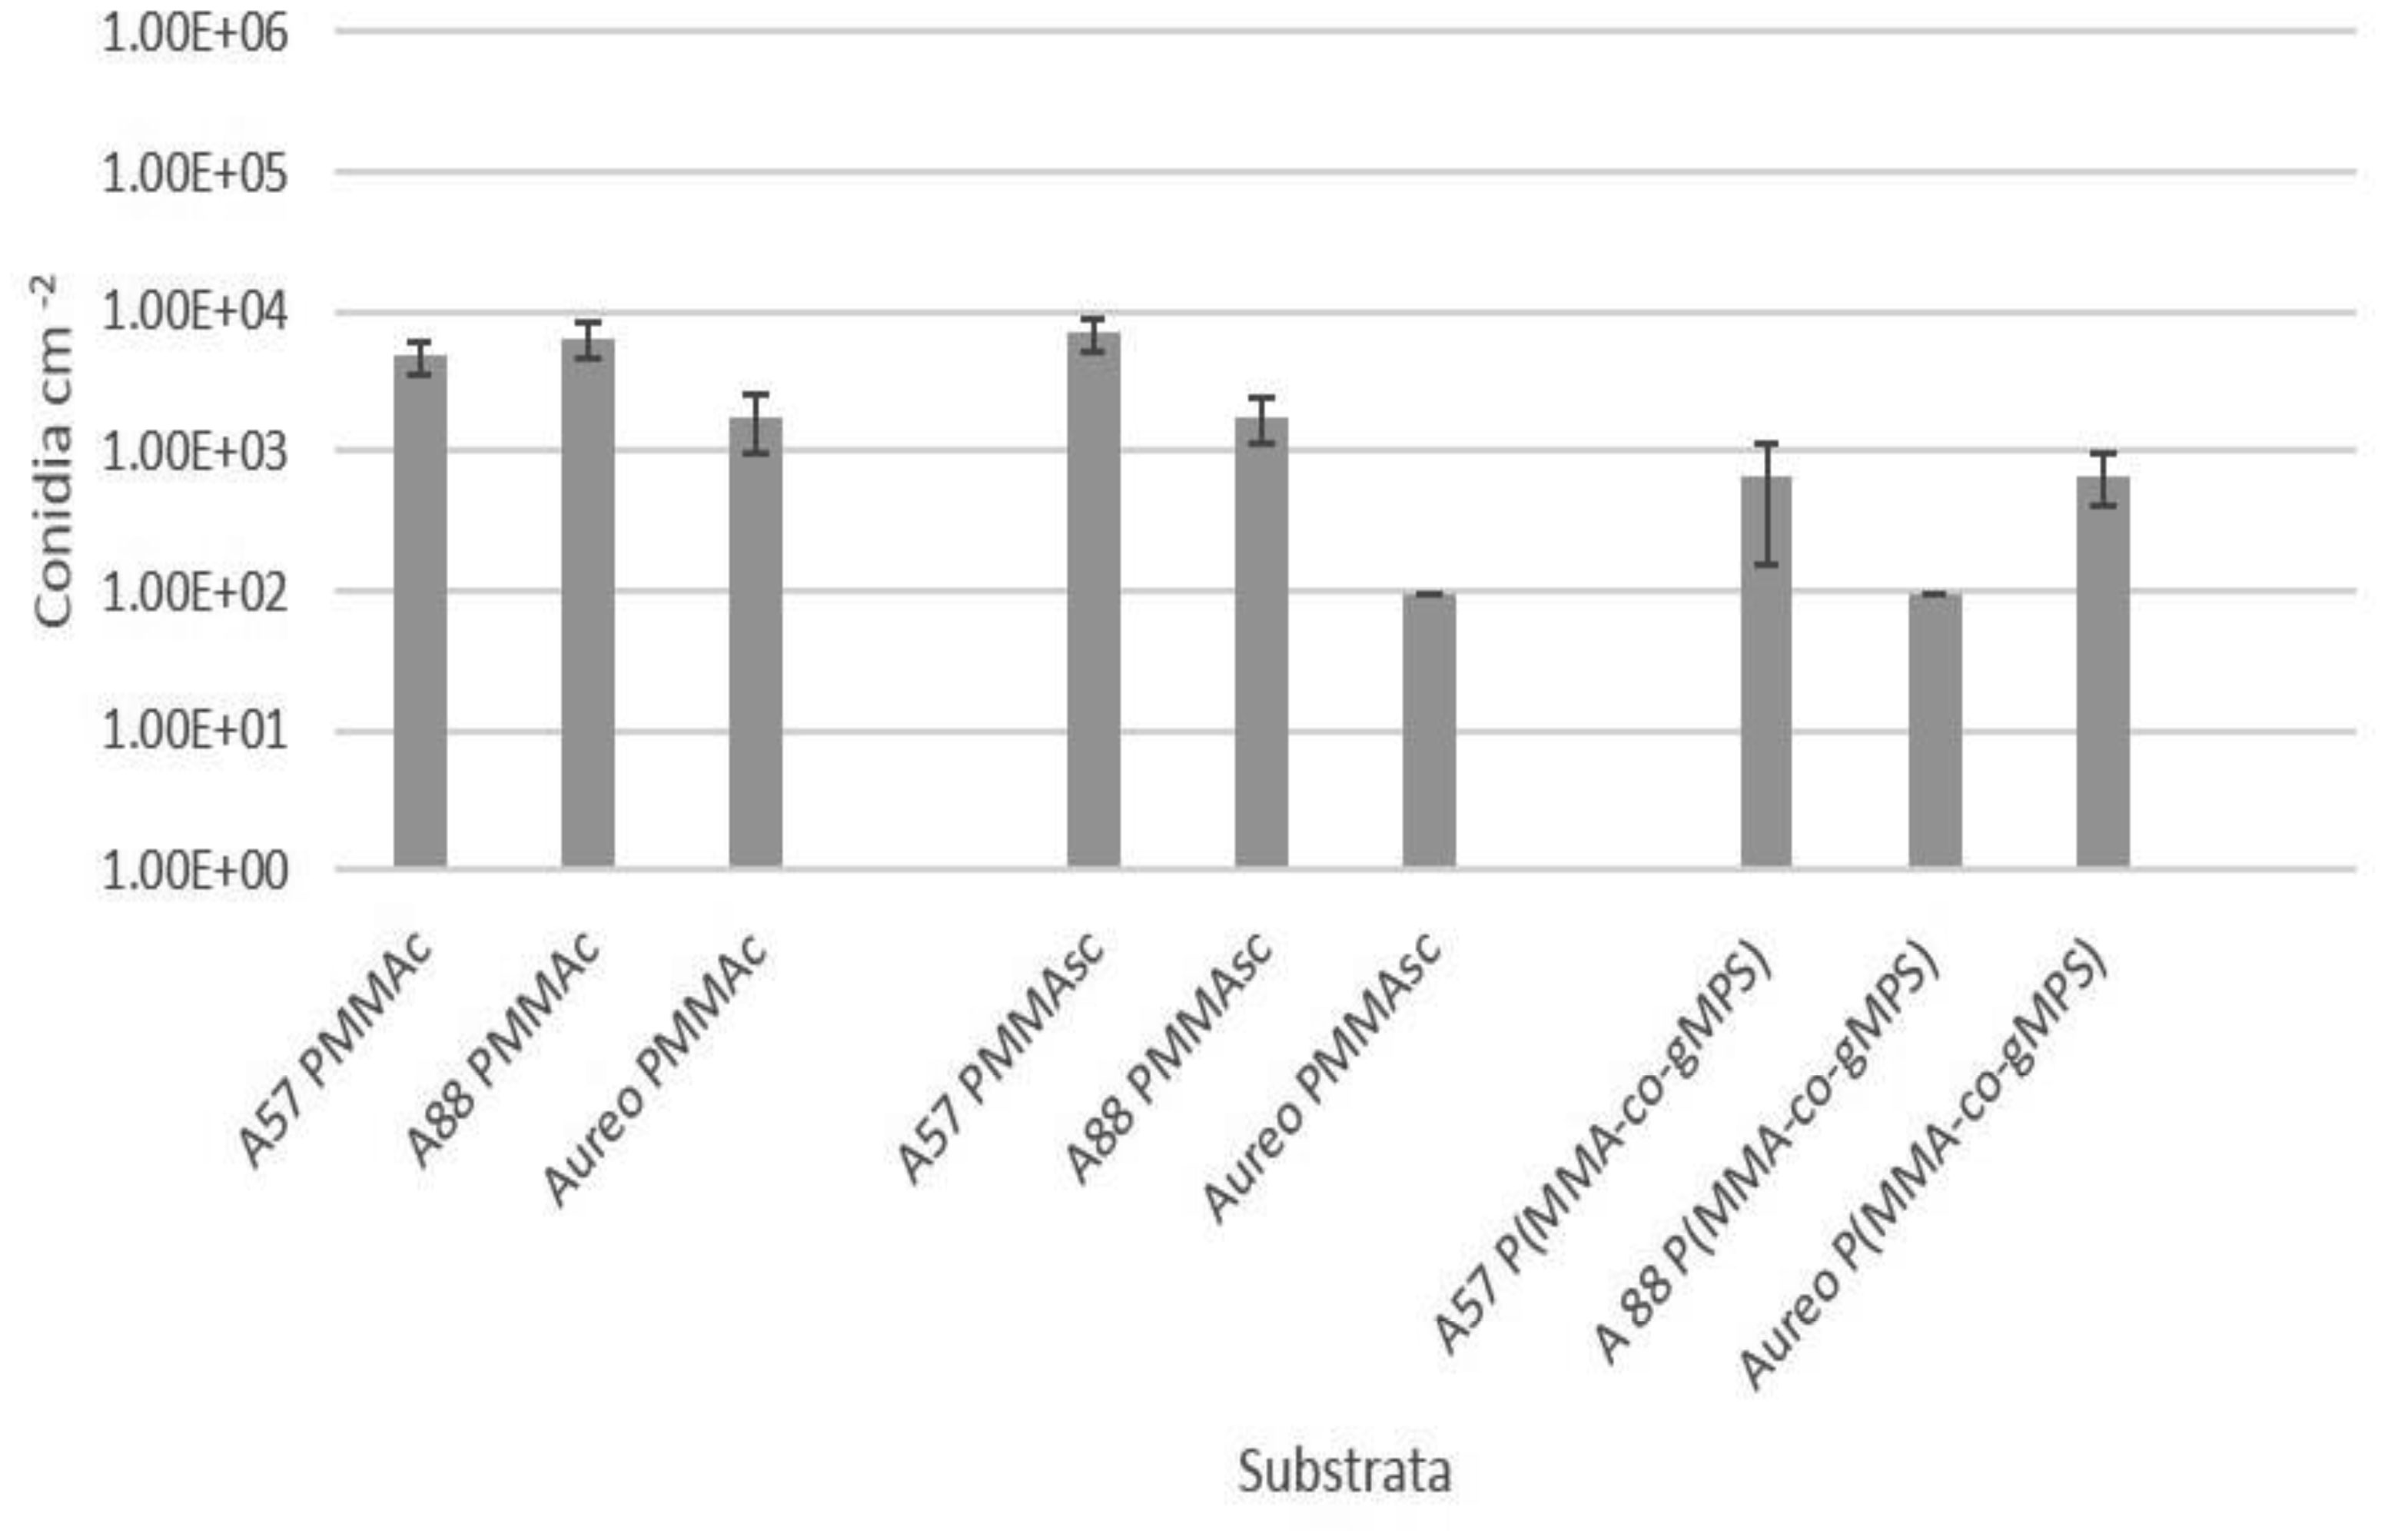
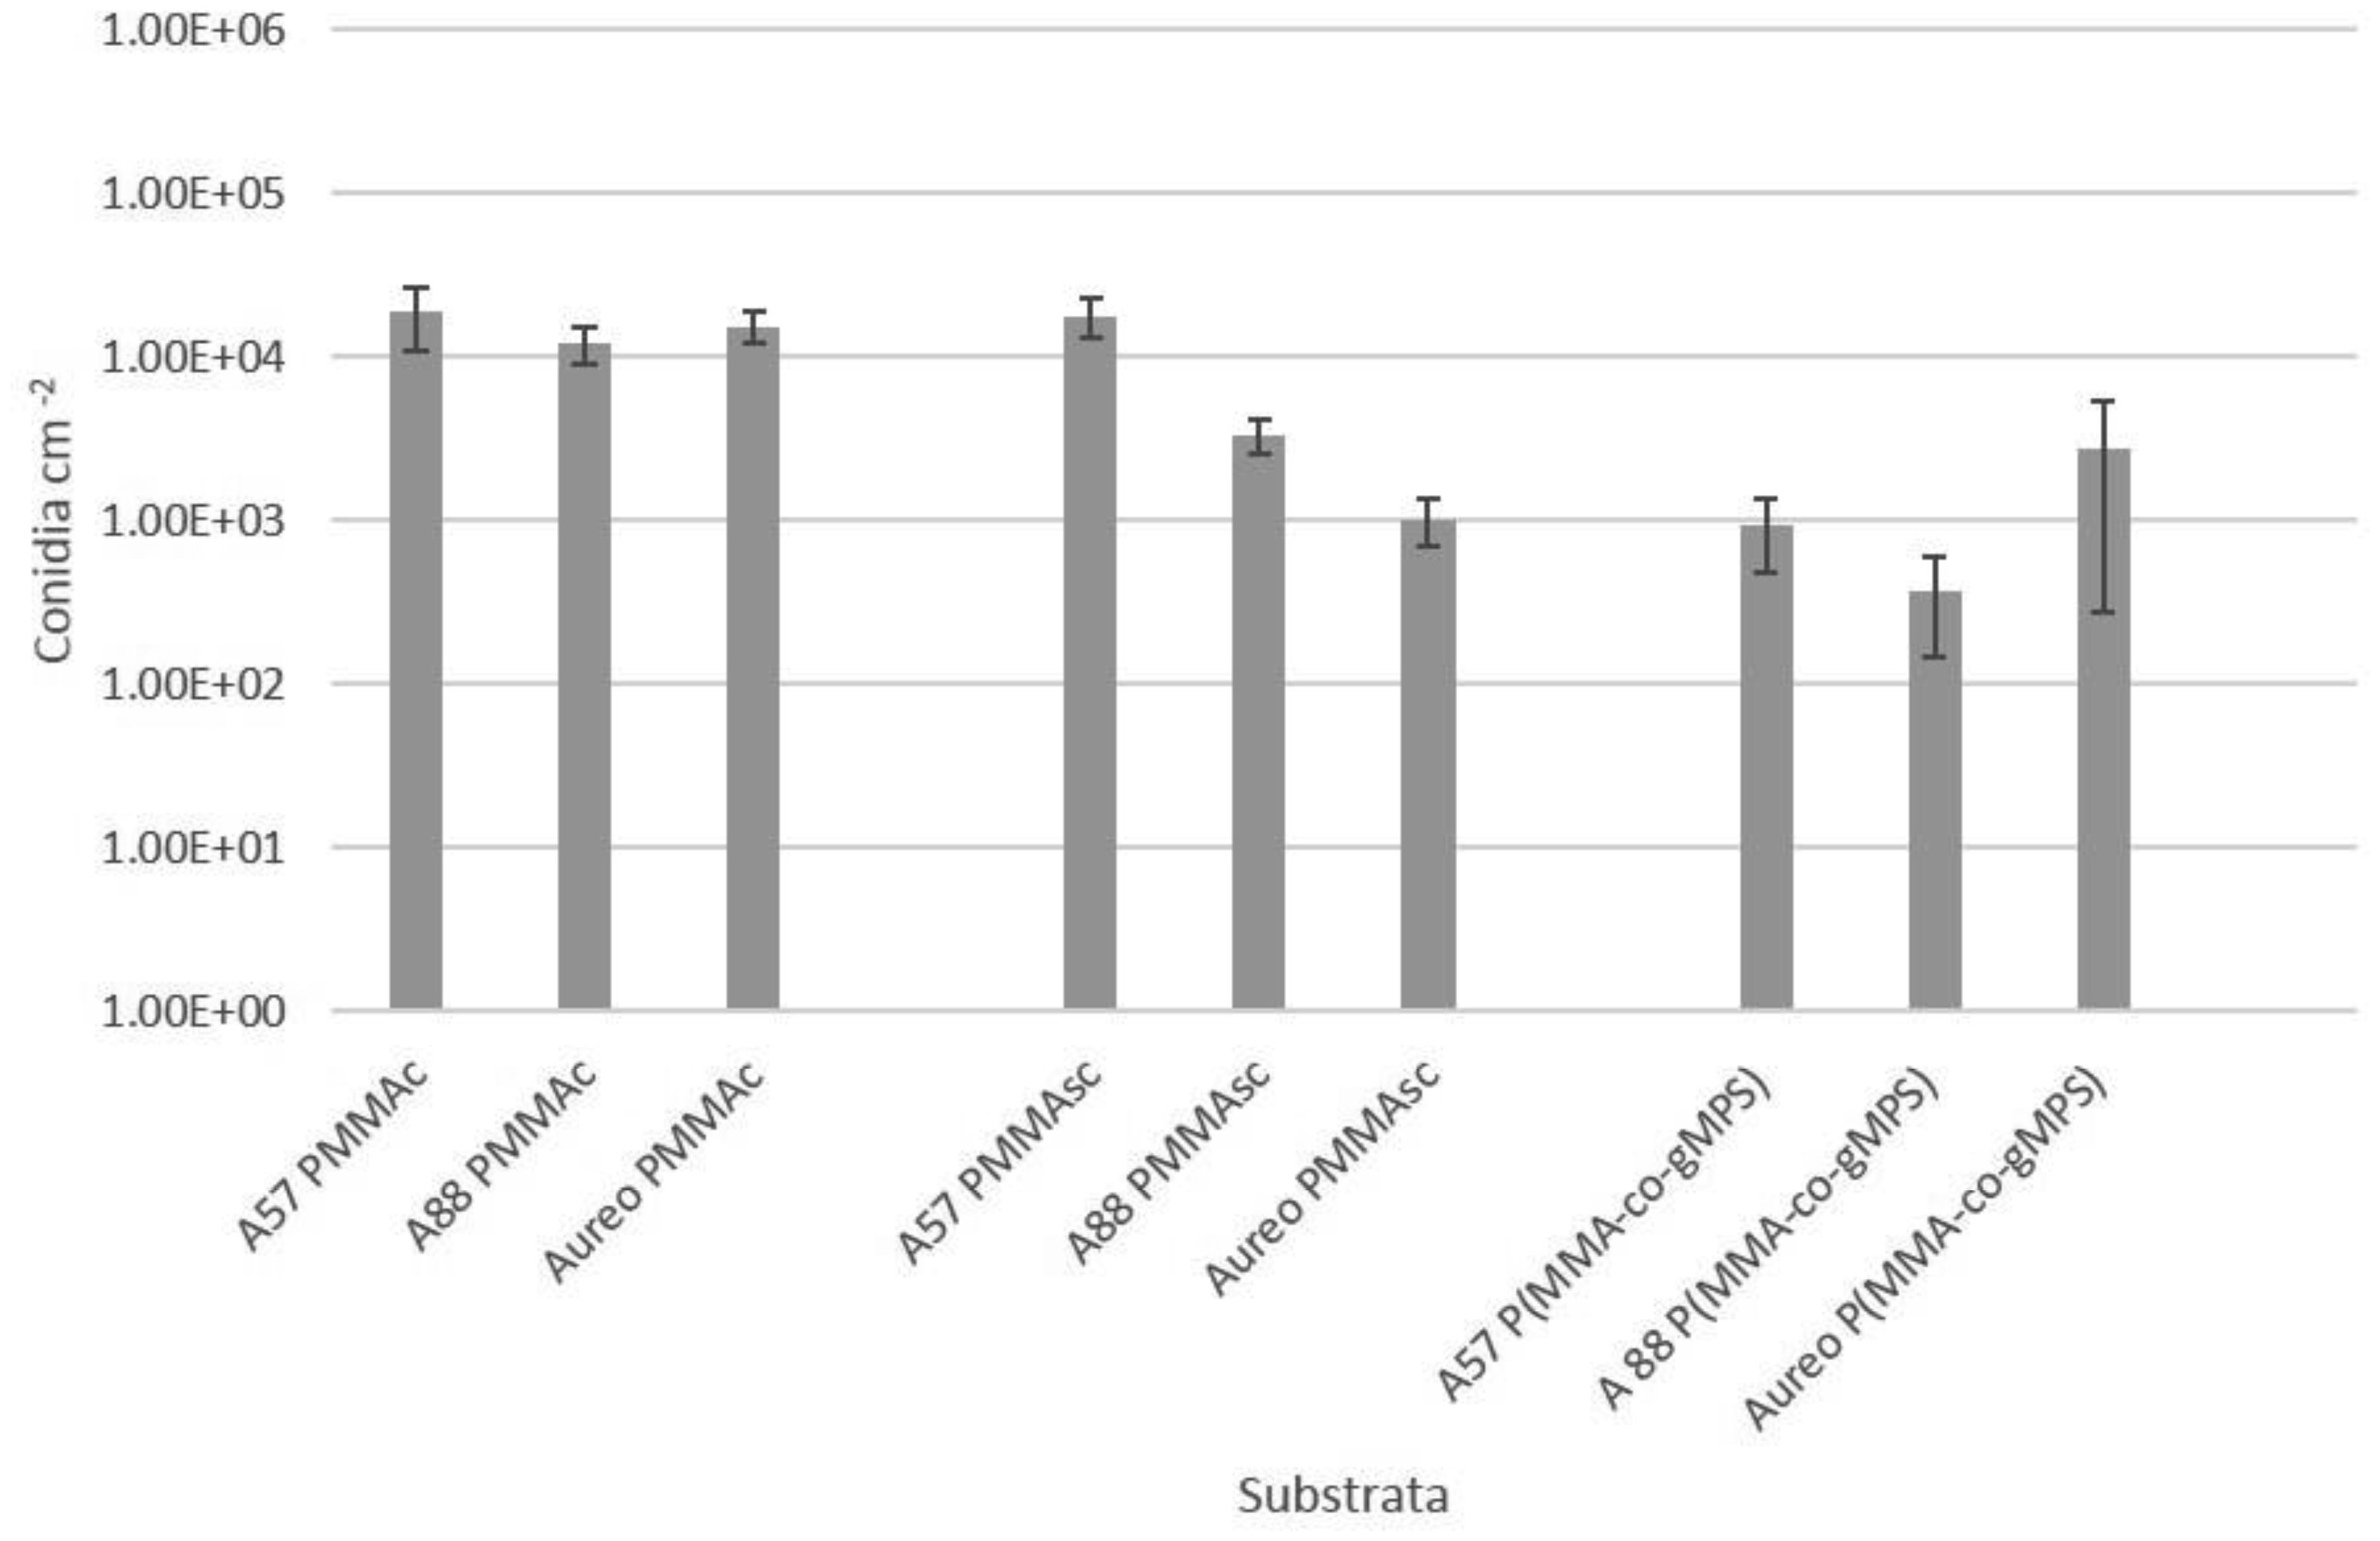
Poly(methyl methacrylate) (PMMA) surfaces, (commercial PMMA (PMMAc), spin coated PMMA (PMMAsc) and a 90% methylmethacrylate/10% 3-methacryloxypropyltrimethoxysilane random copolymer (P(MMA-co-gMPS)) were used to determine the effect of surface properties on conidia biofouling. The contact angles of the substrates demonstrated that the PMMAsc and the P(MMA-co-gMPS) polymer (62.8°) were more wettable than the PMMAc surface (71.0°). The PMMAsc had the greatest roughness value (32.0 nm) followed by the PMMAc (3.0 nm), then P(MMA-co-gMPS) (1 nm). Aspergillus niger 1957 conidia were spherical, smooth and hydrophobic (12.1%). Aspergillus niger 1988 conidia were spherical with spikes and hydrophobic (17.1%). Aureobasidium pullulans was elliptical with longitudinal ridges and hydrophilic (79.9%). Following attachment assays, cPMMA attached the greatest numbers of conidia. Following the adhesion and retention assays (washing step included in the protocol), A. niger 1957 and A. niger 1988 were least adhered to the P(MMA-co-gMPS) surface, whilst A. pulluans was least adhered to the PMMAsc surface. This work demonstrated that in the absence of a washing step, only the surface properties influenced the conidia attachment, whilst in the presence of a washing step, both the properties of the surfaces and the conidia affected conidia adhesion and retention. Hence, the methodology used (with or without a washing step) should reflect the environment in which the surface is to be applied.
Citation: Kathryn A. Whitehead, Christopher M. Liauw, Joels S. T. Wilson-Nieuwenhuis, Anthony J. Slate, Ted Deisenroth, Andrea Preuss, Joanna Verran. The effect of the surface properties of poly(methyl methacrylate) on the attachment, adhesion and retention of fungal conidia[J]. AIMS Bioengineering, 2020, 7(3): 165-178. doi: 10.3934/bioeng.2020015
Poly(methyl methacrylate) (PMMA) surfaces, (commercial PMMA (PMMAc), spin coated PMMA (PMMAsc) and a 90% methylmethacrylate/10% 3-methacryloxypropyltrimethoxysilane random copolymer (P(MMA-co-gMPS)) were used to determine the effect of surface properties on conidia biofouling. The contact angles of the substrates demonstrated that the PMMAsc and the P(MMA-co-gMPS) polymer (62.8°) were more wettable than the PMMAc surface (71.0°). The PMMAsc had the greatest roughness value (32.0 nm) followed by the PMMAc (3.0 nm), then P(MMA-co-gMPS) (1 nm). Aspergillus niger 1957 conidia were spherical, smooth and hydrophobic (12.1%). Aspergillus niger 1988 conidia were spherical with spikes and hydrophobic (17.1%). Aureobasidium pullulans was elliptical with longitudinal ridges and hydrophilic (79.9%). Following attachment assays, cPMMA attached the greatest numbers of conidia. Following the adhesion and retention assays (washing step included in the protocol), A. niger 1957 and A. niger 1988 were least adhered to the P(MMA-co-gMPS) surface, whilst A. pulluans was least adhered to the PMMAsc surface. This work demonstrated that in the absence of a washing step, only the surface properties influenced the conidia attachment, whilst in the presence of a washing step, both the properties of the surfaces and the conidia affected conidia adhesion and retention. Hence, the methodology used (with or without a washing step) should reflect the environment in which the surface is to be applied.

| [1] | Pawar E (2016) A review article on acrylic PMMA. IOSR J Mech Civil Eng 13: 1-4. |
| [2] |
Ali U, Karim KJBA, Buang NA (2015) A review of the properties and applications of poly (methyl methacrylate) (PMMA). Polymer Rev 55: 678-705. doi: 10.1080/15583724.2015.1031377

|
| [3] |
John MJ (2017) Environmental degradation in biocomposites. Biocomposites for High-Performance Applications. Current Barriers and Future Needs Towards Industrial Development Woodhead Publishing, 181-194. doi: 10.1016/B978-0-08-100793-8.00007-7
|
| [4] |
Bell GM, Chadwick J (1994) Regulatory controls on biocides in the United Kingdom and restrictions on the use of triorganotin-containing antifouling products. Int Biodeter Biodegr 34: 375-386. doi: 10.1016/0964-8305(94)90095-7
|
| [5] |
Rajab FH, Liauw CM, Benson PS, et al. (2018) Picosecond laser treatment production of hierarchical structured stainless steel to reduce bacterial fouling. Food Bioprod Process 109: 29-40. doi: 10.1016/j.fbp.2018.02.009
|
| [6] |
Chaky J, Anderson K, Moss M, et al. (2001) Surface hydrophobicity and surface rigidity induce spore germination in Colletotrichum graminicola. Phytopathology 91: 558-564. doi: 10.1094/PHYTO.2001.91.6.558
|
| [7] |
Cappitelli F, Sorlini C (2008) Microorganisms attack synthetic polymers in items representing our cultural heritage. Appl Environ Microbiol 74: 564-569. doi: 10.1128/AEM.01768-07
|
| [8] |
Whitehead KA, Colligon J, Verran J (2005) Retention of microbial cells in substratum surface features of micrometer and sub-micrometer dimensions. Coll Surf B: Biointerfaces 41: 129-138. doi: 10.1016/j.colsurfb.2004.11.010
|
| [9] |
Ma H, Winslow CJ, Logan BE (2008) Spectral force analysis using atomic force microscopy reveals the importance of surface heterogeneity in bacterial and colloid adhesion to engineered surfaces. Coll Surf B: Biointerfaces 62: 232-237. doi: 10.1016/j.colsurfb.2007.10.007
|
| [10] |
Whitehead KA, Deisenroth T, Preuss A, et al. (2011) The effect of surface properties on the strength of attachment of fungal spores using AFM perpendicular force measurements. Coll Surf B: Biointerfaces 82: 483-489. doi: 10.1016/j.colsurfb.2010.10.001
|
| [11] |
Kipanga PN, Luyten W (2017) Influence of serum and polystyrene plate type on stability of Candida albicans biofilms. J Microbiol Meth 139: 8-11. doi: 10.1016/j.mimet.2017.04.006
|
| [12] |
Bigerelle M, Anselme K, Dufresne E, et al. (2002) An unscaled parameter to measure the order of surfaces: a new surface elaboration to increase cells adhesion. Biomol Eng 19: 79-83. doi: 10.1016/S1389-0344(02)00048-5
|
| [13] |
Beauvais A, Schmidt C, Guadagnini S, et al. (2007) An extracellular matrix glues together the aerial-grown hyphae of Aspergillus fumigatus. Cell Microbiol 9: 1588-1600. doi: 10.1111/j.1462-5822.2007.00895.x
|
| [14] |
Ramage G, Rajendran R, Gutierrez-Correa M, et al. (2011) Aspergillus biofilms: clinical and industrial significance. FEMS Microbiol Lett 324: 89-97. doi: 10.1111/j.1574-6968.2011.02381.x
|
| [15] |
Marques-Calvo MS (2002) In vitro colonization of hydrophilic contact lenses by Aspergillus niger. J Ind Microbiol Biotech 29: 6-9. doi: 10.1038/sj.jim.7000255
|
| [16] |
Filler SG, Sheppard DC (2006) Fungal invasion of normally non-phagocytic host cells. PLOS Pathog 2: e129. doi: 10.1371/journal.ppat.0020129
|
| [17] |
Gostinčar C, Ohm RA, Kogej T, et al. (2014) Genome sequencing of four Aureobasidium pullulans varieties: biotechnological potential, stress tolerance, and description of new species. BMC Genomics 15: 549. doi: 10.1186/1471-2164-15-549
|
| [18] | Lotrakul P, Deenarn P, Prasongsuk S, et al. (2009) Isolation of Aureobasidium pullulans from bathroom surfaces and their antifungal activity against some Aspergilli. Afr J Microbiol Res 3: 253-257. |
| [19] |
Zalar P, Novak M, De Hoog GS, et al. (2011) Dishwashers—a man-made ecological niche accommodating human opportunistic fungal pathogens. Fungal Biol 115: 997-1007. doi: 10.1016/j.funbio.2011.04.007
|
| [20] |
Arvanitidou M, Kanellou K, Constantinides TC, et al. (1999) The occurrence of fungi in hospital and community potable waters. Lett Appl Microbiol 29: 81-84. doi: 10.1046/j.1365-2672.1999.00583.x
|
| [21] |
Shah AA, Hasan F, Hameed A, et al. (2008) Biological degradation of plastics: a comprehensive review. Biotech Adv 26: 246-265. doi: 10.1016/j.biotechadv.2007.12.005
|
| [22] |
Stuart MAC, Huck WTS, Genzer J, et al. (2010) Emerging applications of stimuli-responsive polymer materials. Nat Mat 9: 101-113. doi: 10.1038/nmat2614
|
| [23] |
Rosenberg M, Kjellerberg S (1986) Hydrophobic interactions: role in bacterial adhesion. Advances in Microbial Ecology Boston: Springer, 353-393. doi: 10.1007/978-1-4757-0611-6_8
|
| [24] |
Rezaei F, Abbasi-Firouzjah M, Shokri B (2014) Investigation of antibacterial and wettability behaviours of plasma-modified PMMA films for application in ophthalmology. J Phys D: Appl Phys 47: 085401. doi: 10.1088/0022-3727/47/8/085401
|
| [25] |
Sabia R, Stevens HJ, Varner JR (1999) Pitting of a glass-ceramic during polishing with cerium oxide. J Non-Cryst Solids 249: 123-130. doi: 10.1016/S0022-3093(99)00316-6
|
| [26] |
Söz CK, Yilgör E, Yilgör I (2015) Influence of the average surface roughness on the formation of superhydrophobic polymer surfaces through spin-coating with hydrophobic fumed silica. Polymer 62: 118-128. doi: 10.1016/j.polymer.2015.02.032
|
| [27] |
Nomura T, Minamiura M, Fukamachi K, et al. (2018) Adhesion control of fungal spores on solid surfaces using hydrophilic nanoparticles. Adv Powder Technol 29: 909-914. doi: 10.1016/j.apt.2018.01.007
|
| [28] |
Kuo KC, Hoch HC (1996) Germination of Phyllosticta ampelicida Pycnidiospores: Prerequisite of adhesion to the substratum and the relationship of substratum wettability. Fungal Genet Biol 20: 18-29. doi: 10.1006/fgbi.1996.0005
|
| [29] |
Hamer JE, Howard RJ, Chumley FG, et al. (1988) A mechanism for surface attachment in spores of a plant pathogenic fungus. Science 239: 288-290. doi: 10.1126/science.239.4837.288
|
| [30] |
Amiri A, Cholodowski D, Bompeix G (2005) Adhesion and germination of waterborne and airborne conidia of Penicillium expansum to apple and inert surfaces. Phys Mol Plant Pathol 67: 40-48. doi: 10.1016/j.pmpp.2005.07.003
|
| [31] |
Sammonds J, Jaspers MV, Jones EE (2016) Pre-infection processes of Botryosphaeriaceae spp.: adhesion of conidia to different substrata. Plant Pathol 65: 1142-1152. doi: 10.1111/ppa.12485
|
| [32] |
Faille C, Jullien C, Fontaine F, et al. (2002) Adhesion of Bacillus spores and Escherichia coli cells to inert surfaces: role of surface hydrophobicity. Can J Microbiol 48: 728-738. doi: 10.1139/w02-063
|
| [33] |
Foschino R, Picozzi C, Civardi A, et al. (2003) Comparison of surface sampling methods and cleanability assessment of stainless steel surfaces subjected or not to shot peening. J Food Eng 60: 375-381. doi: 10.1016/S0260-8774(03)00060-8
|
| [34] |
Luke B, Faull J, Bateman R (2015) Using particle size analysis to determine the hydrophobicity and suspension of fungal conidia with particular relevance to formulation of biopesticide. Biocontrol Sci Technol 25: 383-398. doi: 10.1080/09583157.2014.979396
|
| [35] |
Klis FM, Ram AFJ, De Groot PWJ (2007) A molecular and genomic view of the fungal cell wall. Biology of the fungal cell Heidelberg: Springer, 97-120. doi: 10.1007/978-3-540-70618-2_4
|
| [36] |
Temple MJ, Cuskin F, Baslé A, et al. (2017) A Bacteroidetes locus dedicated to fungal 1, 6-β-glucan degradation: unique substrate conformation drives specificity of the key endo-1, 6-β-glucanase. J Biol Chem 292: 10639-10650. doi: 10.1074/jbc.M117.787606
|
| [37] | Rekha MR, Sharma CP (2007) Pullulan as a promising biomaterial for biomedical applications: a perspective. Trends Biomater Artif Organs 20: 116-121. |
| [38] |
Prashantha KVH, Lakshmanb K, Shamalab TR, et al. (2005) Biodegradation of chitosan-graft-polymethylmethacrylate films. Int Biodeter Biodegr 56: 115-120. doi: 10.1016/j.ibiod.2005.06.007
|
Figures(6)

Kathryn A. Whitehead, Christopher M. Liauw, Joels S. T. Wilson-Nieuwenhuis, Anthony J. Slate, Ted Deisenroth, Andrea Preuss, Joanna Verran. The effect of the surface properties of poly(methyl methacrylate) on the attachment, adhesion and retention of fungal conidia[J]. AIMS Bioengineering, 2020, 7(3): 165-178. doi: 10.3934/bioeng.2020015


 DownLoad: