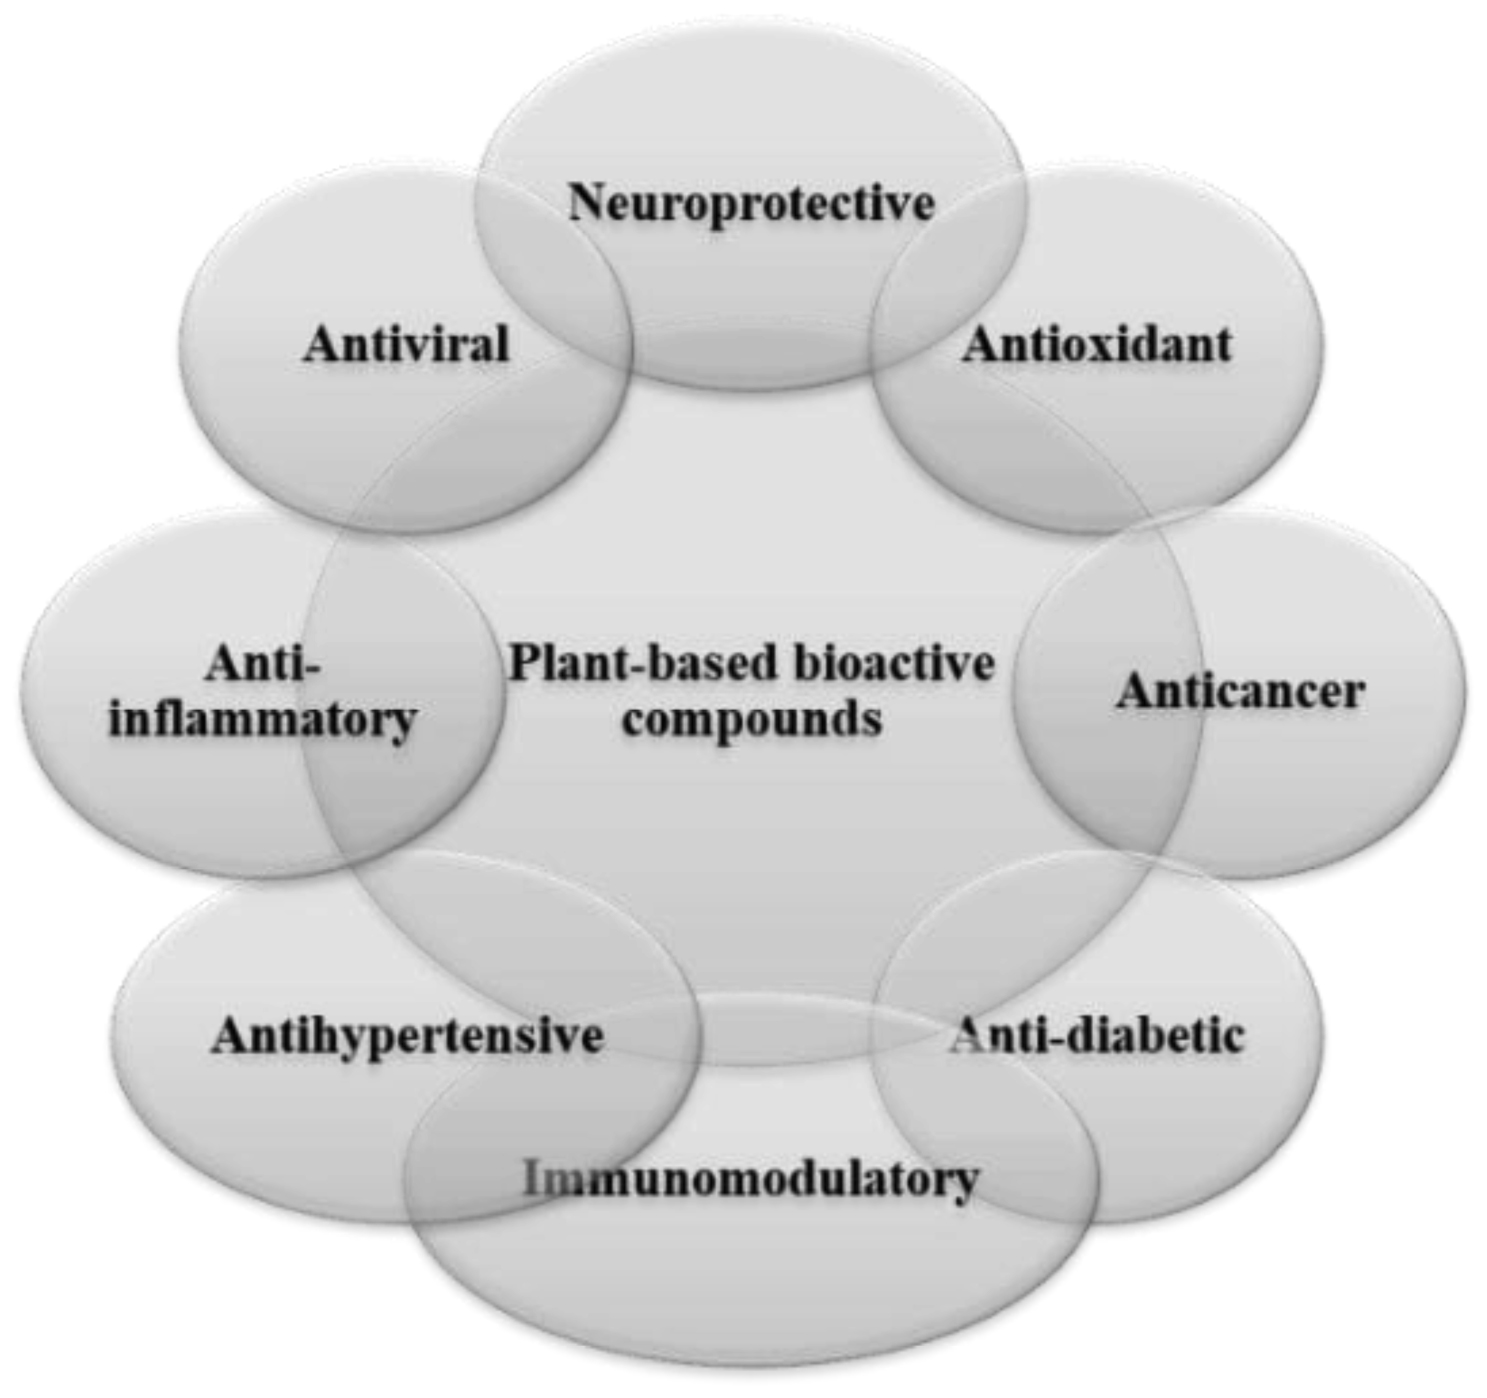
In recent years, numerous articles documenting bioactive components derived from diverse food sources have been published. Plant-based bioactive substances hold significant prospects for use as dietary supplements and functional foods because of their potential advantages for human health as antimicrobial, anticancer, anti-inflammatory, and antioxidant agents. Utilizing plant by-products as raw materials can also lower production costs and lessen environmental impacts. Thus, this review covered the bioactive substances found in plants and their by-products. The health benefits of bioactive compounds obtained from plant origins were also highlighted in this review. Furthermore, we concentrated on both conventional extraction techniques (e.g., Soxhlet, heat reflux, and maceration) and innovative extraction strategies for bioactive substances, including pulsed electric field (PEF), pressurized liquid, microwave-assisted, ultrasonic-assisted, and subcritical fluid methods. Higher yields obtained by novel extraction methods were found to be of primary interest, considering immediate beneficial economic outcomes. The potential applications of those bioactive substances in the food industry have been studied. Additionally, this investigation handled concerns regarding the challenges and limitations related to bioactive compounds. It is anticipated that the information covered in this review will prove to be a useful resource for the plant food processing sector in suggesting a cost-effective and environmentally friendly extraction technique that would turn plant wastes into a functional product with a high added value.
Citation: Ahmed A. Zaky, Muhammad Usman Akram, Katarzyna Rybak, Dorota Witrowa-Rajchert, Malgorzata Nowacka. Bioactive compounds from plants and by-products: Novel extraction methods, applications, and limitations[J]. AIMS Molecular Science, 2024, 11(2): 150-188. doi: 10.3934/molsci.2024010
In recent years, numerous articles documenting bioactive components derived from diverse food sources have been published. Plant-based bioactive substances hold significant prospects for use as dietary supplements and functional foods because of their potential advantages for human health as antimicrobial, anticancer, anti-inflammatory, and antioxidant agents. Utilizing plant by-products as raw materials can also lower production costs and lessen environmental impacts. Thus, this review covered the bioactive substances found in plants and their by-products. The health benefits of bioactive compounds obtained from plant origins were also highlighted in this review. Furthermore, we concentrated on both conventional extraction techniques (e.g., Soxhlet, heat reflux, and maceration) and innovative extraction strategies for bioactive substances, including pulsed electric field (PEF), pressurized liquid, microwave-assisted, ultrasonic-assisted, and subcritical fluid methods. Higher yields obtained by novel extraction methods were found to be of primary interest, considering immediate beneficial economic outcomes. The potential applications of those bioactive substances in the food industry have been studied. Additionally, this investigation handled concerns regarding the challenges and limitations related to bioactive compounds. It is anticipated that the information covered in this review will prove to be a useful resource for the plant food processing sector in suggesting a cost-effective and environmentally friendly extraction technique that would turn plant wastes into a functional product with a high added value.

| [1] |
Sadh PK, Duhan S, Duhan JS (2018) Agro-industrial wastes and their utilization using solid state fermentation: A review. Bioresour Bioprocess 5: 1. https://doi.org/10.1186/s40643-017-0187-z 
|
| [2] |
Kumari B, Tiwari BK, Hossain MB, et al. (2018) Recent advances on application of ultrasound and pulsed electric field technologies in the extraction of bioactives from agro-industrial byproducts. Food Bioprocess Technol 11: 223-241. https://doi.org/10.1007/s11947-017-1961-9
|
| [3] |
de Los Ángeles Fernández M, Espino M, Gomez FJV, et al. (2018) Novel approaches mediated by tailor-made green solvents for the extraction of phenolic compounds from agro-food industrial byproducts. Food Chem 239: 671-678. https://doi.org/10.1016/j.foodchem.2017.06.150
|
| [4] |
Ng HS, Kee PE, Yim HS, et al. (2020) Recent advances on the sustainable approaches for conversion and reutilization of food wastes to valuable bioproducts. Bioresource Technol 302: 122889. https://doi.org/10.1016/j.biortech.2020.122889
|
| [5] |
Cecilia JA, García-Sancho C, Maireles-Torres PJ, et al. (2019) Industrial food waste valorization: A general overview. Biorefinery . Cham: Springer 253-277. https://doi.org/10.1007/978-3-030-10961-5_11
|
| [6] |
Varzakas T, Zakynthinos G, Verpoort F (2016) Plant food residues as a source of nutraceuticals and functional foods. Foods 5: 88. https://doi.org/10.3390/foods5040088
|
| [7] | Coman V, Teleky BE, Mitrea L, et al. (2020) Bioactive potential of fruit and vegetable wastes. In Advances in food and nutrition research . Academic Press 157-225. https://doi.org/10.1016/bs.afnr.2019.07.001 |
| [8] |
Lopes FC, Ligabue-Braun R (2021) Agro-industrial residues: Eco-friendly and inexpensive substrates for microbial pigments production. Front Sustain Food Syst 5: 589414. https://doi.org/10.3389/fsufs.2021.589414
|
| [9] |
Lemes AC, Egea MB, de Oliveira Filho JG, et al. (2022) Biological approaches for extraction of bioactive compounds from agro-industrial by-products: A review. Front Bioeng Biotechnol 9: 802543. https://doi.org/10.3389/fbioe.2021.802543
|
| [10] |
Sobhy R, Zou X, Morsy OM, et al. (2023) Date seed polyphenol pills as renewable raw materials showed anti-obesity effects with high digestible antioxidants in 3T3-L1 cells. Appl Sci 13: 12533. https://doi.org/10.3390/app132212533
|
| [11] | Zaky AA, Chen Z, Qin M, et al. (2020) Assessment of antioxidant activity, amino acids, phenolic acids and functional attributes in defatted rice bran and rice bran protein concentrate. Progr Nutr 22: e2020069. https://doi.org/10.23751/pn.v22i4.8971 |
| [12] |
Rifna EJ, Misra NN, Dwivedi M (2021) Recent advances in extraction technologies for recovery of bioactive compounds derived from fruit and vegetable waste peels: A review. Crit Rev Food Sci Nutr 63: 719-752. https://doi.org/10.1080/10408398.2021.1952923
|
| [13] |
Ünlü AE (2021) Green and non-conventional extraction of bioactive compounds from olive leaves: Screening of novel natural deep eutectic solvents and investigation of process parameters. Waste Biomass Valori 12: 5329-5346. https://doi.org/10.1007/s12649-021-01411-3
|
| [14] |
Zaky AA, Simal-Gandara J, Eun JB, et al. (2022) Bioactivities, applications, safety, and health benefits of bioactive peptides from food and by-products: A review. Front Nutr 8: 815640. https://doi.org/10.3389/fnut.2021.815640
|
| [15] |
Jha AK, Sit N (2022) Extraction of bioactive compounds from plant materials using combination of various novel methods: A review. Trends Food Sci Tech 119: 579-591. https://doi.org/10.1016/j.tifs.2021.11.019
|
| [16] |
Singh JP, Kaur A, Shevkani K, et al. (2015) Influence of jambolan (Syzygium cumini) and xanthan gum incorporation on the physicochemical, antioxidant and sensory properties of gluten-free eggless rice muffins. Int J Food Sci Technol 50: 1190-1197. https://doi.org/10.1111/ijfs.12764
|
| [17] |
Ahmed F, Fanning K, Netzel M, et al. (2014) Profiling of carotenoids and antioxidant capacity of microalgae from subtropical coastal and brackish waters. Food Chem 165: 300-306. https://doi.org/10.1016/j.foodchem.2014.05.107
|
| [18] |
Cooperstone J, Schwartz S (2016) Recent insights into health benefits of carotenoids. Handbook on natural pigments in food and beverages . Cambridge, UK: Woodhead Publishing 473-497. https://doi.org/10.1016/B978-0-08-100371-8.00020-8
|
| [19] |
Gürbüz N, Uluisik S, Frary A, et al. (2018) Health benefits and bioactive compounds of eggplant. Food Chem 268: 602-610. https://doi.org/10.1016/j.foodchem.2018.06.093
|
| [20] |
Xu DP, Li Y, Meng X, et al. (2017) Natural antioxidants in foods and medicinal plants: Extraction, assessment and resources. Int J Mol Sci 18: 96. https://doi.org/10.3390/ijms18010096
|
| [21] |
Claudine M, Augustin S, Christine M, et al. (2004) Polyphenols: Food sources and bioavailability. Am J Clin Nutr 79: 727-747. https://doi.org/10.1093/ajcn/79.5.727
|
| [22] |
Bennett RN, Shiga TM, Hassimotto NMA, et al. (2010) Phenolics and antioxidant propertiesof fruit pulp and cell wall fractions of postharvest banana (Musa acuminata Juss.) cultivars. J Agric Food Chem 58: 7991-8003. https://doi.org/10.1021/jf1008692
|
| [23] |
Singh B, Singh JP, Kaur A, et al. (2016) Bioactive compounds in banana and their associated health benefits-A review. Food Chem 206: 1-11. https://doi.org/10.1016/j.foodchem.2016.03.033
|
| [24] |
Kim MJ, Moon Y, Tou JC, et al. (2016) Nutritional value, bioactive compounds and health benefits of lettuce (Lactuca sativa L.). J Food Compos Anal 49: 19-34. https://doi.org/10.1016/j.jfca.2016.03.004
|
| [25] |
Erlund I (2004) Review of the flavonoids quercetin, hesperetin, and naringenin. Dietary sources, bioactivities, bioavailability, and epidemiology. Nutr Res 24: 851-874. https://doi.org/10.1016/j.nutres.2004.07.005
|
| [26] |
Marie-Claire T, Michel de L, Norbert N, et al. (2008) Chronic dietary intake of plant-derived anthocyanins protects the rat heart against ischemia-reperfusion injury. J Nutr 138: 747-752. https://doi.org/10.1093/jn/138.4.747
|
| [27] |
Faria A, Pestana D, Teixeira D, et al. (2010) Blueberry anthocyanins and pyruvic acid adducts: Anticancer properties in breast cancer cell lines. Phytother Res 24: 1862-1869. https://doi.org/10.1002/ptr.3213
|
| [28] |
Liggins J, Bluck LJC, Runswick S, et al. (2000) Daidzein and genistein contents of vegetables. Br J Nutr 84: 717-725. https://doi.org/10.1017/S0007114500002075
|
| [29] |
Cheng DM, Pogrebnyak N, Kuhn P, et al. (2014) Polyphenol-rich rutgers scarlet lettuce improves glucose metabolism and liver lipid accumulation in diet-induced obese C57BL/6 mice. Nutrition 30: S52-S58. https://doi.org/10.1016/j.nut.2014.02.022
|
| [30] |
Montesano D, Rocchetti G, Putnik P, et al. (2018) Bioactive profile of pumpkin: An overview on terpenoids and their health-promoting properties. Curr Opin Food Sci 22: 81-87. https://doi.org/10.1016/j.cofs.2018.02.003
|
| [31] |
D'Andrea G (2015) Quercetin: A flavonol with multifaceted therapeutic applications?. Fitoterapia 106: 256-271. https://doi.org/10.1016/j.fitote.2015.09.018
|
| [32] |
Ghofrani S, Joghataei MT, Mohseni S, et al. (2015) Naringenin improves learning and memory in an Alzheimer's disease rat model: Insights into the underlying mechanisms. Eur J Pharmacol 764: 195-201. https://doi.org/10.1016/j.ejphar.2015.07.001
|
| [33] |
Nyman NA, Kumpulainen JT (2001) Determination of anthocyanidins in berries and red wine by high-performance liquid chromatography. J Agric Food Chem 49: 4183-4187. https://doi.org/10.1021/jf010572i
|
| [34] |
Barik SK, Russell WR, Moar KM, et al. (2020) The anthocyanins in black currants regulate postprandial hyperglycaemia primarily by inhibiting α-glucosidase while other phenolics modulate salivary α-amylase, glucose uptake and sugar transporters. J Nutr Biochem 78: 108325. https://doi.org/10.1016/j.jnutbio.2019.108325
|
| [35] |
Sorrenti V, Burò I, Consoli V, et al. (2023) Recent advances in health benefits of bioactive compounds from food wastes and by-products: Biochemical aspects. Int J Mol Sci 24: 2019. https://doi.org/10.3390/ijms24032019
|
| [36] |
Rifna EJ, Misra NN, Dwivedi M (2023) Recent advances in extraction technologies for recovery of bioactive compounds derived from fruit and vegetable waste peels: A review. Crit Rev Food Sci Nutr 63: 719-752. https://doi.org/10.1080/10408398.2021.1952923
|
| [37] |
Suleria HAR, Barrow CJ, Dunshea FR (2020) Screening and characterization of phenolic compounds and their antioxidant capacity in different fruit peels. Foods 9: 1206. https://doi.org/10.3390/foods9091206
|
| [38] |
Gumul D, Ziobro R, Korus J, et al. (2021) Apple pomace as a source of bioactive polyphenol compounds in gluten-free breads. Antioxidants 10: 807. https://doi.org/10.3390/antiox10050807
|
| [39] |
Martí R, Roselló S, Cebolla-Cornejo J (2016) Tomato as a source of carotenoids and polyphenols targeted to cancer prevention. Cancers 8: 58. https://doi.org/10.3390/cancers8060058
|
| [40] | Yang D, Jiang Y, Wang Y, et al. (2020) Improvement of flavonoids in lemon seeds on oxidative damage of human embryonic kidney 293T cells induced by H2O2. Oxid Med Cell Longev 2020: 3483519. https://doi.org/10.1155/2020/3483519 |
| [41] |
Chhikara N, Kushwaha K, Sharma P, et al. (2019) Bioactive compounds of beetroot and utilization in food processing industry: A critical review. Food Chem 272: 192-200. https://doi.org/10.1016/j.foodchem.2018.08.022
|
| [42] |
Talhaoui N, Gómez-Caravaca AM, Roldán C, et al. (2015) Chemometric analysis for the evaluation of phenolic patterns in olive leaves from six cultivars at different growth stages. J Agric Food Chem 63: 1722-1729. https://doi.org/10.1021/jf5058205
|
| [43] |
Wani TA, Majid D, Dar BN, et al. (2023) Utilization of novel techniques in extraction of polyphenols from grape pomace and their therapeutic potential: A review. J Food Meas Charact 17: 5412-5425. https://doi.org/10.1007/s11694-023-02040-1
|
| [44] |
Forbes-Hernandez TY, Giampieri F, Gasparrini M, et al. (2014) The effects of bioactive compounds from plant foods on mitochondrial function: A focus on apoptotic mechanisms. Food Chem Toxicol 68: 154-182. https://doi.org/10.1016/j.fct.2014.03.017
|
| [45] | Rowayshed G, Sharaf AM, El-Faham SY, et al. (2015) Utilization of potato peels extract as source of phytochemicals in biscuits. J Basic Appl Res Int 8: 190-201. |
| [46] |
Zhu J, Lu Y, He Q (2024) Recent advances on bioactive compounds, health benefits, and potential applications of jujube (Ziziphus Jujuba Mill.): A perspective of by-products valorization. Trends Food Sci Tech 145: 104368. https://doi.org/10.1016/j.tifs.2024.104368
|
| [47] |
Pirzadeh M, Caporaso N, Rauf A, et al. (2021) Pomegranate as a source of bioactive constituents: A review on their characterization, properties and applications. Crit Rev Food Sci Nutr 61: 982-999. https://doi.org/10.1080/10408398.2020.1749825
|
| [48] |
Ben-Othman S, Joudu I, Bhat R (2020) Bioactives from agri-food wastes: Present insights and future challenges. Molecules 25: 510. https://doi.org/10.3390/molecules25030510
|
| [49] |
Deo S, Sakhale BK (2018) A review on potential of bioactive compounds obtained from processing waste of various fruits and vegetables. Int J Pure Appl Biosci 6: 680-686. https://doi.org/10.18782/2320-7051.6742
|
| [50] |
Singh JP, Kaur A, Shevkani K, et al. (2016) Composition, bioactive compounds and antioxidant activity of common Indian fruits and vegetables. J Food Sci Technol 53: 4056-4066. https://doi.org/10.1007/s13197-016-2412-8
|
| [51] |
Jeon YA, Chung SW, Kim SC, et al. (2022) Comprehensive assessment of antioxidant and anti-inflammatory properties of papaya extracts. Foods 11: 3211. https://doi.org/10.3390/foods11203211
|
| [52] |
Sultana B, Hussan Z, Asif M, et al. (2012) Investigation on the antioxidant activity of leaves, peels, stems bark, and kernel of mango (Mangifera indica L.). J Food Sci 77: C849-C852. https://doi.org/10.1111/j.1750-3841.2012.02807.x
|
| [53] |
Wolfe K, Wu X, Liu RH (2003) Antioxidant activity of apple peels. J Agric Food Chem 51: 609-614. https://doi.org/10.1021/jf020782a
|
| [54] |
Matsuo Y, Miura LA, Araki T, et al. (2019) Proximate composition and profiles of free amino acids, fatty acids, minerals and aroma compounds in Citrus natsudaidai peel. Food Chem 279: 356-363. https://doi.org/10.1016/j.foodchem.2018.11.146
|
| [55] |
Zou Z, Xi W, Hu Y, et al. (2016) Antioxidant activity of Citrus fruits. Food Chem 196: 885-896. https://doi.org/10.1016/j.foodchem.2015.09.072
|
| [56] | Rajasree RS, Sibi PI, Francis F, et al. (2016) Phytochemicals of Cucurbitaceae family-A review. Int J Pharmacogn Phytochem Res 8: 113-123. |
| [57] | Guuntekin E, Uner B, Karakus B (2009) Chemical composition of tomato (Solanum lycopersicum) stalk and suitability in the particleboard production. J Env Biol 30: 731-734. |
| [58] |
Ravichandran K, Saw NMMT, Mohdaly AAA, et al. (2013) Impact of processing of red beet on betalain content and antioxidant activity. Food Res Int 50: 670-675. https://doi.org/10.1016/j.foodres.2011.07.002
|
| [59] |
Cartea ME, Francisco M, Soengas P, et al. (2010) Phenolic compounds in Brassica vegetables. Molecules 16: 251-280. https://doi.org/10.3390/molecules16010251
|
| [60] |
Al-Weshahy A, El-Nokety M, Bakhete M, et al. (2013) Effect of storage on antioxidant activity of freeze-dried potato peels. Food Res Int 50: 507-512. https://doi.org/10.1016/j.foodres.2010.12.014
|
| [61] |
Sahin S, Samli R, Tan ASB, et al. (2017) Solvent-free microwave-assisted extraction of polyphenols from olive tree leaves: Antioxidant and antimicrobial properties. Molecules 22: 1056. https://doi.org/10.3390/molecules22071056
|
| [62] |
Alberti A, Zielinski AAF, Zardo DM, et al. (2014) Optimisation of the extraction of phenolic compounds from apples using response surface methodology. Food Chem 149: 151-158. https://doi.org/10.1016/j.foodchem.2013.10.086
|
| [63] |
Putnik P, Barba FJ, Lorenzo JM, et al. (2017) An integrated approach to mandarin processing: Food safety and nutritional quality, consumer preference and nutrient bioaccessibility. Compr Rev Food Sci Food Saf 16: 1345-1358. https://doi.org/10.1111/1541-4337.12310
|
| [64] |
Anticona M, Lopez-Malo D, Frigola A, et al. (2022) Comprehensive analysis of polyphenols from hybrid Mandarin peels by SPE and HPLC-UV. LWT 165: 113770. https://doi.org/10.1016/j.LWT.2022.113770
|
| [65] |
Jménez-Aguilar DM, López-Martínez JM, Hernández-Brenes C, et al. (2015) Dietary fiber, phytochemical composition and antioxidant activity of Mexican commercial varieties of cactus pear. J Food Compos Anal 41: 66-73. https://doi.org/10.1016/j.jfca.2015.01.017
|
| [66] |
Chang SF, Hsieh CL, Yen GC (2008) The protective effect of Opuntia dillenii Haw fruit against low-density lipoprotein peroxidation and its active compounds. Food Chem 106: 569-575. https://doi.org/10.1016/j.foodchem.2007.06.017
|
| [67] |
Galati EM, Mondello MR, Giuffrida D, et al. (2003) Chemical characterization and biological effects of Sicilian Opuntia ficus indica (L.) Mill. fruit juice: Antioxidant and antiulcerogenic activity. J Agric Food Chem 51: 4903-4908. https://doi.org/10.1021/jf030123d
|
| [68] |
Lorenzo JM, Pateiro M, Domínguez R, et al. (2018) Berries extracts as natural antioxidants in meat products: A review. Food Res Int 106: 1095-1104. https://doi.org/10.1016/j.foodres.2017.12.005
|
| [69] |
Lorenzo JM, Munekata P, Putnik P, et al. (2019) Sources, chemistry and biological potential of ellagitannins and ellagic acid derivatives. Studies in natural products chemistry . Amsterdam, The Netherlands: Elsevier 189-221. https://doi.org/10.1016/B978-0-444-64181-6.00006-1
|
| [70] |
Szajdek A, Borowska EJ (2008) Bioactive compounds and health-promoting properties of berry fruits: A review. Plant Food Hum Nutr 63: 147-156. https://doi.org/10.1007/s11130-008-0097-5
|
| [71] |
Nishimura T, Egusa AS, Nagao A, et al. (2016) Phytosterols in onion contribute to a sensation of lingering of aroma, a koku attribute. Food Chem 192: 724-728. https://doi.org/10.1016/j.foodchem.2015.06.075
|
| [72] |
Bisen PS, Emerald M (2016) Nutritional and therapeutic potential of garlic and onion (Allium sp.). Curr Nutr Food Sci 12: 190-199. https://doi.org/10.2174/1573401312666160608121954
|
| [73] |
Nile SH, Nile AS, Keum YS, et al. (2017) Utilization of quercetin and quercetin glycosides from onion (Allium cepa L.) solid waste as an antioxidant, urease and xanthine oxidase inhibitors. Food Chem 235: 119-126. https://doi.org/10.1016/j.foodchem.2017.05.043
|
| [74] |
Ribeiro-Santos R, Carvalho-Costa D, Cavaleiro C, et al. (2015) A novel insight on an ancient aromatic plant: The rosemary (Rosmarinus officinalis L.). Trends Food Sci Tech 45: 355-368. https://doi.org/10.1016/j.tifs.2015.07.015
|
| [75] |
Sueishi Y, Sue M, Masamoto H (2018) Seasonal variations of oxygen radical scavenging ability in rosemary leaf extract. Food Chem 245: 270-274. https://doi.org/10.1016/j.foodchem.2017.10.085
|
| [76] |
Nieto G (2017) Biological activities of three essential oils of the Lamiaceae family. Medicines 4: 63. https://doi.org/10.3390/medicines4030063
|
| [77] |
Berdahl DB, McKeague J (2015) Rosemary and sage extracts as antioxidants for food preservation. Handbook of antioxidants for food preservation . Cambridge, UK: Woodhead Publishing 177-217. https://doi.org/10.1016/B978-1-78242-089-7.00008-7
|
| [78] |
Kolac UK, Ustuner MC, Tekin N, et al. (2017) The anti-inflammatory and antioxidant effects of Salvia officinalis on lipopolysaccharide-induced inflammation in rats. J Med Food 20: 1193-1200. https://doi.org/10.1089/jmf.2017.0035
|
| [79] |
Wu J, Ge S, Liu H, et al. (2014) Properties and antimicrobial activity of silver carp (Hypophthalmichthys molitrix) skin gelatin-chitosan films incorporated with oregano essential oil for fish preservation. Food Packaging Shelf 2: 7-16. https://doi.org/10.1016/j.fpsl.2014.04.004
|
| [80] |
Tohidi B, Rahimmalek M, Arzani A (2017) Essential oil composition, total phenolic, flavonoid contents, and antioxidant activity of Thymus species collected from different regions of Iran. Food Chem 220: 153-161. https://doi.org/10.1016/j.foodchem.2016.09.203
|
| [81] |
Moghimi R, Ghaderi L, Rafati H, et al. (2016) Superior antibacterial activity of nanoemulsion of Thymus daenensis essential oil against E. coli. Food Chem 194: 410-415. https://doi.org/10.1016/j.foodchem.2015.07.139
|
| [82] |
Sharma K, Mahato N, Cho MH, et al. (2017) Converting citrus wastes into value-added products: Economic and environmently friendly approaches. Nutrition 34: 29-46. https://doi.org/10.1016/j.nut.2016.09.006
|
| [83] |
Criado MN, Barba FJ, Frigola A, et al. (2014) Effect of Stevia rebaudiana on oxidative enzyme activity and its correlation with antioxidant capacity and bioactive compounds. Food Bioprocess Technol 7: 1518-1525. https://doi.org/10.1007/s11947-013-1208-3
|
| [84] |
Koubaa M, Roselló-Soto E, Žlabur JS, et al. (2015) Current and new insights in the sustainable and green recovery of nutritionally valuable compounds from Stevia rebaudiana Bertoni. J Agric Food Chem 63: 6835-6846. https://doi.org/10.1021/acs.jafc.5b01994
|
| [85] |
Bulotta S, Celano M, Lepore SM, et al. (2014) Beneficial effects of the olive oil phenolic components oleuropein and hydroxytyrosol: Focus on protection against cardiovascular and metabolic diseases. J Transl Med 12: 219. https://doi.org/10.1186/s12967-014-0219-9
|
| [86] | Afshari F, Seraj H, Hashemi ZS, et al. (2017) The cytotoxic effects of eggplant peel extract on human gastric adenocarcinoma cells and normal cells. Mod Med Lab J 1: 77-83. https://doi.org/10.30699/mmlj17.1.2.77 |
| [87] |
Berghe WV (2012) Epigenetic impact of dietary polyphenols in cancer chemoprevention: Lifelong remodeling of our epigenomes. Pharmacol Res 65: 565-576. https://doi.org/10.1016/j.phrs.2012.03.007
|
| [88] |
Sharma P, McClees SF, Afaq F (2017) Pomegranate for prevention and treatment of cancer: An update. Molecules 22: 177. https://doi.org/10.3390/molecules22010177
|
| [89] |
Rettig MB, Heber D, An J, et al. (2008) Pomegranate extract inhibits androgen-independent prostate cancer growth through a nuclear factor-κB-dependent mechanism. Mol Cancer Ther 7: 2662-2671. https://doi.org/10.1158/1535-7163.MCT-08-0136
|
| [90] |
Faria A, Pestana D, Teixeira D, et al. (2010) Blueberry anthocyanins and pyruvic acid adducts: Anticancer properties in breast cancer cell lines. Phytother Res 24: 1862-1869. https://doi.org/10.1002/ptr.3213
|
| [91] |
Salminen A, Lehtonen M, Suuronen T, et al. (2008) Terpenoids: Natural inhibitors of NF-κB signaling with anti-inflammatory and anticancer potential. Cell Mol Life Sci 65: 2979-2999. https://doi.org/10.1007/s00018-008-8103-5
|
| [92] |
Barik SK, Russell WR, Moar KM, et al. (2020) The anthocyanins in black currants regulate postprandial hyperglycaemia primarily by inhibiting α-glucosidase while other phenolics modulate salivary α-amylase, glucose uptake and sugar transporters. J Nutr Biochem 78: 108325. https://doi.org/10.1016/j.jnutbio.2019.108325
|
| [93] | Yang L, Shu L, Yao DD, et al. (2014) Study on the glucose-lowering effect of puerarin in STZ-induced diabetic mice. Chin J Hosp Pharm 34: 1338-1342. |
| [94] |
Anhê FF, Roy D, Pilon G, et al. (2015) A polyphenol-rich cranberry extract protects from diet-induced obesity, insulin resistance and intestinal inflammation in association with increased Akkermansia spp. population in the gut microbiota of mice. Gut 64: 872-883. https://doi.org/10.1136/gutjnl-2014-307142
|
| [95] |
Gong L, Cao W, Chi H, et al. (2018) Whole cereal grains and potential health effects: Involvement of the gut microbiota. Food Res Int 103: 84-102. https://doi.org/10.1016/j.foodres.2017.10.025
|
| [96] |
Velderrain-Rodríguez GR, Quero J, Osada J, et al. (2021) Phenolic-rich extracts from avocado fruit residues as functional food ingredients with antioxidant and antiproliferative properties. Biomolecules 11: 977. https://doi.org/10.3390/biom11070977
|
| [97] |
Mirza B, Croley CR, Ahmad M, et al. (2021) Mango (Mangifera indica L.): A magnificent plant with cancer preventive and anticancer therapeutic potential. Crit Rev Food Sci Nutr 61: 2125-2151. https://doi.org/10.1080/10408398.2020.1771678
|
| [98] |
Donga S, Bhadu GR, Chanda S (2020) Antimicrobial, antioxidant and anticancer activities of gold nanoparticles green synthesized using Mangifera indica seed aqueous extract. Artif Cell Nanomed Biotechnol 48: 1315-1325. https://doi.org/10.1080/21691401.2020.1843470
|
| [99] |
Agourram A, Ghirardello D, Rantsiou K, et al. (2013) Phenolic content, antioxidant potential, and antimicrobial activities of fruit and vegetable by-product extracts. Int J Food Prop 16: 1092-1104. https://doi.org/10.1080/10942912.2011.576446
|
| [100] |
Sanz-Puig M, Pina-Pérez MC, Martínez-López A, et al. (2016) Escherichia coli O157: H7 and Salmonella Typhimurium inactivation by the effect of mandarin, lemon, and orange by-products in reference medium and in oat-fruit juice mixed beverage. LWT-Food Sci Technol 66: 7-14. https://doi.org/10.1016/j.lwt.2015.10.012
|
| [101] |
Coman MM, Oancea AM, Verdenelli MC, et al. (2018) Polyphenol content and in vitro evaluation of antioxidant, antimicrobial and prebiotic properties of red fruit extracts. Eur Food Res Technol 244: 735-745. https://doi.org/10.1007/s00217-017-2997-9
|
| [102] |
Ramadan H, Min B, Tiwari AK, et al. (2015) Antibacterial activity of Pomegranate, Orange and Lemon peel extracts against food-borne pathogens and spoilage bacteria in vitro and on poultry skin. Int J Poult Sci 14: 229-239. https://doi.org/10.3923/ijps.2015.229.239
|
| [103] |
Wu J, Goodrich KM, Eifert JD, et al. (2018) Inhibiting foodborne pathogens Vibrio parahaemolyticus and Listeria monocytogenes using extracts from traditional medicine: Chinese gallnut, pomegranate peel, Baikal skullcap root and forsythia fruit. Open Agric 3: 163-170. https://doi.org/10.1515/opag-2018-0017
|
| [104] |
Zhu X, Zhang H, Lo R, et al. (2005) Antimicrobial activities of Cynara scolymus L. leaf, head, and stem extracts. J Food Sci 70: M149-M152. https://doi.org/10.1111/j.1365-2621.2005.tb07106.x
|
| [105] |
Mordi RC, Fadiaro AE, Owoeye TF, et al. (2016) Identification by GC-MS of the components of oils of banana peels extract, phytochemical and antimicrobial analyses. Res J Phytochem 10: 39-44. https://doi.org/10.3923/rjphyto.2016.39.44
|
| [106] |
Xu C, Yagiz Y, Hsu WY, et al. (2014) Antioxidant, antibacterial, and antibiofilm properties of polyphenols from muscadine grape (Vitis rotundifolia Michx.) pomace against selected foodborne pathogens. J Agric Food Chem 62: 6640-6649. https://doi.org/10.1021/jf501073q
|
| [107] |
Casquete R, Castro SM, Martín A, et al. (2015) Evaluation of the effect of high pressure on total phenolic content, antioxidant and antimicrobial activity of citrus peels. Innov Food Sci Emerg Technol 31: 37-44. https://doi.org/10.1016/j.ifset.2015.07.005
|
| [108] |
de Almeida Rochelle SL, de Cássia Orlandi Sardi J, Freires IA, et al. (2016) The anti-biofilm potential of commonly discarded agro-industrial residues against opportunistic pathogens. Ind Crop Prod 87: 150-160. https://doi.org/10.1016/j.indcrop.2016.03.044
|
| [109] | Gaafar AA, Asker MS, Salama ZA, et al. (2015) In-vitro, antiviral, antimicrobial and antioxidant potential activity of tomato pomace. Int J Pharm Sci Res 32: 262-272. https://doi.org/10.31083/j.fbl2709259 |
| [110] |
Garcia-Salas P, Morales-Soto A, Segura-Carretero A, et al. (2010) Phenolic-compound-extraction systems for fruit and vegetable samples. Molecules 15: 8813-8826. https://doi.org/10.3390/molecules15128813
|
| [111] |
Andersson AAM, Dimberg L, Åman P, et al. (2014) Recent findings on certain bioactive components in whole grain wheat and rye. J Cereal Sci 59: 294-311. https://doi.org/10.1016/j.jcs.2014.01.003
|
| [112] |
Saleh IA, Vinatoru M, Mason TJ, et al. (2016) A possible general mechanism for ultrasound-assisted extraction (UAE) suggested from the results of UAE of chlorogenic acid from Cynara scolymus L. (artichoke) leaves. Ultrason Sonochem 31: 330-336. https://doi.org/10.1016/j.ultsonch.2016.01.002
|
| [113] |
Berk Z (2009) Extraction. Food process engineering and technology . Academic Press 259-277. https://doi.org/10.1016/B978-0-12-373660-4.00011-9
|
| [114] |
Kühn S, Temelli F (2017) Recovery of bioactive compounds from cranberry pomace using ternary mixtures of CO2+ethanol+water. J Supercrit Fluids 130: 147-155. https://doi.org/10.1016/j.supflu.2017.07.028
|
| [115] |
Hammad SF, Abdallah IA, Bedair A, et al. (2022) Homogeneous liquid–liquid extraction as an alternative sample preparation technique for biomedical analysis. J Sep Sci 45: 185-209. https://doi.org/10.1002/jssc.202100452
|
| [116] |
Breil C, Vian MA, Zemb T, et al. (2017) “Bligh and Dyer” and Folch methods for solid–liquid–liquid extraction of lipids from microorganisms. Comprehension of solvatation mechanisms and towards substitution with alternative solvents. Int J Mol Sci 18: 708. https://doi.org/10.3390/ijms18040708
|
| [117] |
Chen SY, Urban PL (2015) On-line monitoring of Soxhlet extraction by chromatography and mass spectrometry to reveal temporal extract profiles. Anal Chim Acta 881: 74-81. https://doi.org/10.1016/j.aca.2015.05.003
|
| [118] |
Kodal SP, Aksu Z (2001) Optimization of carotene pigment production by Soxhlet extraction from waste orange peels. Food Chem 72: 145-171.
|
| [119] |
Caldas TW, Mazza KEL, Teles ASC, et al. (2018) Phenolic compounds recovery from grape skin using conventional and non-conventional extraction methods. Ind Crops Prod 111: 86-91. https://doi.org/10.1016/j.indcrop.2017.10.012
|
| [120] |
Tian B, Qiao YY, Tian YY, et al. (2016) Effect of heat reflux extraction on the structure and composition of a high-volatile bituminous coal. Appl Therm Eng 109: 560-568. https://doi.org/10.1016/j.applthermaleng.2016.08.104
|
| [121] |
Romero-Cascales I, Fernández-Fernández JI, López-Roca JM, et al. (2005) The maceration process during winemaking extraction of anthocyanins from grape skins into wine. Eur Food Res Technol 221: 163-167. https://doi.org/10.1007/s00217-005-1144-1
|
| [122] | Sultana B, Anwar F, Asi MR, et al. (2008) Antioxidant potential of extracts from different agro wastes: Stabilization of corn oil. Grasas Aceites 59: 205-217. |
| [123] |
Albuquerque BR, Prieto MA, Barreiro MF, et al. (2017) Catechin-based extract optimization obtained from Arbutus unedo L. fruits using maceration/microwave/ultrasound extraction techniques. Ind Crops Prod 95: 404-415. https://doi.org/10.1016/j.indcrop.2016.10.050
|
| [124] |
Khoddami A, Wilkes MA, Roberts TH (2013) Techniques for analysis of plant phenolic compounds. Molecules 18: 2328-2375. https://doi.org/10.3390/molecules18022328
|
| [125] |
Altemimi A, Lightfoot DA, Kinsel M, et al. (2015) Employing response surface methodology for the optimization of ultrasound assisted extraction of lutein and β-carotene from spinach. Molecules 20: 6611-6625. https://doi.org/10.3390/molecules20046611
|
| [126] |
Ferarsa S, Zhang W, Moulai-Mostefa N, et al. (2018) Recovery of anthocyanins and other phenolic compounds from purple eggplant peels and pulps using ultrasonic-assisted extraction. Food Bioprod Process 109: 19-28. https://doi.org/10.1016/j.fbp.2018.02.006
|
| [127] |
Skenderidis P, Mitsagga C, Giavasis I, et al. (2019) The in vitro antimicrobial activity assessment of ultrasound assisted Lycium barbarum fruit extracts and pomegranate fruit peels. J Food Meas Charact 13: 2017-2031. https://doi.org/10.1007/s11694-019-00123-6
|
| [128] |
Londoño-Londoño J, de Lima VR, Lara O, et al. (2010) Clean recovery of antioxidant flavonoids from citrus peel: Optimizing an aqueous ultrasound-assisted extraction method. Food Chem 119: 81-87. https://doi.org/10.1016/j.foodchem.2009.05.075
|
| [129] |
Zhu J, Kou X, Wu C, et al. (2022) Enhanced extraction of bioactive natural products using ultrasound-assisted aqueous two-phase system: Application to flavonoids extraction from jujube peels. Food Chem 395: 133530. https://doi.org/10.1016/j.foodchem.2022.133530
|
| [130] |
Sulejmanović M, Milić N, Mourtzinos I, et al. (2024) Ultrasound-assisted and subcritical water extraction techniques for maximal recovery of phenolic compounds from raw ginger herbal dust toward in vitro biological activity investigation. Food Chem 437: 137774. https://doi.org/10.1016/j.foodchem.2023.137774
|
| [131] |
Raj GB, Dash KK (2020) Ultrasound-assisted extraction of phytocompounds from dragon fruit peel: Optimization, kinetics and thermodynamic studies. Ultrason Sonochem 68: 105180. https://doi.org/10.1016/j.ultsonch.2020.105180
|
| [132] |
Kumcuoglu S, Yilmaz T, Tavman S (2014) Ultrasound assisted extraction of lycopene from tomato processing wastes. J Food Sci Technol 51: 4102-4107. https://doi.org/10.1007/s13197-013-0926-x
|
| [133] |
Jang M, Asnin L, Nile SH, et al. (2013) Ultrasound-assisted extraction of quercetin from onion solid wastes. Int J Food Sci Technol 48: 246-252. https://doi.org/10.1111/j.1365-2621.2012.03180.x
|
| [134] |
Goula AM, Ververi M, Adamopoulou A, et al. (2017) Green ultrasound-assisted extraction of carotenoids from pomegranate wastes using vegetable oils. Ultrason Sonochem 34: 821-830. https://doi.org/10.1016/j.ultsonch.2016.07.022
|
| [135] |
Medina-Meza IG, Barbosa-Canovas GV (2015) Assisted extraction of bioactive compounds from plum and grape peels by ultrasonics and pulsed electric fields. J Food Eng 166: 268-275. https://doi.org/10.1016/j.jfoodeng.2015.06.012
|
| [136] |
Huang G, Zhang M, Sun J, et al. (2020) Determination of flavonoids in magnolia officinalis leaves based on response surface optimization of infrared assisted extraction followed by high-performance liquid chromatography (HPLC). Anal Lett 53: 2145-2159. https://doi.org/10.1080/00032719.2020.1732401
|
| [137] |
Wang L, Duan H, Jiang J, et al. (2017) A simple and rapid infrared-assisted self enzymolysis extraction method for total flavonoid aglycones extraction from Scutellariae Radix and mechanism exploration. Anal Bioanal Chem 409: 5593-5602. https://doi.org/10.1007/s00216-017-0497-1
|
| [138] |
El Kantar S, Rajha HN, Maroun RG, et al. (2020) Intensification of polyphenols extraction from orange peels using infrared as a novel and energy saving pretreatment. J Food Sci 85: 414-420. https://doi.org/10.1111/1750-3841.15016
|
| [139] |
Cheaib D, El Darra N, Rajha HN, et al. (2018) Study of the selectivity and bioactivity of polyphenols using infrared assisted extraction from apricot pomace compared to conventional methods. Antioxidants 7: 174. https://doi.org/10.3390/antiox7120174
|
| [140] |
Chen Y, Duan G, Xie M, et al. (2010) Infrared-assisted extraction coupled with high-performance liquid chromatography for simultaneous determination of eight active compounds in Radix Salviae miltiorrhizae. J Sep Sci 33: 2888-2897. https://doi.org/10.1002/jssc.201000234
|
| [141] |
Abi-Khattar AM, Rajha HN, Abdel-Massih RM, et al. (2019) Intensification of polyphenol extraction from olive leaves using Ired-Irrad®, an environmentally-friendly innovative technology. Antioxidants 8: 227. https://doi.org/10.3390/antiox8070227
|
| [142] |
Zhou T, Xiao X, Li G, et al. (2011) Study of polyethylene glycol as a green solvent in the microwave-assisted extraction of flavone and coumarin compounds from medicinal plants. J Chromatog A 1218: 3608-3615. https://doi.org/10.1016/j.chroma.2011.04.031
|
| [143] |
Horikoshi S, Schiffmann RF, Fukushima J, et al. (2018) Electromagnetic fields and electromagnetic waves. Microwave chemical and materials processing . Singapore: Springer 33-45. https://doi.org/10.1007/978-981-10-6466-1_3
|
| [144] |
Zhang W, Liu X, Fan H, et al. (2016) Separation and purification of alkaloids from Sophora flavescens Ait. by focused microwave-assisted aqueous two-phase extraction coupled with reversed micellar extraction. Ind Crops Prod 86: 231-238. https://doi.org/10.1016/j.indcrop.2016.03.052
|
| [145] |
Ivanović M, Alañón ME, Arráez-Román D, et al. (2018) Enhanced and green extraction of bioactive compounds from Lippia citriodora by tailor-made natural deep eutectic solvents. Food Res Int 111: 67-76. https://doi.org/10.1016/j.foodres.2018.05.014
|
| [146] |
Simsek M, Sumnu G, Sahin S (2012) Microwave assisted extraction of phenolic compounds from sour cherry pomace. Sep Sci Technol 47: 1248-1254. https://doi.org/10.1080/01496395.2011.644616
|
| [147] | Asghari J, Ondruschka B, Mazaheritehrani M (2011) Extraction of bioactive chemical compounds from the medicinal Asian plants by microwave irradiation. J Med Plant Res 5: 495-506. |
| [148] |
Brahim M, Gambier F, Brosse N (2014) Optimization of polyphenols extraction from grape residues in water medium. Ind Crops Prod 52: 18-22. https://doi.org/10.1016/j.indcrop.2013.10.030
|
| [149] |
Ciriminna R, Fidalgo A, Avellone G, et al. (2019) Integral extraction of opuntia ficus-indica peel bioproducts via microwave-assisted hydrodiffusion and hydrodistillation. ACS Sustain Chem Eng 7: 7884-7891. https://doi.org/10.1021/acssuschemeng.9b00502
|
| [150] |
Liazid A, Guerrero RF, Cantos E, et al. (2011) Microwave assisted extraction of anthocyanins from grape skins. Food Chem 124: 1238-1243. https://doi.org/10.1016/j.foodchem.2010.07.053
|
| [151] |
Torres-León C, Rojas R, Serna-Cock L, et al. (2017) Extraction of antioxidants from mango seed kernel: Optimization assisted by microwave. Food Bioprod Process 105: 188-196. https://doi.org/10.1016/j.fbp.2017.07.005
|
| [152] |
Araújo RG, Rodriguez-Jasso RM, Ruiz HA, et al. (2020) Process optimization of microwave-assisted extraction of bioactive molecules from avocado seeds. Ind Crops Prod 154: 112623. https://doi.org/10.1016/j.indcrop.2020.112623
|
| [153] |
Lucchesi ME, Smadja J, Bradshaw S, et al. (2007) Solvent free microwave extraction of Elletaria cardamomum L.: A multivariate study of a new technique for the extraction of essential oil. J Food Eng 79: 1079-1086. https://doi.org/10.1016/j.jfoodeng.2006.03.029
|
| [154] |
Michel T, Destandau E, Elfakir C, et al. (2011) Evaluation of a simple and promising method for extraction of antioxidants from sea buckthorn (Hippophaë rhamnoides L.) berries: Pressurised solvent-free microwave assisted extraction. Food Chem 126: 1380-1386. https://doi.org/10.1016/j.foodchem.2010.09.112
|
| [155] |
Martínez J, Rosas J, Pérez J, et al. (2019) Green approach to the extraction of major capsaicinoids from habanero pepper using near-infrared, microwave, ultrasound and Soxhlet methods, a comparative study. Nat Prod Res 33: 447-452. https://doi.org/10.1080/14786419.2018.1455038
|
| [156] |
Yogesh K (2016) Pulsed electric field processing of egg products: A review. J Food Sci Technol 53: 934-945. https://doi.org/10.1007/s13197-015-2061-3
|
| [157] |
Sánchez-Vega R, Elez-Martínez P, Martín-Belloso O, et al. (2015) Influence of high-intensity pulsed electric field processing parameters on antioxidant compounds of broccoli juice. Innov Food Sci Emerg Technol 29: 70-77. https://doi.org/10.1016/j.ifset.2014.12.002
|
| [158] |
Kim HS, Ko MJ, Park CH, et al. (2022) Application of pulsed electric field as a pre-treatment for subcritical water extraction of quercetin from onion skin. Foods 11: 1069. https://doi.org/10.3390/foods11081069
|
| [159] |
Tantamacharik T, Leong SY, Leus MJ, et al. (2019) Structural changes induced by pulsed electric fields increase the concentration of volatiles released in red onion (Allium cepa L. Var. Red pearl) bulbs. Foods 8: 368. https://doi.org/10.3390/foods8090368
|
| [160] |
Yu X, Bals O, Grimi N (2015) A new way for the oil plant biomass valorization: Polyphenols and proteins extraction from rapeseed stems and leaves assisted by pulsed electric fields. Ind Crops Prod 74: 309-318. https://doi.org/10.1016/j.indcrop.2015.03.045
|
| [161] |
Yu X, Gouyo T, Grimi N, et al. (2016) Pulsed electric field pretreatment of rapeseed green biomass (stems) to enhance pressing and extractives recovery. Bioresour Technol 199: 194-201. https://doi.org/10.1016/j.biortech.2015.08.073
|
| [162] |
Wang L, Boussetta N, Lebovka N, et al. (2020) Cell disintegration of apple peels induced by pulsed electric field and efficiency of bio-compound extraction. Food Bioprod Process 122: 13-21. https://doi.org/10.1016/j.fbp.2020.03.004
|
| [163] |
Parniakov O, Rosello-Soto E, Barba FJ, et al. (2015) New approaches for the effective valorization of papaya seeds: Extraction of proteins, phenolic compounds, carbohydrates, and isothiocyanates assisted by pulsed electric energy. Food Res Int 77: 711-717. https://doi.org/10.1016/j.foodres.2015.03.031
|
| [164] |
Koubaa M, Barba FJ, Grimi N, et al. (2016) Recovery of colorants from red prickly pear peels and pulps enhanced by pulsed electric field and ultrasound. Innov Food Sci Emerg Technol 37: 336-344. https://doi.org/10.1016/j.ifset.2016.04.015
|
| [165] |
Luengo E, Alvarez I, Raso J (2013) Improving the pressing extraction of polyphenols of orange peel by pulsed electric fields. Innov Food Sci Emerg Technol 17: 79-84. https://doi.org/10.1016/j.ifset.2012.10.005
|
| [166] |
Corrales M, Toepfl S, Butz P, et al. (2008) Extraction of anthocyanins from grape by-products assisted by ultrasonics, high hydrostatic pressure or pulsed electric fields: a comparison. Innov Food Sci Emerg Technol 9: 85-91. https://doi.org/10.1016/j.ifset.2007.06.002
|
| [167] |
Gómez-Mejía E, Rosales-Conrado N, León-González ME, et al. (2019) Citrus peels waste as a source of value-added compounds: Extraction and quantification of bioactive polyphenols. Food Chem 295: 289-299. https://doi.org/10.1016/j.foodchem.2019.05.136
|
| [168] |
Benito-Román Ó, Alvarez VH, Alonso E, et al. (2015) Pressurized aqueous ethanol extraction of β-glucans and phenolic compounds from waxy barley. Food Res Int 75: 252-259. https://doi.org/10.1016/j.foodres.2015.06.006
|
| [169] |
Markom M, Hasan M, Daud WRW, et al. (2007) Extraction of hydrolysable tannins from Phyllanthus niruri Linn.: effects of solvents and extraction methods. Sep Purif Technol 52: 487-496. https://doi.org/10.1016/j.seppur.2006.06.003
|
| [170] |
Mohd Jusoh NH, Subki A, Yeap SK, et al. (2019) Pressurized hot water extraction of hydrosable tannins from Phyllanthus tenellus Roxb. BMC Chem 13: 134. https://doi.org/10.1186/s13065-019-0653-0
|
| [171] |
Wrona O, Rafińska K, Możeński C, et al. (2017) Supercritical fluid extraction of bioactive compounds from plant materials. J AOAC Int 100: 1624-1635. https://doi.org/10.5740/jaoacint.17-0232
|
| [172] |
Montañés F, Catchpole OJ, Tallon S, et al. (2018) Extraction of apple seed oil by supercritical carbon dioxide at pressures up to 1300 bar. J Supercrit Fluid 141: 128-136. https://doi.org/10.1016/j.supflu.2018.02.002
|
| [173] |
Pavlić B, Bera O, Teslić N, et al. (2018) Chemical profile and antioxidant activity of sage herbal dust extracts obtained by supercritical fluid extraction. Ind Crops Prod 120: 305-312. https://doi.org/10.1016/j.indcrop.2018.04.044
|
| [174] |
Kitrytė V, Laurinavičienė A, Syrpas M, et al. (2020) Modeling and optimization of supercritical carbon dioxide extraction for isolation of valuable lipophilic constituents from elderberry (Sambucus nigra L.) pomace. J CO2 Util 35: 225-235. https://doi.org/10.1016/j.jcou.2019.09.020
|
| [175] |
He L, Zhang X, Xu H, et al. (2011) Subcritical water extraction of phenolic compounds from pomegranate (Punica granatum L.) seed residues and investigation into their antioxidant activities with HPLC–ABTS·+ assay. Food Bioprod Process 90: 215-223. https://doi.org/10.1016/j.fbp.2011.03.003
|
| [176] |
Singh PP, Saldaña MDA (2011) Subcritical water extraction of phenolic compounds from potato peel. Food Res Int 44: 2452-2458. https://doi.org/10.1016/j.foodres.2011.02.006
|
| [177] |
Aliakbarian B, Fathi A, Perego P, et al. (2012) Extraction of antioxidants from winery wastes using subcritical water. J Supercrit Fluids 65: 18-24. https://doi.org/10.1016/j.supflu.2012.02.022
|
| [178] |
Jiao G, Kermanshahi A (2018) Extraction of anthocyanins from haskap berry pulp using supercritical carbon dioxide: influence of co-solvent composition and pretreatment. LWT 98: 237-244. https://doi.org/10.1016/j.lwt.2018.08.042
|
| [179] |
Natolino A, Da Porto C (2019) Supercritical carbon dioxide extraction of pomegranate (Punica granatum L.) seed oil: Kinetic modelling and solubility evaluation. J Supercrit Fluids 151: 30-39. https://doi.org/10.1016/j.supflu.2019.05.002
|
| [180] |
e Santos DN, de Souza LL, Ferreira NJ, et al. (2015) Study of supercritical extraction from Brazilian cherry seeds (Eugenia uniflora L.) with bioactive compounds. Food Bioprod Process 94: 365-374. https://doi.org/10.1016/j.fbp.2014.04.005
|
| [181] |
Grzelak-Błaszczyk K, Karlińska E, Grzęda K, et al. (2017) Defatted strawberry seeds as a source of phenolics, dietary fiber and minerals. LWT 84: 18-22. https://doi.org/10.1016/j.lwt.2017.05.014
|
| [182] |
Liu J, Chen P, He J, et al. (2014) Extraction of oil from Jatropha curcas seeds by subcritical fluid extraction. Ind Crops Prod 62: 235-241. https://doi.org/10.1016/j.indcrop.2014.08.039
|
| [183] |
Abdelmoez W, Nage SM, Bastawess A, et al. (2014) Subcritical water technology for wheat straw hydrolysis to produce value added products. J Clean Prod 70: 68-77. https://doi.org/10.1016/j.jclepro.2014.02.011
|
| [184] |
Munir MT, Kheirkhah H, Baroutian S, et al. (2018) Subcritical water extraction of bioactive compounds from waste onion skin. J Clean Prod 183: 487-494. https://doi.org/10.1016/j.jclepro.2018.02.166
|
| [185] |
Rodrigues LGG, Mazzutti S, Vitali L, et al. (2019) Recovery of bioactive phenolic compounds from papaya seeds agroindustrial residue using subcritical water extraction. Biocatal Agric Biotechnol 22: 101367. https://doi.org/10.1016/j.bcab.2019.101367
|
| [186] |
Pereira MG, Hamerski F, Andrade EF, et al. (2017) Assessment of subcritical propane, ultrasound-assisted and Soxhlet extraction of oil from sweet passion fruit (Passiflora alata Curtis) seeds. J Supercrit Fluids 128: 338-348. https://doi.org/10.1016/j.supflu.2017.03.021
|
| [187] |
Duba KS, Casazza AA, Mohamed HB, et al. (2015) Extraction of polyphenols from grape skins and defatted grape seeds using subcritical water: Experiments and modeling. Food Bioprod Process 94: 29-38. https://doi.org/10.1016/j.fbp.2015.01.001
|
| [188] |
Awad AM, Kumar P, Ismail-Fitry MR, et al. (2021) Green extraction of bioactive compounds from plant biomass and their application in meat as natural antioxidant. Antioxidants 10: 1465. https://doi.org/10.3390/antiox10091465
|
| [189] |
Deng BX, Li B, Li XD, et al. (2018) Using short-wave infrared radiation to improve aqueous enzymatic extraction of peanut oil: Evaluation of peanut cotyledon microstructure and oil quality. Eur J Lipid Sci Technol 120: 1700285. https://doi.org/10.1002/ejlt.201700285
|
| [190] |
Lenucci MS, De Caroli M, Marrese PP, et al. (2015) Enzyme-aided extraction of lycopene from high-pigment tomato cultivars by supercritical carbon dioxide. Food Chem 170: 193-202. https://doi.org/10.1016/j.foodchem.2014.08.081
|
| [191] |
Boulila A, Hassen I, Haouari L, et al. (2015) Enzyme-assisted extraction of bioactive compounds from bay leaves (Laurus nobilis L.). Ind Crops Prod 74: 485-493. https://doi.org/10.1016/j.indcrop.2015.05.050
|
| [192] |
Sahne F, Mohammadi M, Najafpour GD, et al. (2017) Enzyme-assisted ionic liquid extraction of bioactive compound from turmeric (Curcuma longa L.): Isolation, purification and analysis of curcumin. Ind Crops Prod 95: 686-694. https://doi.org/10.1016/j.indcrop.2016.11.037
|
| [193] |
Xu C, Yagiz Y, Borejsza-Wysocki W, et al. (2014) Enzyme release of phenolics from muscadine grape (Vitis rotundifolia Michx.) skins and seeds. Food Chem 157: 20-29. https://doi.org/10.1016/j.foodchem.2014.01.128
|
| [194] |
Vasco-Correa J, Zapata ADZ (2017) Enzymatic extraction of pectin from passion fruit peel (Passiflora edulis f. flavicarpa) at laboratory and bench scale. LWT 80: 280-285. https://doi.org/10.1016/j.lwt.2017.02.024
|
| [195] |
Roda A, De Faveri DM, Giacosa S, et al. (2016) Effect of pre-treatments on the saccharification of pineapple waste as a potential source for vinegar production. J Clean Prod 112: 4477-4484. https://doi.org/10.1016/j.jclepro.2015.07.019
|
| [196] |
Ameer K, Shahbaz HM, Kwon JH, et al. (2017) Green extraction methods for polyphenols from plant matrices and their byproducts: A review. Compr Rev Food Sci Food Saf 16: 295-315. https://doi.org/10.1111/1541-4337.12253
|
| [197] |
Dzah CS, Duan Y, Zhang H, et al. (2020) Latest developments in polyphenol recovery and purification from plant by-products: A review. Trends Food Sci Technol 99: 375-388. https://doi.org/10.1016/j.tifs.2020.03.003
|
| [198] |
Safdar MN, Kausar T, Jabbar S, et al. (2017) Extraction and quantification of polyphenols from kinnow (Citrus reticulate L.) peel using ultrasound and maceration techniques. J Food Drug Anal 25: 488-500. https://doi.org/10.1016/j.jfda.2016.07.010
|
| [199] |
Patra A, Abdullah S, Pradhan RC, et al. (2022) Review on the extraction of bioactive compounds and characterization of fruit industry by-products. Bioresour Bioprocess 9: 14. https://doi.org/10.1186/s40643-022-00498-3
|
| [200] |
Khadhraoui B, Ummat V, Tiwari BK, et al. (2021) Review of ultrasound combinations with hybrid and innovative techniques for extraction and processing of food and natural products. Ultrason Sonochem 76: 105625. https://doi.org/10.1016/j.ultsonch.2021.105625
|
| [201] |
Khan MK, Ahmad K, Hassan S, et al. (2018) Effect of novel technologies on polyphenols during food processing. Innov Food Sci Emerg Technol 45: 361-381. https://doi.org/10.1016/j.ifset.2017.12.006
|
| [202] |
Essien SO, Udugama I, Young B, et al. (2021) Recovery of bioactives from kanuka leaves using subcritical water extraction: Techno-economic analysis, environmental impact assessment and technology readiness level. J Supercrit Fluids 169: 105119. https://doi.org/10.1016/j.supflu.2020.105119
|
| [203] |
Lopeda-Correa M, Valdes-Duque BE, Osorio-Tobon JF (2022) Ultrasound-assisted extraction of phenolic compounds from Adenaria floribunda stem: Economic assessment. Foods 11: 2904. https://doi.org/10.3390/foods11182904
|
| [204] |
Vilas-Boas AA, Pintado M, Oliveira ALS (2021) Natural bioactive compounds from food waste: Toxicity and safety concerns. Foods 10: 1564. https://doi.org/10.3390/foods10071564
|
| [205] |
Veneziani G, Novelli E, Esposto S, et al. (2017) Applications of recovered bioactive compounds in food products. Olive mill waste . Academic Press 231-253. https://doi.org/10.1016/b978-0-12-805314-0.00011-x
|
| [206] |
Fidelis M, de Oliveira SM, Sousa JS, et al. (2020) From byproduct to a functional ingredient: Camu-cmu (Myrciaria Dubia) seed extract as an antioxidant agent in a yogurt model. J Dairy Sci 103: 1131-1140. https://doi.org/10.3168/jds.2019-17173
|
| [207] |
Özen BO, Eren M, Pala A, et al. (2011) Effect of plant extracts on lipid oxidation during frozen storage of minced fish muscle. Int J Food Sci Technol 46: 724-731. https://doi.org/10.1111/j.1365-2621.2010.02541.x
|
| [208] |
Peng X, Ma J, Cheng KW, et al. (2010) The effects of grape seed extract fortification on the antioxidant activity and quality attributes of bread. Food Chem 119: 49-53. https://doi.org/10.1016/j.foodchem.2009.05.083
|
| [209] |
Deolindo CTP, Monteiro PI, Santos JS, et al. (2019) Phenolic-rich petit suisse cheese manufactured with organic bordeaux grape juice, skin, and seed extract: Technological, sensory, and functional properties. LWT 115: 108493. https://doi.org/10.1016/j.lwt.2019.108493
|
| [210] |
Zamuz S, López-Pedrouso M, Barba FJ, et al. (2018) Application of hull, bur and leaf chestnut extracts on the shelf-life of beef patties stored under MAP: Evaluation of their impact on physicochemical properties, lipid oxidation, antioxidant, and antimicrobial potential. Food Res Int 112: 263-273. https://doi.org/10.1016/j.foodres.2018.06.053
|
| [211] |
Lorenzo JM, González-Rodríguez RM, Sánchez M, et al. (2013) Effects of natural (grape seed and chestnut extract) and synthetic antioxidants (buthylatedhydroxytoluene, BHT) on the physical, chemical, microbiological and sensory characteristics of dry cured sausage “chorizo”. Food Res Int 54: 611-620. https://doi.org/10.1016/j.foodres.2013.07.064
|
| [212] |
Turgut SS, Soyer A, Işıkçı F (2016) Effect of pomegranate peel extract on lipid and protein oxidation in beef meatballs during refrigerated storage. Meat Sci 116: 126-132. https://doi.org/10.1016/j.meatsci.2016.02.011
|
| [213] |
Choe JH, Kim HY, Kim CJ (2017) Effect of persimmon peel (Diospyros kaki thumb.) extracts on lipid and protein oxidation of raw ground pork during refrigerated storage. Korean Soc Food Sci Anim Resour 37: 254-263. https://doi.org/10.5851/kosfa.2017.37.2.254
|
| [214] |
Ergezer H, Serdaroğlu M (2018) Antioxidant potential of artichoke (Cynara scolymus L.) byproducts extracts in raw beef patties during refrigerated storage. J Food Meas Charact 12: 982-91. https://doi.org/10.1007/s11694-017-9713-0
|
| [215] |
Andrés AI, Petron MJ, Delgado-Adamez J, et al. (2017) Effect of tomato pomace extracts on the shelf-life of modified atmosphere-packaged lamb meat. J Food Process Pres 41: e13018. https://doi.org/10.1111/jfpp.13018
|
| [216] |
Basiri S, Shekarforoush SS, Aminlari M, et al. (2015) The effect of pomegranate peel extract (PPE) on the polyphenol oxidase (PPO) and quality of pacific white shrimp (Litopenaeus vannamei) during refrigerated storage. LWT-Food Sci Technol 60: 1025-1033. https://doi.org/10.1016/j.lwt.2014.10.043
|
| [217] |
Ebied AS, Morshdy AEM, Abd-El-Salam EH, et al. (2017) Effect of pomegranate peel powder on the hygienic quality of beef sausage. J Microbiol Biotechnol Food Sci 6: 1300-1304. https://doi.org/10.15414/jmbfs.2017.6.6.1300-1304
|
| [218] |
Nishad J, Koley TK, Varghese E, et al. (2018) Synergistic effects of nutmeg and citrus peel extracts in imparting oxidative stability in meat balls. Food Res Int 106: 1026-1036. https://doi.org/10.1016/j.foodres.2018.01.075
|
| [219] |
Biswas AK, Beura CK, Yadav AS, et al. (2015) Influence of novel bioactive compounds from selected fruit by-products and plant materials on the quality and storability of microwave-assisted cooked poultry meat wafer during ambient temperature storage. LWT-Food Sci Technol 62: 727-733. https://doi.org/10.1016/j.lwt.2014.09.024
|
| [220] |
Abid Y, Azabou S, Jridi M, et al. (2017) Storage stability of traditional Tunisian butter enriched with antioxidant extract from tomato processing by-products. Food Chem 233: 476-482. https://doi.org/10.1016/j.foodchem.2017.04.125
|
| [221] |
Bertolino M, Belviso S, Dal Bello B, et al. (2015) Influence of the addition of different hazelnut skins on the physicochemical, antioxidant, polyphenol and sensory properties of yogurt. LWT-Food Sci Technol 63: 1145-1154. https://doi.org/10.1016/j.lwt.2015.03.113
|
| [222] |
Sah BNP, Vasiljevic T, McKechnie S, et al. (2015) Effect of refrigerated storage on probiotic viability and the production and stability of antimutagenic and antioxidant peptides in yogurt supplemented with pineapple peel. J Dairy Sci 98: 5905-5916. https://doi.org/10.3168/jds.2015-9450
|
| [223] |
Ortiz L, Dorta E, Lobo MG, et al. (2017) Use of banana peel extract to stabilise antioxidant capacity and sensory properties of orange juice during pasteurisation and refrigerated storage. Food Bioprocess Technol 10: 1883-1891. https://doi.org/10.1007/s11947-017-1964-6
|
| [224] |
Zaky AA, Hussein AS, Mostafa S, et al. (2022) Impact of sunflower meal protein isolate supplementation on pasta quality. Separations 9: 429. https://doi.org/10.3390/separations9120429
|
| [225] |
Kampuse S, Ozola L, Straumite E, et al. (2015) Quality parameters of wheat bread enriched with pumpkin (Cucurbita moschata) by-products. Acta Univ Cibiniensis Ser E: Food Technol 19: 3-14. https://doi.org/10.1515/aucft-2015-0010
|
| [226] |
Šporin M, Avbelj M, Kovač B, et al. (2018) Quality characteristics of wheat flour dough and bread containing grape pomace flour. Food Sci Technol Int 24: 251-263. https://doi.org/10.1177/1082013217745398
|
| [227] | Zaky AA, Asiamah E, El-Faham SY, et al. (2020) Utilization of grape pomace extract as a source of natural antioxidant in biscuits. Eur Acad Res 8: 108-126. |
| [228] |
Arun KB, Persi F, Aswathy PS, et al. (2015) Plantain peel—A potential source of antioxidant dietary fibre for developing functional cookies. J Food Sci Technol 52: 6355-6364. https://doi.org/10.1007/s13197-015-1727-1
|
| [229] | El-Faham SY, Mohsen MSA, Sharaf AM, et al. (2016) Utilization of mango peels as a source of polyphenolic antioxidants. Curr Sci Int 5: 529-542. |
| [230] |
Mildner-Szkudlarz S, Bajerska J, Górnaś P, et al. (2016) Physical and bioactive properties of muffins enriched with raspberry and cranberry pomace powder: A promising application of fruit by-products rich in biocompounds. Plant Foods Hum Nutr 71: 165-173. https://doi.org/10.1007/s11130-016-0539-4
|
| [231] |
Hidalgo A, Brandolini A, Čanadanović-Brunet J, et al. (2018) Microencapsulates and extracts from red beetroot pomace modify antioxidant capacity, heat damage and colour of pseudocerealsenriched einkorn water biscuits. Food Chem 268: 40-48. https://doi.org/10.1016/j.foodchem.2018.06.062
|
| [232] | Mir SA, Bosco SJD, Shah MA, et al. (2017) Effect of apple pomace on quality characteristics of brown rice based cracker. J Saudi Soc Agric Sci 16: 25-32. https://doi.org/10.1016/j.jssas.2015.01.001 |
| [233] |
Tańska M, Roszkowska B, Czaplicki S, et al. (2016) Effect of fruit pomace addition on shortbread cookies to improve their physical and nutritional values. Plant Foods Hum Nutr 71: 307-313. https://doi.org/10.1007/s11130-016-0561-6
|
| [234] |
Putnik P, Lorenzo JM, Barba FJ, et al. (2018) Novel food processing and extraction technologies of high-added value compounds from plant materials. Foods 7: 106. https://doi.org/10.3390/foods7070106
|
| [235] | Zawistowski J (2008) Chapter 24-Regulation of functional foods in selected Asian countries in the pacific rim. Nutraceutical and functional food regulations in the united states and around the world . San Diego, CA, USA: Academic Press 419-463. https://doi.org/10.1016/B978-0-12-405870-5.00024-4 |
| [236] | Plant extracts market size and forecast. Available online: https://www.verifiedmarketresearch.com/product/global-plantextracts-market-size-and-forecast-to-2025/. |
| [237] |
Beya MM, Netzel ME, Sultanbawa Y, et al. (2021) Plant-based phenolic molecules as natural preservatives in comminuted meats: A review. Antioxidants 10: 263. https://doi.org/10.3390/antiox10020263
|
Figures(1) / Tables(4)

Ahmed A. Zaky, Muhammad Usman Akram, Katarzyna Rybak, Dorota Witrowa-Rajchert, Malgorzata Nowacka. Bioactive compounds from plants and by-products: Novel extraction methods, applications, and limitations[J]. AIMS Molecular Science, 2024, 11(2): 150-188. doi: 10.3934/molsci.2024010


 DownLoad: