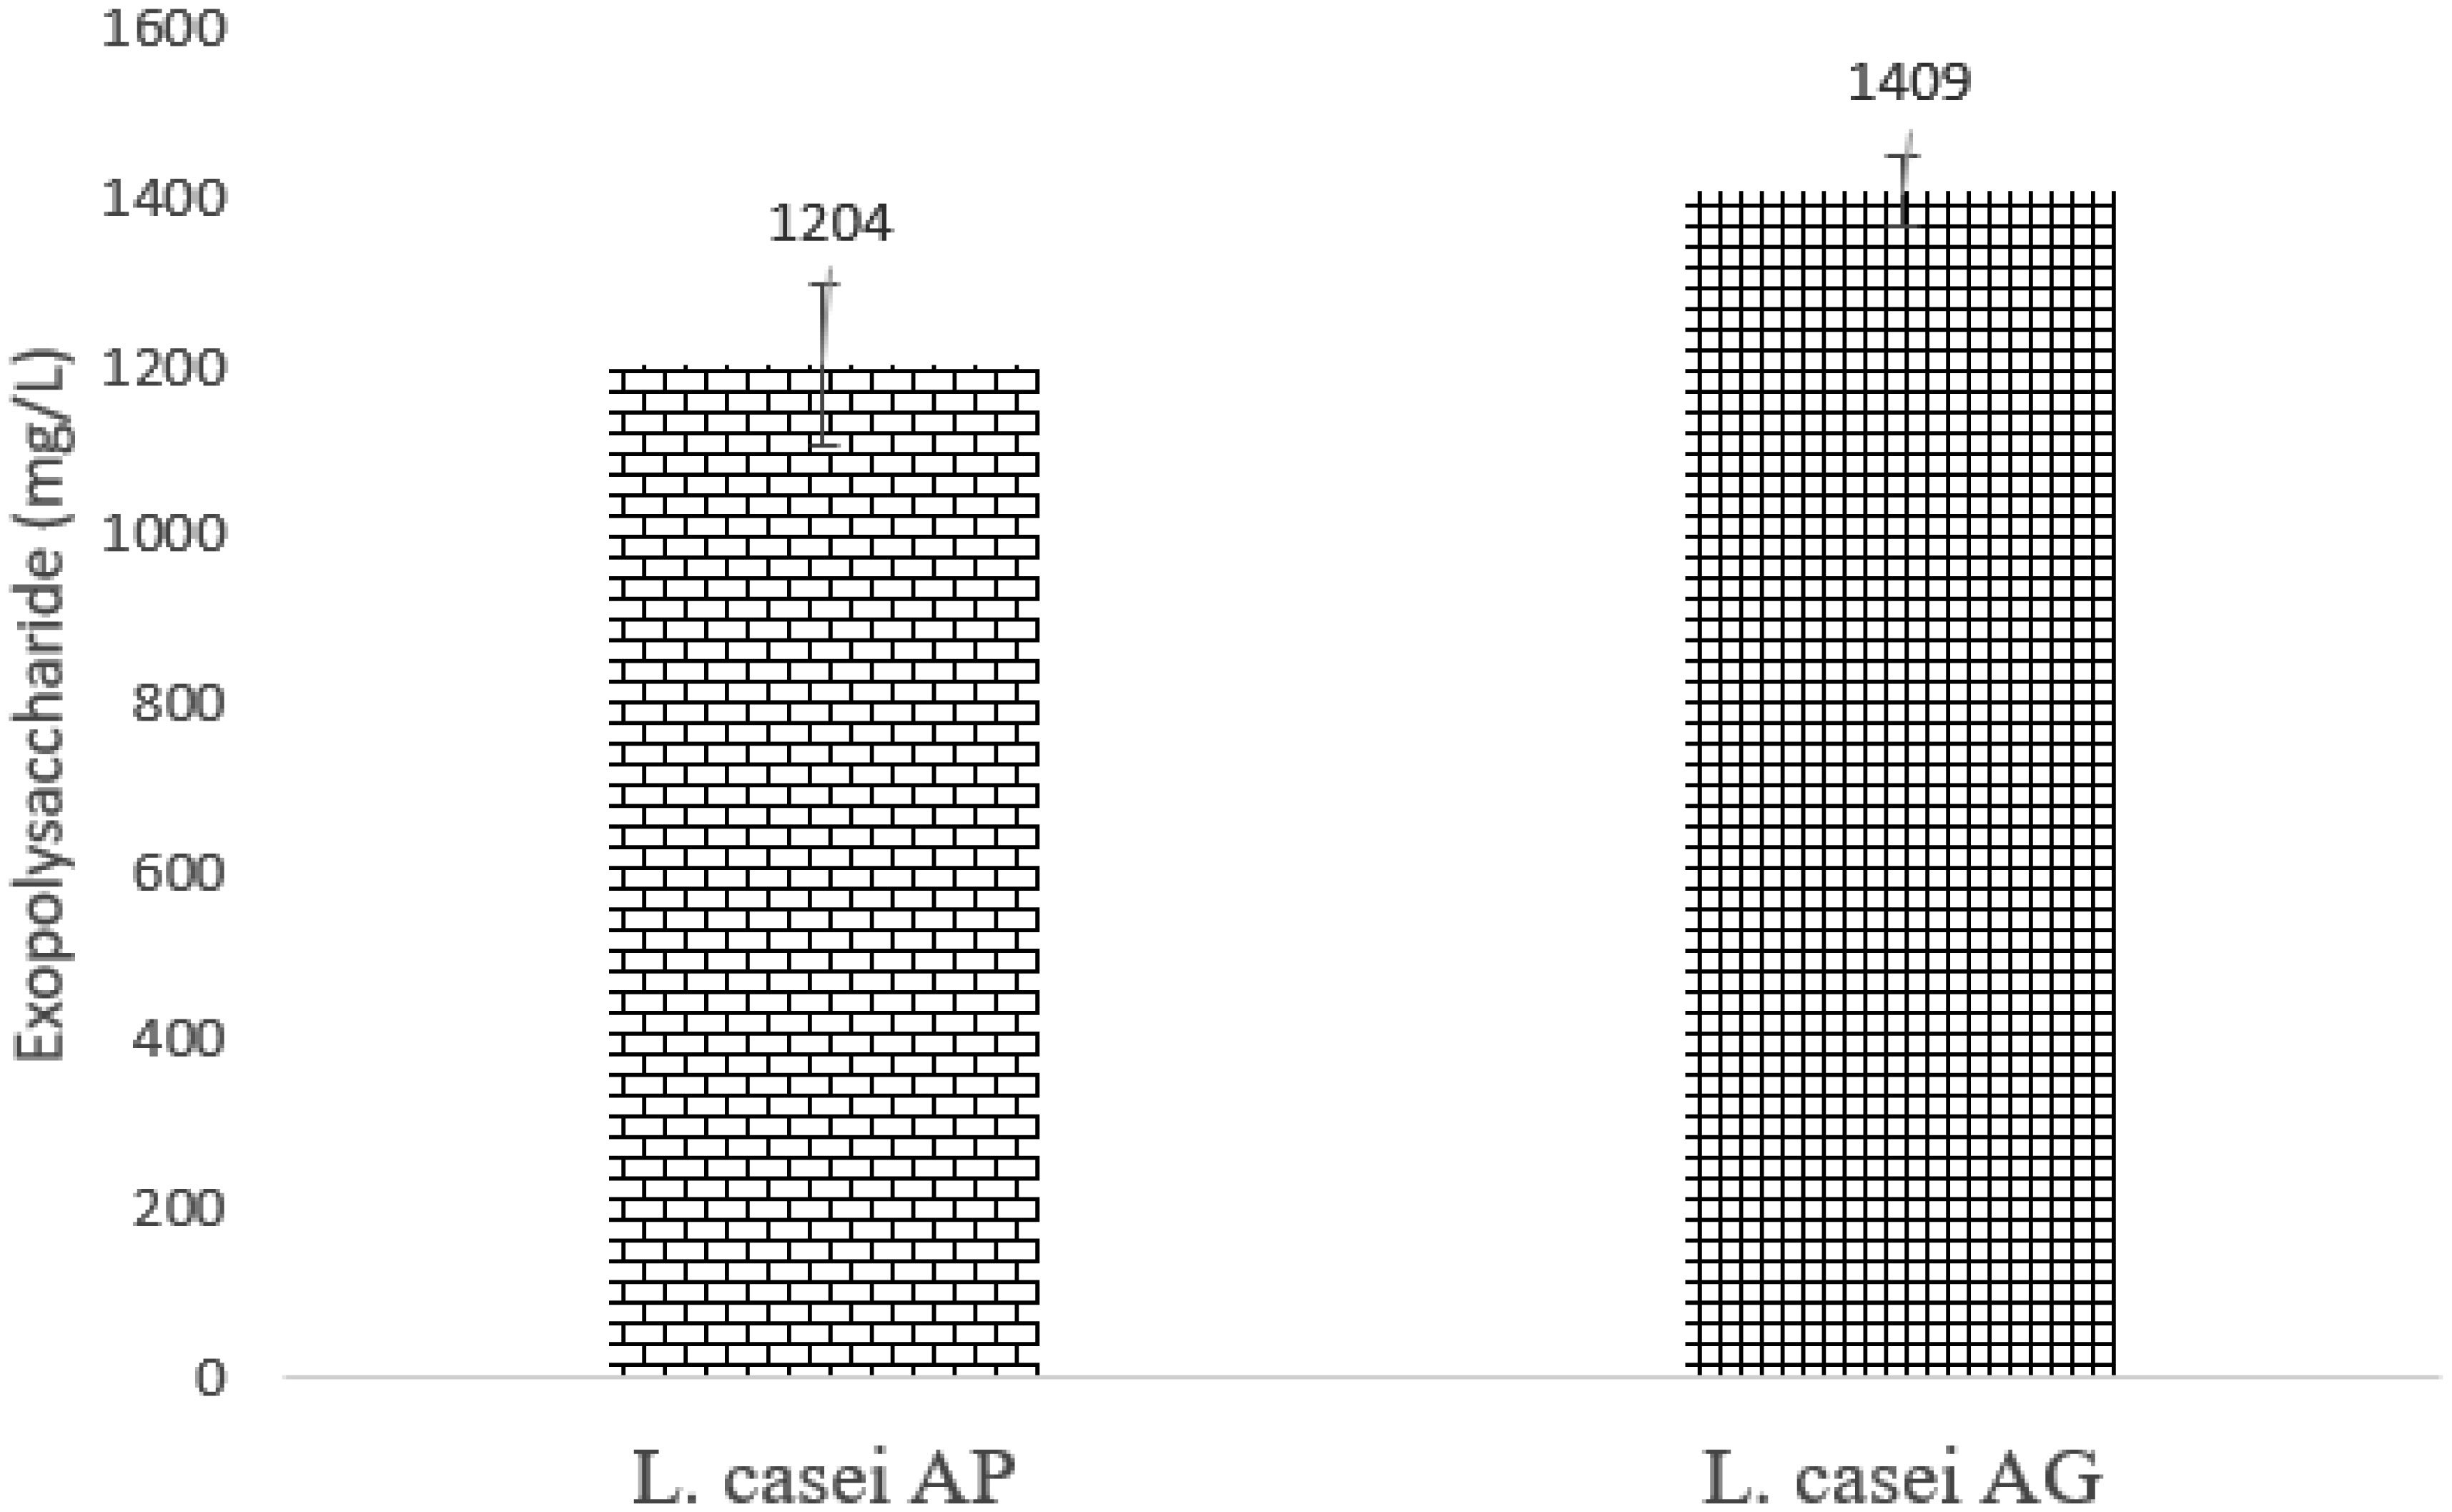
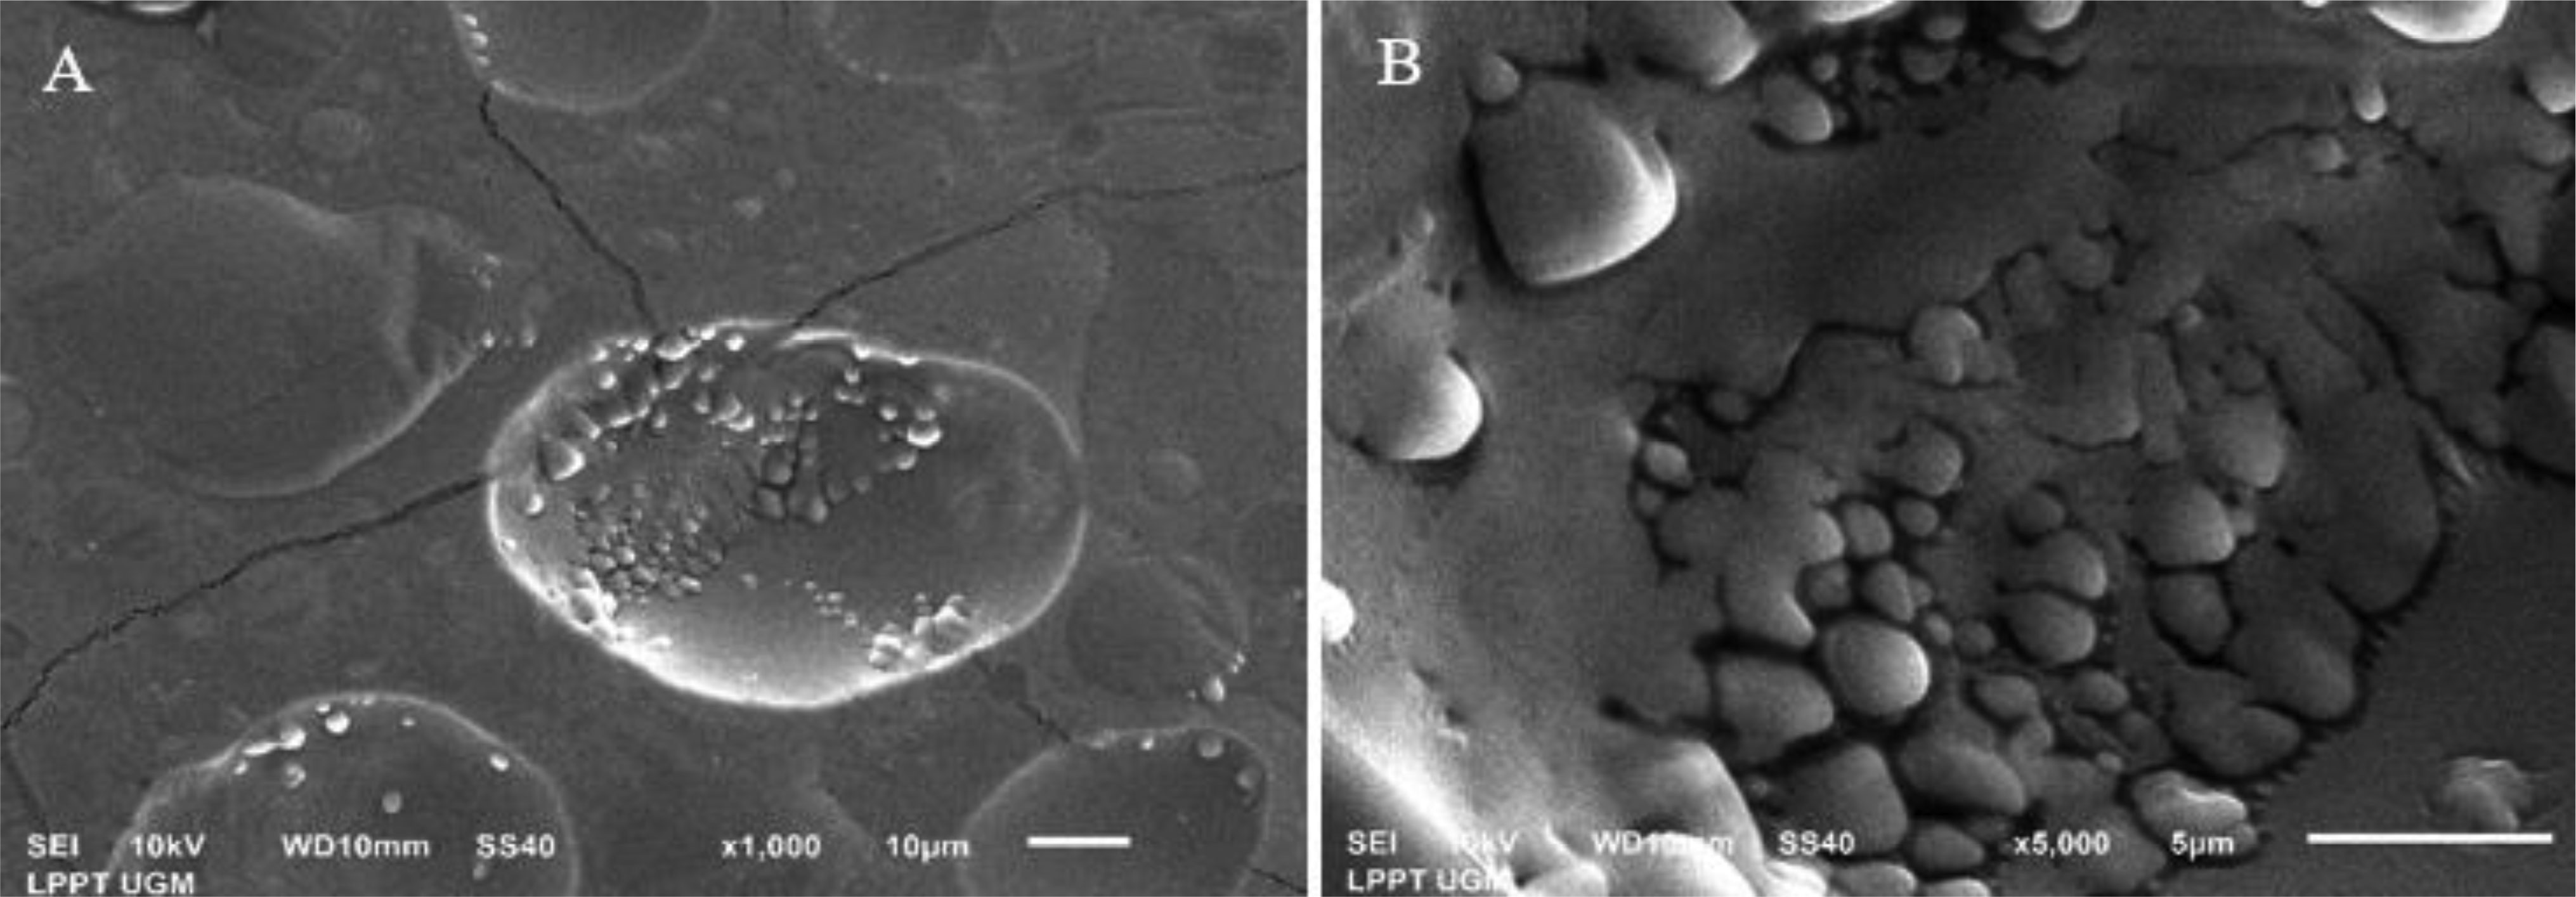
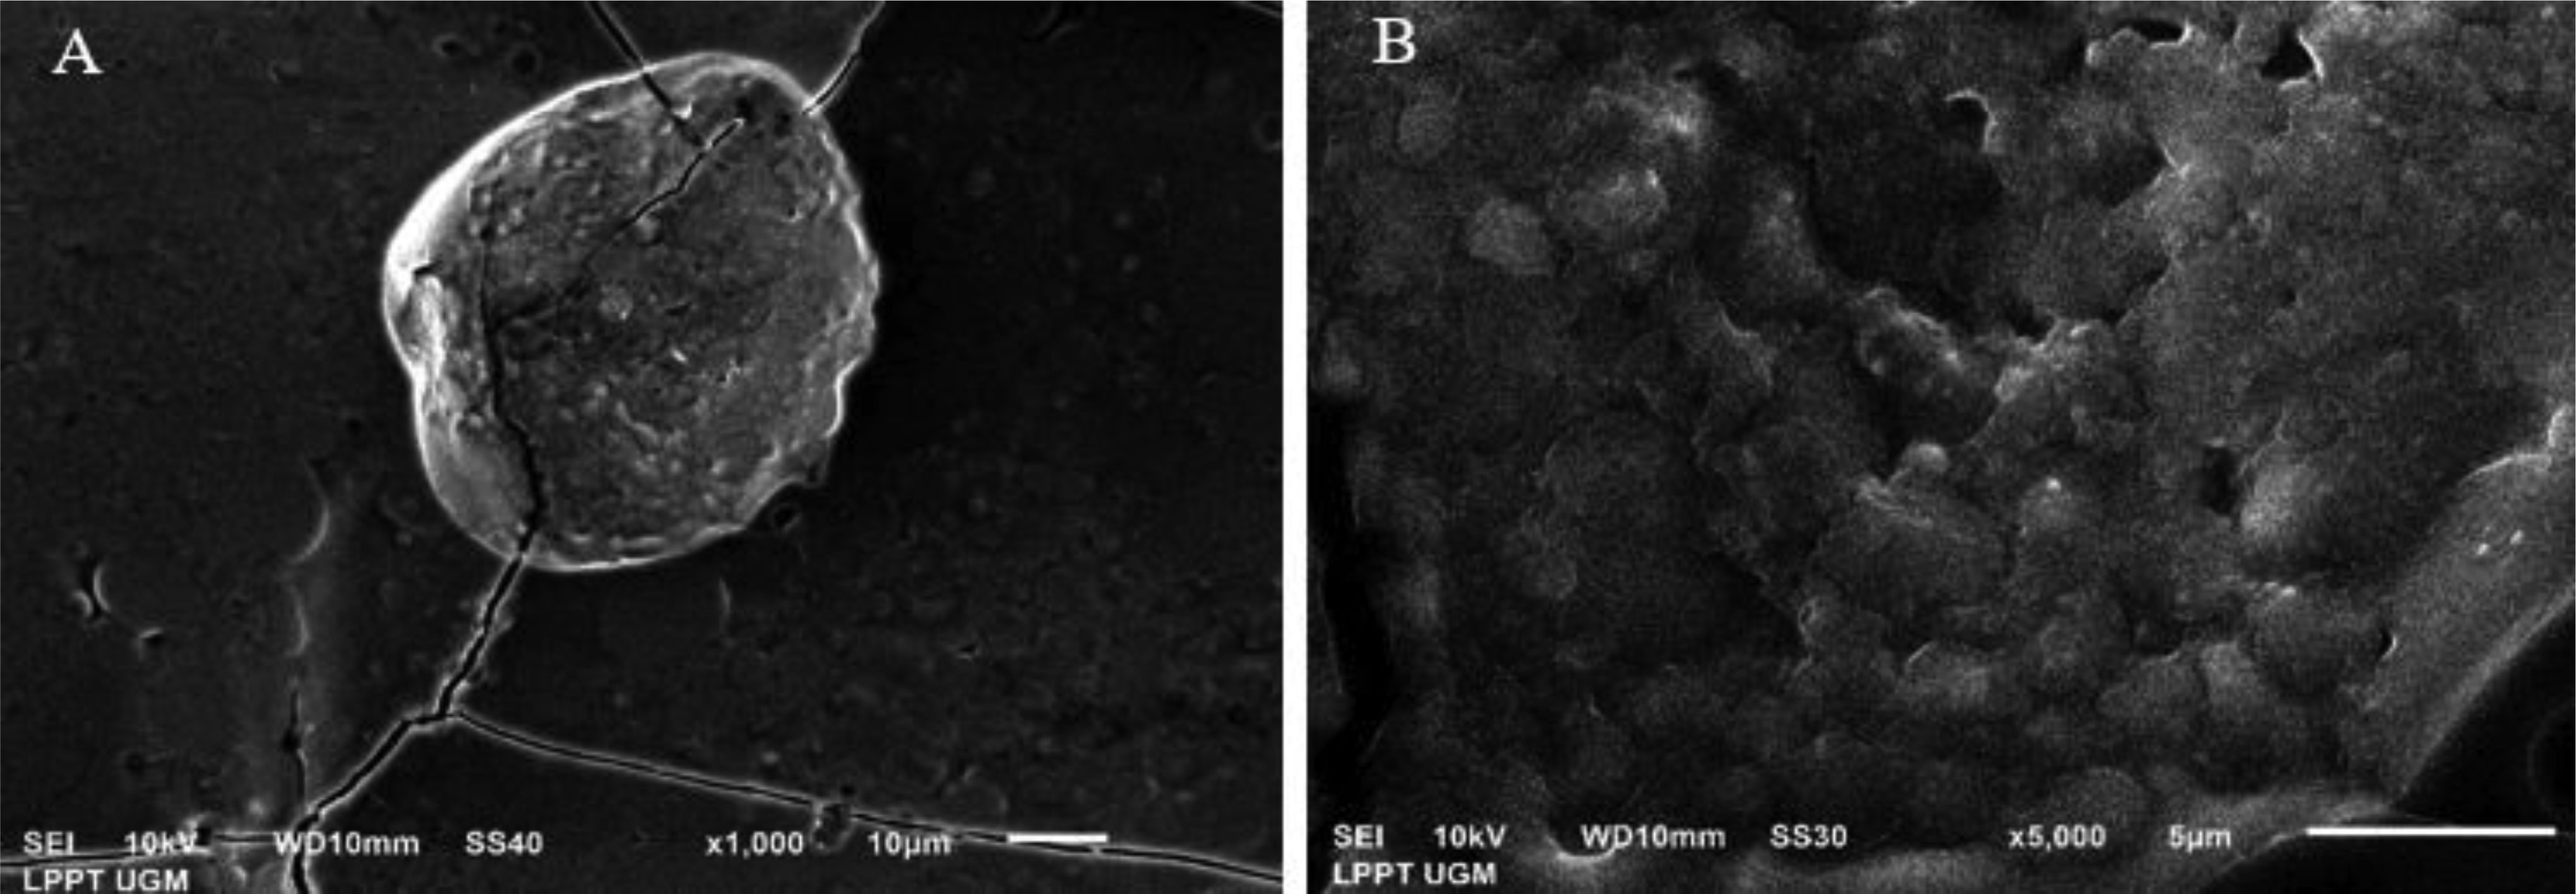
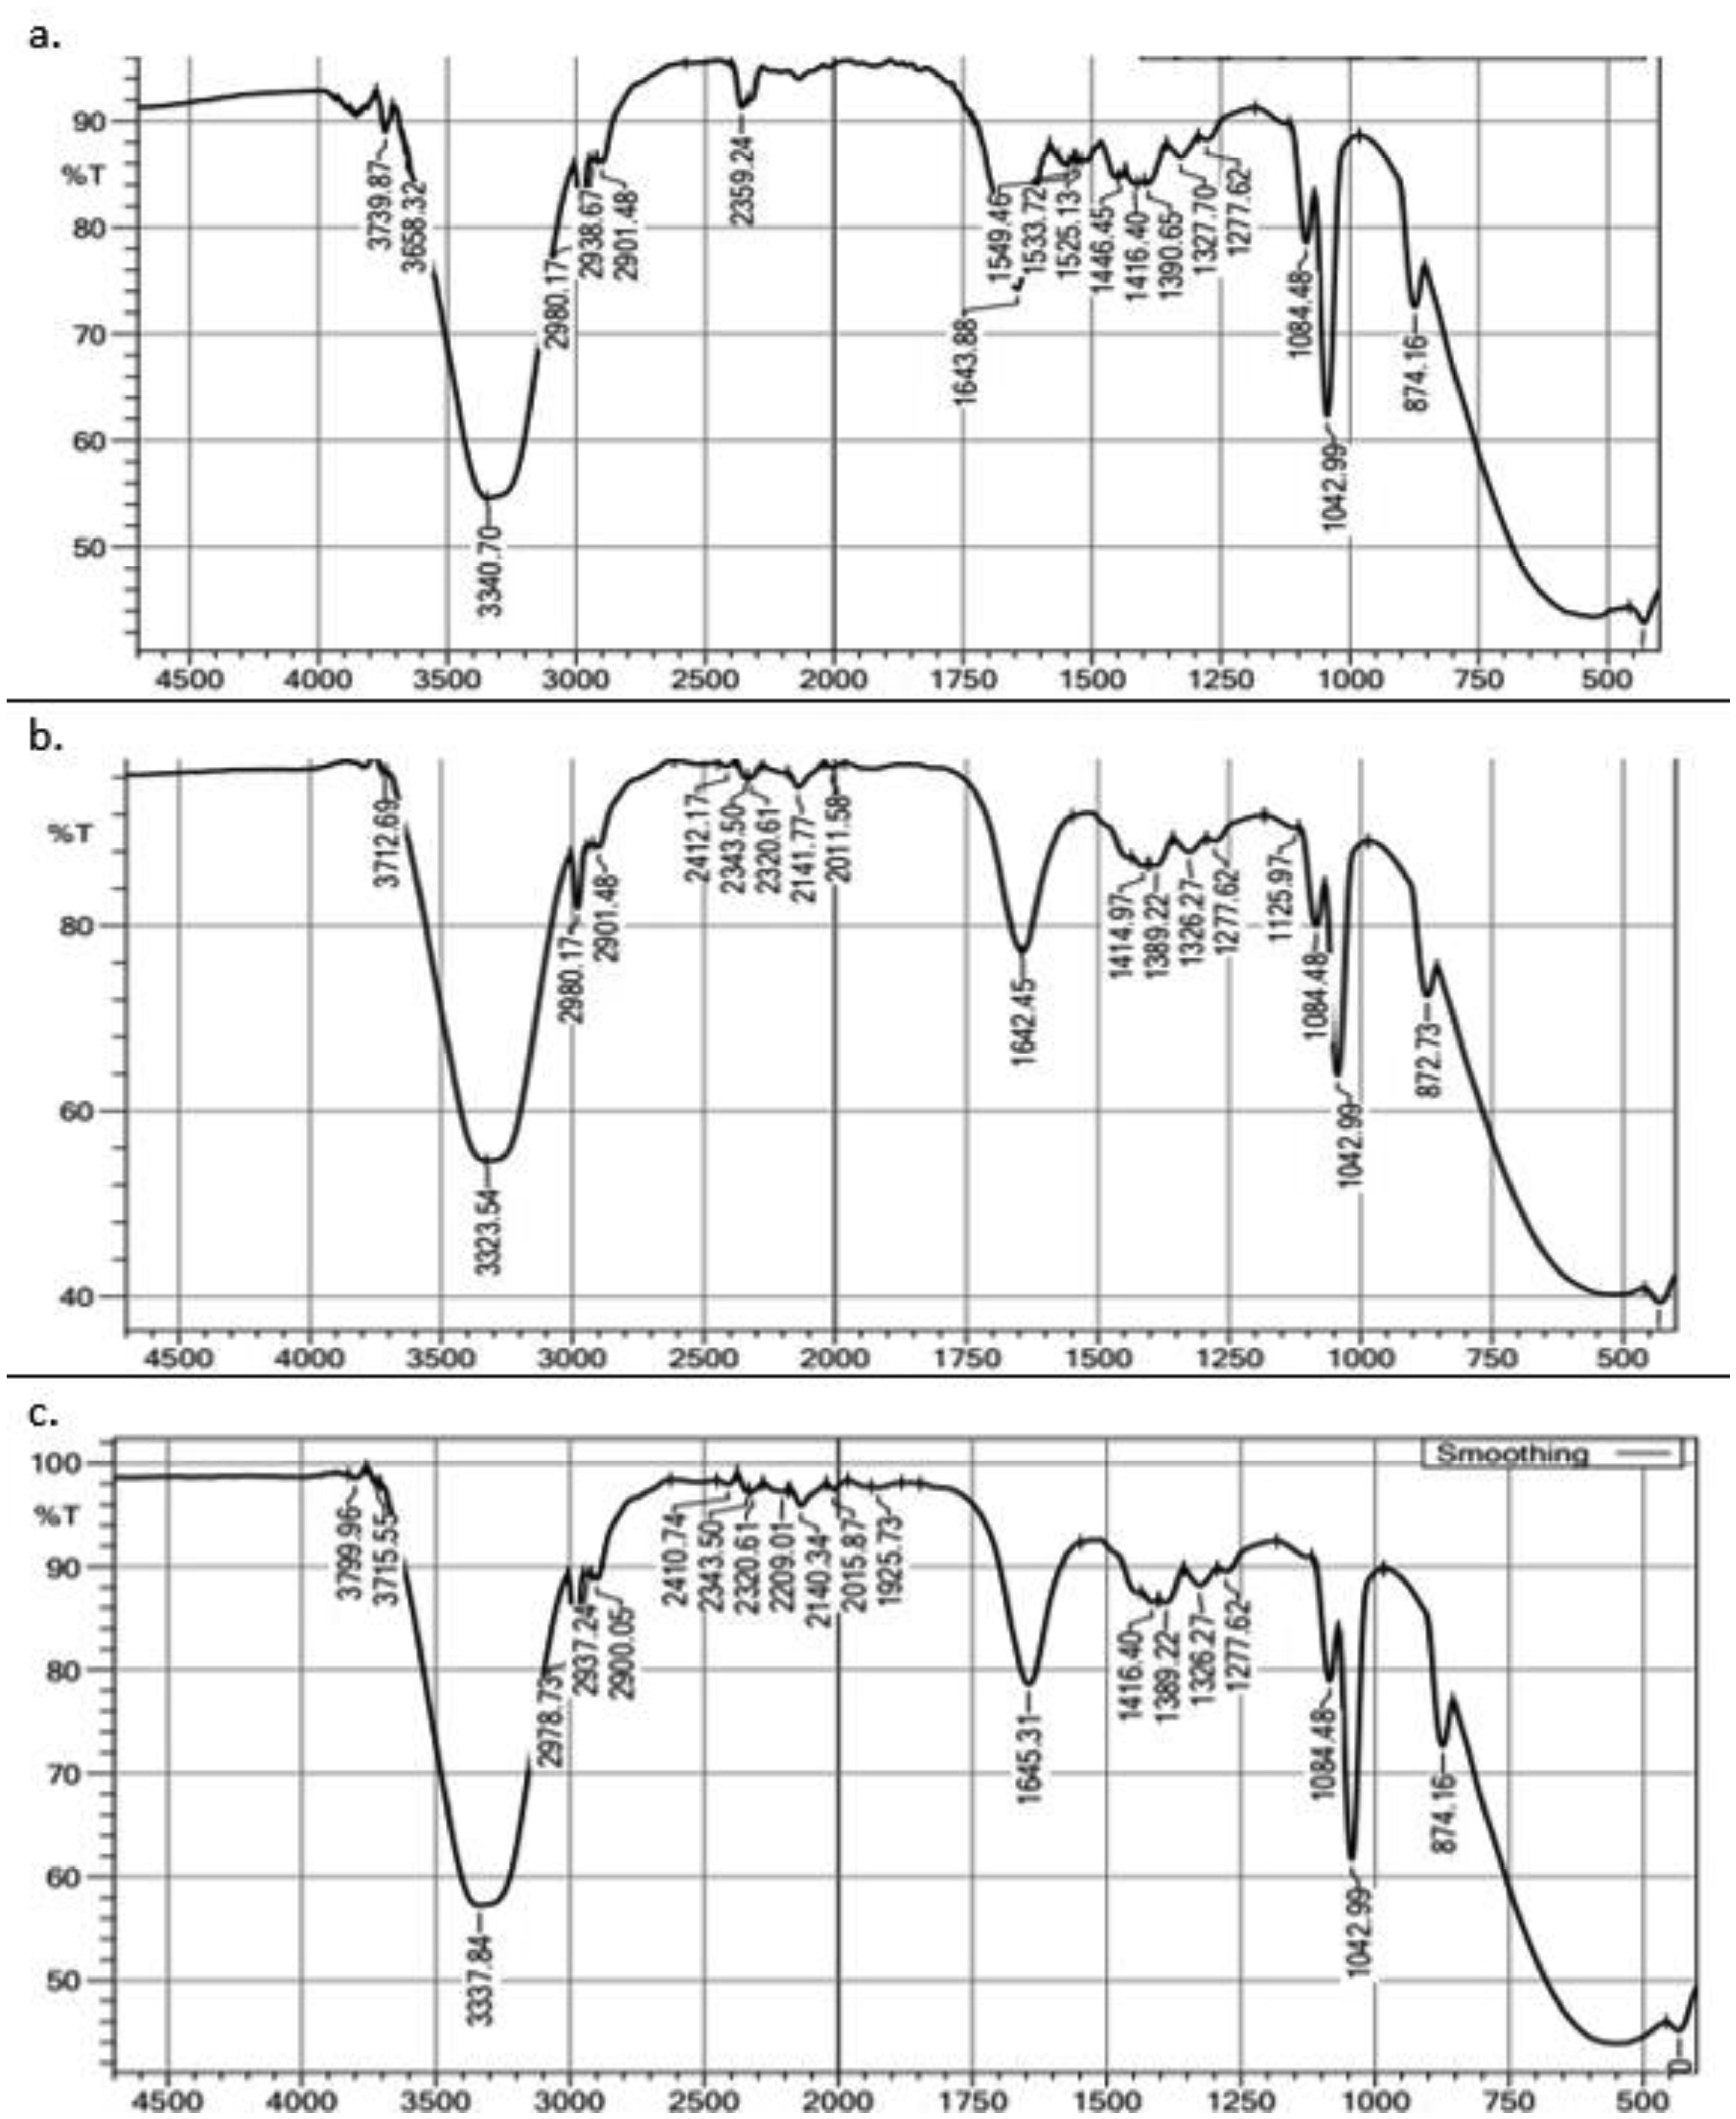
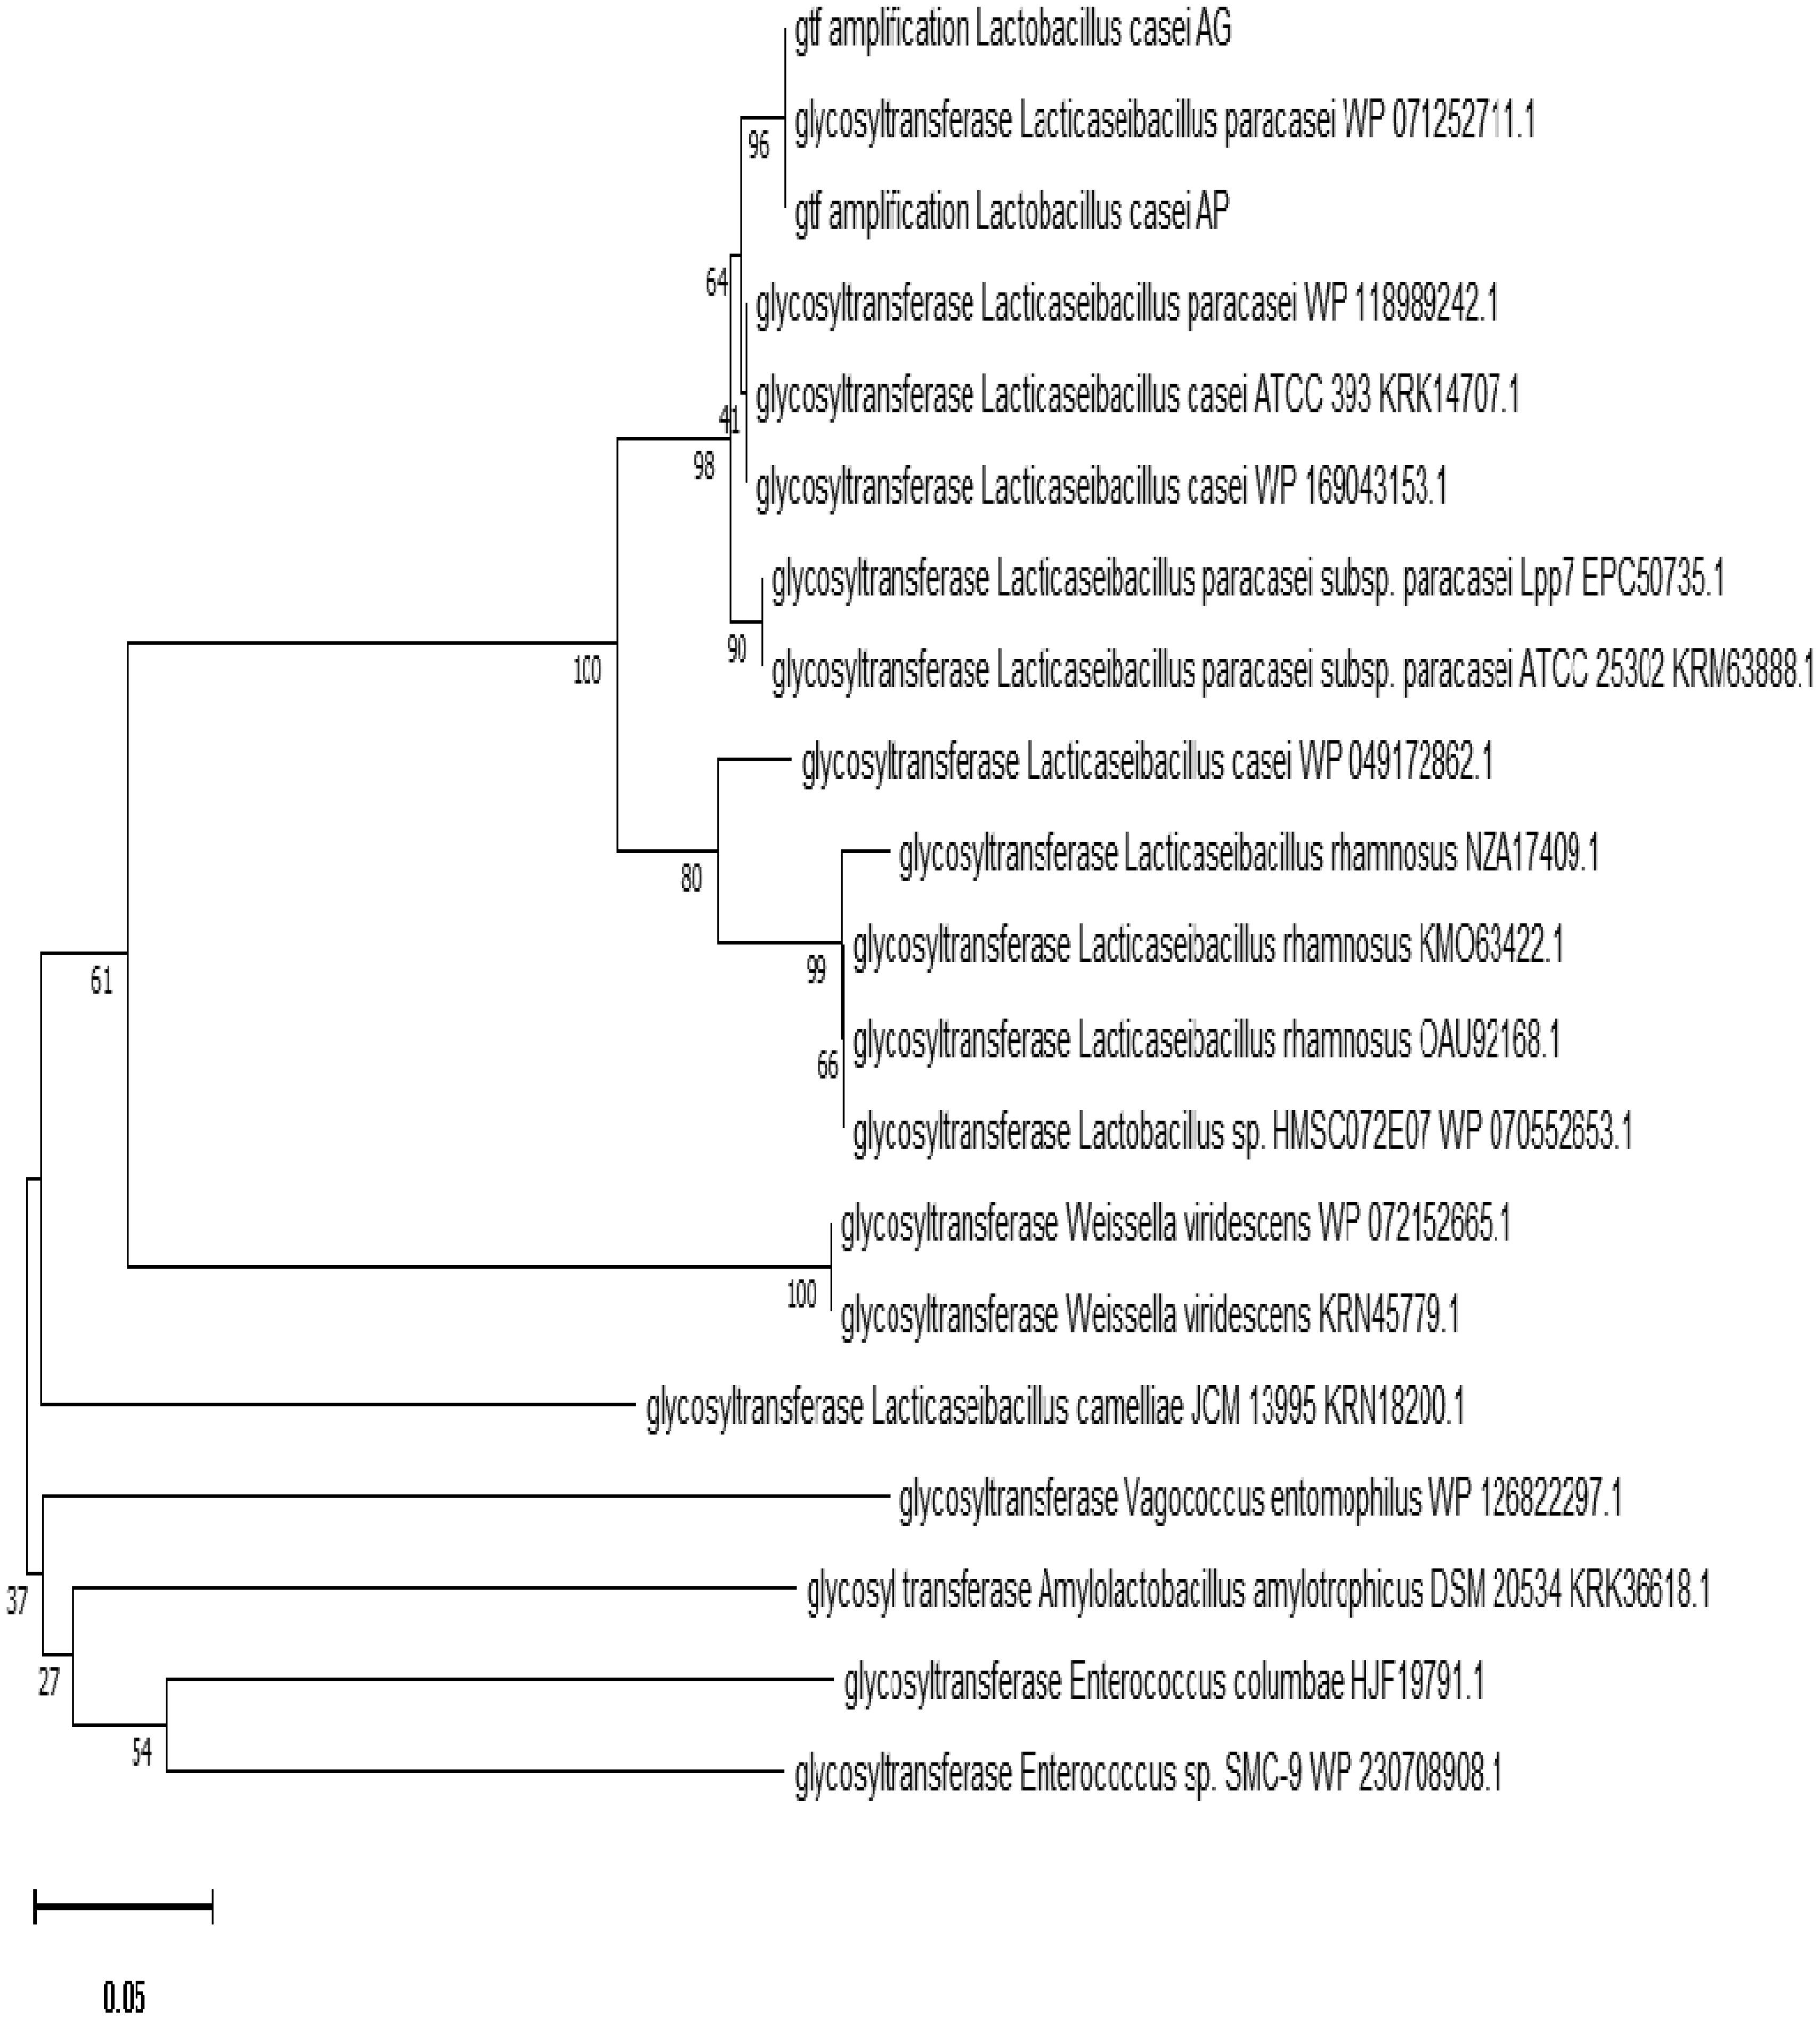
This study evaluated the ability of two strains of bacterial starter cultures, Lactobacillus casei AP (AP) and Lactobacillus casei AG (AG), to produce exopolysaccharides (EPSs). First, the physicochemical properties of the fermented milk produced by AP and AG were assessed, including physical qualities like viscosity and syneresis and chemical qualities, such as pH, acidity, protein, lactose, fat content, and total solid. Then, AP and AG's ability to produce EPS was measured. Additionally, the EPS' microstructure was observed using a scanning electron microscope, and its chemical structure was assessed using Fourier transform-infrared (FT-IR) spectroscopy. Also, AP and AG's ability to produce EPS was tracked at the molecular level by studying the glycosyltransferase (gtf) gene. Statistical analysis showed that the milk fermented using AP and AG had similar physicochemical qualities (P > 0.05) but significantly different physical qualities (P < 0.05). Additionally, the milk fermented with AP had lower viscosity (1137.33 ± 34.31 centiPoise) than AG (1221.50 ± 20.66 centiPoise). In addition, the milk fermented using AP had higher syneresis (19.42%) than AG (17.83%). The higher viscosity and lower syneresis in the milk fermented using AG were associated with AG's ability to produce more EPS (1409 mg/L) than AP (1204 mg/L). In addition, according to the FT-IR analysis, the AP- and AG-synthesized EPS contained absorption bands at 3323, 2980, 2901, 1642, 1084, 1043, and 873 cm−1. The absorption band at 1642 and 2980 cm−1 corresponds to carbonyl and methylene groups, respectively. Absorption band 873 cm−1 is characteristic of the α-glycosidic bond of α-glucan in EPS. Moreover, the absorption bands on the wavelength region corresponding to the functional groups in the AP- and AG-produced EPS were similar to those in commercially available EPS. Lastly, gtf, contributing to EPS synthesis, was found in the genomes of AP and AG, suggesting the role of glycosyltransferase in the EPS synthesis by both strains.
Citation: Hafidh Shofwan Maajid, Nurliyani Nurliyani, Widodo Widodo. Exopolysaccharide production in fermented milk using Lactobacillus casei strains AP and AG[J]. AIMS Microbiology, 2022, 8(2): 138-152. doi: 10.3934/microbiol.2022012
This study evaluated the ability of two strains of bacterial starter cultures, Lactobacillus casei AP (AP) and Lactobacillus casei AG (AG), to produce exopolysaccharides (EPSs). First, the physicochemical properties of the fermented milk produced by AP and AG were assessed, including physical qualities like viscosity and syneresis and chemical qualities, such as pH, acidity, protein, lactose, fat content, and total solid. Then, AP and AG's ability to produce EPS was measured. Additionally, the EPS' microstructure was observed using a scanning electron microscope, and its chemical structure was assessed using Fourier transform-infrared (FT-IR) spectroscopy. Also, AP and AG's ability to produce EPS was tracked at the molecular level by studying the glycosyltransferase (gtf) gene. Statistical analysis showed that the milk fermented using AP and AG had similar physicochemical qualities (P > 0.05) but significantly different physical qualities (P < 0.05). Additionally, the milk fermented with AP had lower viscosity (1137.33 ± 34.31 centiPoise) than AG (1221.50 ± 20.66 centiPoise). In addition, the milk fermented using AP had higher syneresis (19.42%) than AG (17.83%). The higher viscosity and lower syneresis in the milk fermented using AG were associated with AG's ability to produce more EPS (1409 mg/L) than AP (1204 mg/L). In addition, according to the FT-IR analysis, the AP- and AG-synthesized EPS contained absorption bands at 3323, 2980, 2901, 1642, 1084, 1043, and 873 cm−1. The absorption band at 1642 and 2980 cm−1 corresponds to carbonyl and methylene groups, respectively. Absorption band 873 cm−1 is characteristic of the α-glycosidic bond of α-glucan in EPS. Moreover, the absorption bands on the wavelength region corresponding to the functional groups in the AP- and AG-produced EPS were similar to those in commercially available EPS. Lastly, gtf, contributing to EPS synthesis, was found in the genomes of AP and AG, suggesting the role of glycosyltransferase in the EPS synthesis by both strains.

| [1] |
Djoković V, Krsmanović R, Božanić DK, et al. (2009) Adsorption of sulfur onto a surface of silver nanoparticles stabilized with sago starch biopolymer. Colloids Surf B Biointerfaces 73: 30-35. https://doi.org/10.1016/j.colsurfb.2009.04.022 
|
| [2] |
Tiwari S, Kavitake D, Devi PB, et al. (2021) Bacterial exopolysaccharides for improvement of technological, functional, and rheological properties of yoghurt. Int J Biol Macromol 183: 1585-1595. https://doi.org/10.1016/j.ijbiomac.2021.05.140
|
| [3] |
Ryan PM, Ross RP, Fitzgerald GF, et al. (2015) Sugarcoated: exopolysaccharide producing lactic acid bacteria for food and human health applications. Food Funct 6: 679-693. https://doi.org/10.1039/C4FO00529E
|
| [4] |
Korcz E, Varga L (2021) Exopolysaccharides from lactic acid bacteria: Techno-functional application in the food industry. Trends Food Sci Technol 110: 375-384. https://doi.org/10.1016/j.tifs.2021.02.014
|
| [5] |
Oerlemans MMP, Akkerman R, Ferrari M, et al. (2021) Benefits of bacteria-derived exopolysaccharides on gastrointestinal microbiota, immunity and health. J Funct Foods 76: 104289. https://doi.org/10.1016/j.jff.2020.104289
|
| [6] |
van Kranenburg R, van Swam II, Marugg JD, et al. (1999) Exopolysaccharide biosynthesis in Lactococcus lactis NIZO B40: functional analysis of the glycosyltransferase genes involved in synthesis of the polysaccharide backbone. J Bacteriol 181: 338-340. https://doi.org/10.1128/JB.181.1.338-340.1999
|
| [7] |
Yasuda E, Serata M, Sako T (2008) Suppressive effect on activation of macrophages by Lactobacillus casei strain Shirota genes determining the synthesis of cell wall-associated polysaccharides. Appl Environ Microbiol 74: 4746-4755. https://doi.org/10.1128/AEM.00412-08
|
| [8] |
Lamothe GT, Jolly L, Mollet B, et al. (2002) Genetic and biochemical characterization of exopolysaccharide biosynthesis by Lactobacillus delbrueckii subsp. bulgaricus. Arch Microbiol 178: 218-228. https://doi.org/10.1007/s00203-002-0447-x
|
| [9] |
Dertli E, Mayer MJ, Narbad A (2015) Impact of the exopolysaccharide layer on biofilms, adhesion and resistance to stress in Lactobacillus johnsonii FI9785. BMC Microbiol 15: 8. https://doi.org/10.1186/s12866-015-0347-2
|
| [10] |
Nguyen PT, Nguyen TT, Bui DC, et al. (2020) Exopolysaccharide production by lactic acid bacteria: the manipulation of environmental stresses for industrial applications. AIMS Microbiol 6: 451-466. https://doi.org/10.3934/microbiol.2020027
|
| [11] |
Badel S, Bernardi T, Michaud P, et al. (2011) New perspectives for Lactobacilli exopolysaccharides. Biotechnol Adv 29: 54-66. https://doi.org/10.1016/j.biotechadv.2010.08.011
|
| [12] | Wang KM, Niu D, Song X, et al. (2019) Preparation, partial characterization and biological activity of exopolysaccharides produced from Lactobacillus fermentum S1. J Biosci Bioeng 30: 1-9. https://doi.org/10.1016/j.jbiosc.2019.07.009 |
| [13] |
Silva LA, Lopes Neto JHP, Cardarelli HR (2019) Exopolysaccharides produced by Lactobacillus plantarum: technological properties, biological activity, and potential application in the food industry. Ann Microbiol 69: 321-328. https://doi.org/10.1007/s13213-019-01456-9
|
| [14] |
Zhang Z, Liu Z, Tao X, et al. (2016) Characterization and sulfated modification of an exopolysaccharide from Lactobacillus plantarum ZDY2013 and its biological activities. Carbohydr Polym 153: 25-33. https://doi.org/10.1016/j.carbpol.2016.07.084
|
| [15] |
Dinic M, Pecikoza U, Djokic J, et al. (2018) Exopolysaccharide produced by probiotic strain Lactobacillus paraplantarum BGCG11 reduces inflammatory hyperalgesia in rats. Front Pharmacol 9: 1. https://doi.org/10.3389/fphar.2018.00001
|
| [16] |
Rajoka MSR, Jin M, Haobin Z, et al. (2018) Functional characterization and biotechnological potential of exopolysaccharide produced by Lactobacillus rhamnosus strains isolated from human breast milk. LWT Food Sci Technol 89: 638-647. https://doi.org/10.1016/j.lwt.2017.11.034
|
| [17] |
Jeong D, Kim DH, Kang IB, et al. (2017) Characterization and antibacterial activity of a novel exopolysaccharide produced by Lactobacillus kefiranofaciens DN1 isolated from kefir. Food Control 78: 436-442. https://doi.org/10.1016/j.foodcont.2017.02.033
|
| [18] | Di W, Zhang L, Wang S, et al. (2017) Phsycochemical characterization and antitumor activity of exopolysaccharides produced by Lactobacillus casei SB27 from Yak Milk. Carbohydr Polym 1771: 15. https://doi.org/10.1016/j.carbpol.2017.03.018 |
| [19] |
Li W, Ji J, Rui X, et al. (2014) Production of exopolysaccharides by Lactobacillus helveticus MB2-1 and its functional characteristics in vitro. LWT Food Sci Technol 59: 732-739. https://doi.org/10.1016/j.lwt.2014.06.063
|
| [20] |
Dilna SV, Surya H, Girija AR, et al. (2015) Characterization of an exopolysaccharide with potential health-benefit properties from a probiotic Lactobacillus plantarum RJF4. LWT-Food Sci Technol 64: 1179-1186. https://doi.org/10.1016/j.lwt.2015.07.040
|
| [21] |
Ayyash MB, Abu-Jdayil P, Itsaranuwat C, et al. (2019) Characterization, bioactivities, and rheological properties of exopolysaccharide produced by novel probiotic Lactobacillus plantarum C70 isolated from camel milk. Int J Biol Macromol 144: 938-946. https://doi.org/10.1016/j.ijbiomac.2019.09.171
|
| [22] |
Trabelsi IN, Ktari S, Ben Slima, M, et al. (2017) Evaluation of dermal wound healing activity and in vitro antibacterial and antioxidant activities of a new exopolysaccharide produced by Lactobacillus sp. Ca6. Int J Biol Macromol 103: 194-201. https://doi.org/10.1016/j.ijbiomac.2017.05.017
|
| [23] |
Salazar N, Neyrinck AM, Bindels LB, et al. (2019) Functional effects of EPS-producing bifidobacterium administration on energy metabolic alterations of diet-induced obese mice. Front Microbiol 10: 1-12. https://doi.org/10.3389/fmicb.2019.01809
|
| [24] | Tok E, Aslim B (2010) Cholesterol removal by some lactic acid bacteria that can be used as probiotic. Microbiol Immunol 54: 257-264. https://doi.org/10.1111/j.1348-0421.2010.00219.x |
| [25] | Widodo W, Anindita NS, Taufiq TT, et al. (2014) Evaluation of two Lactobacillus strains as probiotics with emphasis in utilizing prebiotic inulin as energy source. Int Res J Microbiol 5: 33-40. http:/dx.doi.org/10.14303/irjm.2014.016 |
| [26] | Widodo W, Anindita NS, Taufiq TT, et al. (2012) Identification of Pediococcus strains isolated from feces of Indonesian infants with in vitro capability to consume prebiotic inulin and to adhere on mucus. Indones J Biotechnol 17: 132-143. https://doi.org/10.22146/ijbiotech.7859 |
| [27] | Tamime AY, Robinson RK (2007) Tamime and Robinson's Yogurt: Science and technology.. New York: Woodhead Publishing Limited and CRC Press LLC. https://doi.org/10.1201/NOE1420044539 |
| [28] | Plummer DT (1987) An introduction to practical biochemistry. Biochemical Education . London: McGraw-Hill Book Company 71. https://doi.org/10.1016/0307-4412(78)90089-4 |
| [29] |
Chandan RC (2006) Manufacturing yoghurt and fermented milk. USA: Blackwell Publishing. https://doi.org/10.1002/9780470277812
|
| [30] | Rodger B, Bridgewater L (2017) Standard methods for the examination of water and wastewater. Am J Public Health Nations Health 56: 387-388. https://doi.org/10.2105/AJPH.56.3.387 |
| [31] |
Keogh MT, dan O'Kennedy BT (1998) Rheology of stirred yogurt as affected by added milk fat, protein and hydrocolloids. J Food Sci 63: 108-113. https://doi.org/10.1111/j.1365-2621.1998.tb15687.x
|
| [32] | Kanamarlapudi SLRK, Muddada S (2017) Characterization of exopolysaccharide produced by Streptococcus thermophilus CC30. BioMed Res Int . https://doi.org/10.1155/2017/4201809 |
| [33] | Allain T, Chaouch S, Thomas M, et al. (2018) Bile-salt-hydrolases from the probiotic strain Lactobacillus johnsonii La1 mediate anti-giardial activity in vitro and in vivo. Front Microbiol 31: 1-15. https://doi.org/10.3389/fmicb.2017.02707 |
| [34] |
Provencher C, LaPointe G, Sirois S, et al. (2003) Consensus-degenerate hybrid oligonucleotide primers for amplification of priming glycosyltransferase genes of the exopolysaccharide locus in strains of the Lactobacillus casei group. Appl Environ Microbiol 69: 3299-3307. https://doi.org/10.1128/AEM.69.6.3299-3307.2003
|
| [35] | Walstra P, Wouters JTM, Geurts TJ, et al. (2006) Dairy science and technology. New York: CRC Press and Taylor & Francis Group. https://doi.org/10.1201/9781420028010 |
| [36] | Codex AlimentariusCodex standard for fermented milk (243-2003) (2006). Available from: https://www.fao.org/input/download/standards/400/CXS_243e.pdf |
| [37] | Widodo W, Handaka R, Wahyuni E, et al. (2017) The quality of fermented milk produced using intestinal origin lactic acid bacteria as starters. Int Food Res J 24: 2371-2376. Available from: https://www.researchgate.net/publication/322447234_The_quality_of_fermented_milk |
| [38] |
Fox PF, Uniacke-Lowe T, McSweeney PLH, et al. (2015) Physical properties of milk. Dairy chemistry and biochemistry . Switzerland: Springer International Publishing 321-343. https://doi.org/10.1007/978-3-319-14892-2_8
|
| [39] |
Farnworth ER (2008) Handbook of fermented functional foods. New York: CRC Press. https://doi.org/10.1201/9781420053289
|
| [40] | Gorska S, Hermanova P, Ciekot J, et al. (2016) Chemical characterization and immunomodulatory properties of polysaccharides isolated from probiotic Lactobacillus casei LOCK 0919. Glycobiology 27: 275-277. https://doi.org/10.1093/glycob/cww107 |
| [41] |
Lee IC, Caggianiello G, van Swam II, et al. (2016) Strain-specific features of extracellular polysaccharides and their impact on Lactobacillus plantarum-host interactions. Appl Environ Microbiol 82: 3959-3970. https://doi.org/10.1128/AEM.00306-16
|
| [42] |
Jolly L, Vincent SJF, Duboc P, et al. (2002) Exploiting exopolysaccharides from lactic acid bacteria. Antonie van Leeuwenhoek 82: 367-374. https://doi.org/10.1023/A:1020668523541
|
| [43] |
Pham PL, Dupont I, Roy D, et al. (2000) Production of exopolysaccharides by Lactobacillus rhamnosus and analysis of its enzymatic degradation during prolonged fermentation. Appl Environ Microbiol 66: 2302-2310. https://doi.org/10.1128/AEM.66.6.2302-2310.2000
|
| [44] | Ismail B, Nampoothiri KM (2010) Exopolysaccharide production and prevention of syneresis in starch using encapsulated probiotic Lactobacillus plantarum. Food Technol Biotechnol 48: 484-489. Available from: https://hrcak.srce.hr/61718 |
| [45] |
Braissant O, Decho AW, Przekop KM, et al. (2009) Characterization and turnover of exopolymeric substances in a hypersaline microbial mat. FEMS Microbiol Ecol 67: 293-307. https://doi.org/10.1111/j.1574-6941.2008.00614.x
|
| [46] |
Chowdhury SR, Basaka RK, Sen R, et al. (2011) Characterization and emulsifying property of a carbohydrate polymer produced by Bacillus pumilus UW-02 isolated from wastewater irrigated agricultural soil. Int J Biol Macromol 48: 705-712. https://doi.org/10.1016/j.ijbiomac.2011.02.019
|
| [47] |
Shankar T, Palpperumal S, Kathiresan D, et al. (2021) Biomedical and therapeutic potential of exopolysaccharides by Lactobacillus paracasei isolated from sauerkraut: screening and characterization. Saudi J Biol Sci 28: 2943-2950. https://doi.org/10.1016/j.sjbs.2021.02.030
|
| [48] |
Tieking M, Ganzle MG (2005) Exopolysaccharides from cereal-associated lactobacilli. Trends Food Sci Technol 16: 79-84. https://doi.org/10.1016/j.tifs.2004.02.015
|
| [49] |
Lairson LL, Henrissat B, Davies GJ, et al. (2008) Glycosyltransferases: Structures, Functions and Mechanisms. Annu Rev Biochem 77: 25.1-25.35. https://doi.org/10.1146/annurev.biochem.76.061005.092322
|
| [50] |
De Vuyst L, De Vin F, Vaningelgem F, et al. (2001) Recent developments in the biosynthesis and applications of heteropolysaccharides from lactic acid bacteria. Int Dairy J 11: 687-707. https://doi.org/10.1016/S0958-6946(01)00114-5
|
| [51] |
Boels IC, van Kranenburg R, Hugenholtz J, et al. (2001) Sugar catabolism and its impact on the biosynthesis and engineering of exopolysaccharide production in lactic acid bacteria. Int Dairy J 11: 723-732. https://doi.org/10.1016/S0958-6946(01)00116-9
|
| [52] |
Welman AD, Maddoz IS (2003) Exopolysaccharides from lactic acid bacteria: perspectives and challenges. Trends Biotechnol 21: 269-274. https://doi.org/10.1016/S0167-7799(03)00107-0
|
| [53] |
Lebeer S, Verhoeven TL, Francius G, et al. (2009) Identification of a gene cluster for the biosynthesis of a long, galactose-rich exopolysaccharide in Lactobacillus rhamnosus GG and functional analysis of the priming glycosyltransferase. Appl Environ Microbiol 75: 3554-3563. https://doi.org/10.1128/AEM.02919-08
|
| [54] |
Van Kranenburg R, Marugg JD, van Swam II, et al. (1997) Molecular characterization of the plasmid-encoded eps gene cluster essential for exopolysaccharide biosynthesis in Lactococcus lactis. Mol Microbiol 24: 387-397. https://doi.org/10.1046/j.1365-2958.1997.3521720.x
|
Figures(5) / Tables(2)

Hafidh Shofwan Maajid, Nurliyani Nurliyani, Widodo Widodo. Exopolysaccharide production in fermented milk using Lactobacillus casei strains AP and AG[J]. AIMS Microbiology, 2022, 8(2): 138-152. doi: 10.3934/microbiol.2022012


 DownLoad: