Research article

Automatic Detection of Cortical Bones Haversian Osteonal Boundaries

  • Received: 05 May 2015 Accepted: 13 October 2015 Published: 16 October 2015
  • This work aims to automatically detect cement lines in decalcified cortical bone sections stained with H&E. Employed is a methodology developed previously by the authors and proven to successfully count and disambiguate the micro-architectural features (namely Haversian canals, canaliculi, and osteocyte lacunae) present in the secondary osteons/Haversian system (osteon) of cortical bone. This methodology combines methods typically considered separately, namely pulse coupled neural networks (PCNN), particle swarm optimization (PSO), and adaptive threshold (AT). In lieu of human bone, slides (at 20× magnification) from bovid cortical bone are used in this study as proxy of human bone. Having been characterized, features with same orientation are used to detect the cement line viewed as the next coaxial layer adjacent to the outermost lamella of the osteon. Employed for this purpose are three attributes for each and every micro-sized feature identified in the osteon lamellar system: (1) orientation, (2) size (ellipse perimeter) and (3) Euler number (a topological measure). From a training image, automated parameters for the PCNN network are obtained by forming fitness functions extracted from these attributes. It is found that a 3-way combination of these features attributes yields good representations of the overall osteon boundary (cement line). Near-unity values of classical metrics of quality (precision, sensitivity, specificity, accuracy, and dice) suggest that the segments obtained automatically by the optimized artificial intelligent methodology are of high fidelity as compared with manual tracing. For bench marking, cement lines segmented by k-means did not fare as well. An analysis based on the modified Hausdorff distance (MHD) of the segmented cement lines also testified to the quality of the detected cement lines vis-a-vis the k-means method.

    Citation: Ilige Hage, Ramsey Hamade. Automatic Detection of Cortical Bones Haversian Osteonal Boundaries[J]. AIMS Medical Science, 2015, 2(4): 328-346. doi: 10.3934/medsci.2015.4.328

    Related Papers:

    [1] Mojtaba Azadbakht, Amir Yari, Paniz Fasih, Mohammad Nomani, Amirali Asadi . Rare mandibular condylar pathology and new surgical approach: intraoral approach for resection and reconstruction of aneurysmal bone cyst, a case report. AIMS Medical Science, 2020, 7(3): 79-89. doi: 10.3934/medsci.2020007
    [2] Manishtha Rao, Madhvi Awasthi . A review on interventions to prevent osteoporosis and improve fracture healing in osteoporotic patients. AIMS Medical Science, 2020, 7(4): 243-268. doi: 10.3934/medsci.2020015
    [3] Todd Lael Siler . Neurotranslations: Interpreting the Human Brain’s Attention System. AIMS Medical Science, 2016, 3(2): 179-202. doi: 10.3934/medsci.2016.2.179
    [4] Pasha Grachev, Robert L. Goodman . The GnRH Pulse Generator. AIMS Medical Science, 2016, 3(4): 359-385. doi: 10.3934/medsci.2016.4.359
    [5] Yves Edgard Henrotin . Avocado/Soybean Unsaponifiables (Piacledine®300) show beneficial effect on the metabolism of osteoarthritic cartilage, synovium and subchondral bone: An overview of the mechanisms. AIMS Medical Science, 2018, 5(1): 33-52. doi: 10.3934/medsci.2018.1.33
    [6] Wenyang Liu, Dan Ruan . Segmentation of Left Ventricle with a Coupled Length Regularization and Sparse Composite Shape Prior: a Variational Approach. AIMS Medical Science, 2015, 2(4): 295-302. doi: 10.3934/medsci.2015.4.295
    [7] Sanjay Konakondla, Steven A. Toms . Cerebral Connectivity and High-grade Gliomas: Evolving Concepts of Eloquent Brain in Surgery for Glioma. AIMS Medical Science, 2017, 4(1): 52-70. doi: 10.3934/medsci.2017.1.52
    [8] Teruo Sekimoto, Takamasa Tanaka, Tatsuya Shiraki, Renu Virmani, Aloke V. Finn . How does atherosclerotic plaque become calcified, and why?. AIMS Medical Science, 2024, 11(4): 421-438. doi: 10.3934/medsci.2024029
    [9] Nitin Chandra Mohan, Thomas W. Johnson . Role of intracoronary imaging in severely calcific disease. AIMS Medical Science, 2024, 11(4): 388-402. doi: 10.3934/medsci.2024027
    [10] Antonin Prochazka, Jan Zeman . Thyroid nodule segmentation in ultrasound images using U-Net with ResNet encoder: achieving state-of-the-art performance on all public datasets. AIMS Medical Science, 2025, 12(2): 124-144. doi: 10.3934/medsci.2025009
  • This work aims to automatically detect cement lines in decalcified cortical bone sections stained with H&E. Employed is a methodology developed previously by the authors and proven to successfully count and disambiguate the micro-architectural features (namely Haversian canals, canaliculi, and osteocyte lacunae) present in the secondary osteons/Haversian system (osteon) of cortical bone. This methodology combines methods typically considered separately, namely pulse coupled neural networks (PCNN), particle swarm optimization (PSO), and adaptive threshold (AT). In lieu of human bone, slides (at 20× magnification) from bovid cortical bone are used in this study as proxy of human bone. Having been characterized, features with same orientation are used to detect the cement line viewed as the next coaxial layer adjacent to the outermost lamella of the osteon. Employed for this purpose are three attributes for each and every micro-sized feature identified in the osteon lamellar system: (1) orientation, (2) size (ellipse perimeter) and (3) Euler number (a topological measure). From a training image, automated parameters for the PCNN network are obtained by forming fitness functions extracted from these attributes. It is found that a 3-way combination of these features attributes yields good representations of the overall osteon boundary (cement line). Near-unity values of classical metrics of quality (precision, sensitivity, specificity, accuracy, and dice) suggest that the segments obtained automatically by the optimized artificial intelligent methodology are of high fidelity as compared with manual tracing. For bench marking, cement lines segmented by k-means did not fare as well. An analysis based on the modified Hausdorff distance (MHD) of the segmented cement lines also testified to the quality of the detected cement lines vis-a-vis the k-means method.


    1. Introduction

    Medical microscopy continues to produce increasingly higher resolution images and presenting opportunities to observe ever more detailed microscopic pathologies. As compared with images handled manually, automatic segmentation of such information-rich images adds value due to the increased speed of data collection and reduction of observer subjectivity. Segmentation of high definition medical digital images facilitates the manipulation and visualization of data with automated methods can provide clinical data about ongoing processes that may go otherwise unnoticed [1]. Reported applications in image segmentation include: segmentation of features of interest [2], quantitative measurements of image features [3], delineation of contours and surfaces [4]. Computer image segmentation may facilitate the visualization of entities of interest for automated morphometry when there is no direct correspondence between the image pixel properties and the type of tissue e.g. detecting cancerous cells [5,6]. Specific to bone imaging, segmentation was used in numerous applications such as in calculating bone mineralization of extracted bone features ‎[7,8], determining bone mineral density ‎[9] and bone density using CT [10]), investigating tarsal bone kinematics [11], early osteoporosis ‎[12], and correlating bone features with age and osteoporosis [13,14].

    At the micro-scale, cortical bone is made-up mostly of concentric osteon units. Figure 1 illustrates the salient micro-features present in the osteon architecture. At the center of each osteon lies the Haversian canal. These canals are surrounded by concentric lamellae that are punctuated by micro-sized osteocyte lacunae that are in turn connected to each other via capillary channels called canaliculi leading to what is known as the lacuna-canalicular network (LCN). Consisting of remnants of osteons created by remodeling, so-called interstitial bone fills the space among osteons. Segregating osteons would require proper identification of their boundaries also known as cement lines.

    Figure 1. Micro-constituents of secondary osteon: Haversian canal (red), lacunae (yellow), clusters of canaliculi (green), solid matrix (purple), and estimated cement line (pink).

    Relatively few studies (e.g., [15,16]) report on segmenting bone microscopic images. While manual segregation of cortical bone into its basic Haversian osteonal units remains the golden standard (e.g., [17]), few studies have reported on segmentation via automated methods [2,12]. For example, k-means clustering is used [18] to segment micro radiographic bone image features such as Haversian canals and osteons. Computer-aided manual segmentation and volumetric 3D rendering are employed to visualize osteons in [19]. Segmentation of the LCN is preformed [20] through a variational region-growing based on an energy functional combining grey level information from the original image and shape information extracted via a 3D tube enhancement filter based on the eigenvalues of the Hessian method.

    In histology slides of cortical bones, cement lines are boundaries that surround osteons and demarcate them from adjacent, shapeless interstitial matrix. In decalcified sections, these boundaries are difficult to detect due to loss in mineralization of these highly mineralized lines via the decalcification processes. To the authors’ best knowledge, no work exists that reports on full automatic segmentation of cement lines to reveal Haversian osteons. This study aims to automatically identify osteon systems via computer-based segmentation in slides of femur cortical bone from a bovid (as a proxy for human bone). Previous work by Hage and Hamade [21] reported on automatic segmentation of cortical bone’s LCN. Micro-features (lacunae, canaliculi, Haversian canals) were segmented via color thresholding of bone images using the k-means clustering method. Later, the authors utilized an AI-based methodology that combined PCNN (pulse coupled neural networks), PSO (particle swarm optimization), and AT (adaptive threshold) and where PSO optimization fitness functions were constructed based on entropy and energy [22] or on the micro-sized features’ geometric attributes such as size and shape [23]. Both approaches yielded high fidelity feature segmentation of said salient micro features. The algorithm is comprised of several self-adapting parameters that are determined via utilizing particle swarm optimization (PSO) as parameter optimizer. Yet another variation utilized in this methodology is that of adaptive threshold (AT) where the PCNN algorithm is repeated until the best threshold, T, is found corresponding to the maximum variance between two segmented regions. In [24,25], Hage and Hamade utilize resultant segments for the purpose of replicating the microstructure of cortical bone and conducted micro-FEM simulations of bone cutting.

    In this work, the authors use a PCNN-PSO-AT methodology similar to that used in [22,23] but utilize novel optimization functions that are found to be better suited for the specific purpose of detecting cement lines. The authors first tried functions based solely on only one of the micro-feature attributes: orientation or Euler number. While these individual functions yielded good results, better results were obtained when using PSO function that utilizes a combination of these two attributes as well as one additional geometric attribute namely that of feature size. The results of PCNN-PSO-AT network obtained from a single training image are applied to several test images of bone slices resulting in high fidelity segmented images of cement line demarcations identifying individual osteons. To establish a bench line versus a well-known segmentation method, the 'k-means' method was also used to try to detect cement lines. For both methods, the quality of detected cement lines was compared against manually traced osteons. Quality is established using quantitative metrics as precision, sensitivity, specificity, accuracy, and dice. Furthermore, the modified Hausdorff distance (MHD) method was used to verify the quality of the segmented cement lines using our methodology vis-a-vis those detected by the k-means method.

    2. Materials and Methods

    2.1. Preparation of slides

    Two sections were cut in a transverse direction from the mid-diaphysis of a femur (2-year old bovine). They were kept in a saline solution for blood and bone marrow removal in order to obtain sections as seen in Figure 2a. These sections were cut into pieces (of about 1 cm × 1 cm) and immersed in a formalin solution for 3 days for softening and fixation purposes. EDTA solution was used for decalcifying the specimen for 3 days. After softening, 2 mm-thick sections of cortex were cut. This is followed by tissue processing on a Leica machine where slides are infiltrated with a sequence of different solvents followed by molten paraffin wax after dehydration. Slides are then placed in glass covers. 3-5µm thin sections are cut in a rotary microtome (model 340 E microm). Finally, slides are stained in H&E solution and covered with glass cover slip as shown in Figure 2b.

    Figure 2. a) Cortical bone specimen, b) optical glass cover slip containing bone specimen after cutting and pathologically prepared, c) typical optical slide (20×).

    2.2 Imaging

    Images of slices were acquired using a BX-41M LED optical Olympus microscope at 20× magnification using Olympus SC30 digital microscope camera (based on 3.3 megapixel CCD chip with CMOS color sensor). One such image is shown in Figure 2c.

    3. PCNN-PSO-AT Methodology

    A methodology developed by Hage and Hamade [22,23] is based on combining pulse coupled neural networks PCNN [26,27], particle swarm optimization PSO [28], and adaptive threshold AT [29,30] methods. Below is brief description of how these techniques work.

    3.1. Pulse coupled neural networks, PCNN

    PCNN is widely used for image segmentation. In order to properly identify and self-adapt the PCNN parameters, enhancements to its algorithm are sometimes applied by coupling to other techniques such as threshold adaptation and optimization. Mathematical formulations of the PCNN technique [26] are as listed in equations 1-5:

    1) Input part:

    Feeding input:

    Fij(n)=Sij+Fij(n1).eαF+VF.(W1Y(n1)ij) (1)

    Linking input:

    Lij(n)=Fij(n1).eαL+VL.(W2Y(n1)ij (2)

    2) Linking part:

    Uij(n)=Fij(n).(1+β.Lij(n)) (3)

    3) Pulse generator:

    Output:

    Yij(n)={1 if Uij(n)>Θij(n)0otherwise
    (4)

    Threshold:

    θij(n)=θij(n1).e(θ)+Vθ.Yij(n1) (5)

    The feeding (F) receives an external stimulus (S) as well as local stimulus (Y). The linking (L) receives local stimulus. These compartments are linked via a linking coefficient β to create a voltage U that is then compared to a local dynamic threshold θ and an output (0 or 1) is extracted. The dynamic threshold value increases via the potential coefficients VL, VF, Vθ but then decreases with the decaying coefficients αL, αF, αθ until the neuron fires again and a binary pulse image is created (where n is the iteration step) [26]. The PCNN algorithm is summarized in Figure 3 ([27]).

    Figure 3. PCNN Scheme showing the linking and feeding compartment, their linking, and output firing [27].

    3.2. Particle swarm optimization, PSO

    Particle swarm optimization (PSO) simulates a population with particles assigned randomized velocity. Each particle flies through an n-dimensional search space and maintains: current position and velocity as well as particle-specific best position. Particle reaches the best position when it flies over the best positions [28]. PSO parameters are: fitness function, dimension of particle, population size, inertia factor, and terminal condition of the algorithm. The PSO algorithm is schematically summarized in Figure 4.

    Figure 4. PSO algorithm.

    3.3. Adaptive threshold, AT

    Adaptive thresholding is a threshold selecting method built on the basis of analyzing the least square method [29]. Two categories are divided according to gray scale namely C0: {0, 1, …, t} and C1: {t+1, t+2, …, L−1}. The probability and mean-value layer of the categories C0 and C1 are calculated in order to get the variances, the class-inner variance and, finally, the between-class variance. The best threshold T is determined when the variance between 2-segmented regions is the maximum [30]. The PSO algorithm is outlined in Figure 5.

    Figure 5. AT algorithm.

    3.4. The combined PCNN-PSO-AT methodology

    In this paper, the combined methodology is used in a fashion similar to that developed in [22,23]. Initially and for the purpose of osteon detection, PSO fitness functions were utilized based solely on feature orientation (explained in Section 4.1.1). It was found, however, that fitness functions based on combining the three attributes: orientation, Euler number (Section 4.1.2) and size (Section 4.1.3) yields higher fidelity segmentations of cement lines. After building the fitness functions, the algorithm is run according to the steps illustrated in the flowchart (Figure 6). The attribute generator for image properties is the "regionprops" function in MATLAB® which utilizes the orientation attribute and calculates Euler number and perimeter attributes.

    Figure 6. The PCNN-PSO-AT methodology.

    4. Identification of Osteon Boundaries (cement lines)

    In this Section, demonstrations of cement lines segmentations are presented based on the PCNN-PSO-AT methodology. Segmentation is based on utilizing fitness functions that employ three feature attributes: orientation, Euler number, and size (perimeter of fitted ellipse) as presented in Section 4.1.

    4.1. Feature attributes

    4.1.1. Orientation (feature vector direction)

    Micro-sized LCN features are observed to be disposed in concentric bands surrounding the Haversian canal with an exterior band being the cement line. These micro-features share similar orientations along specific bands, a fact employed in using this orientation attribute to formulate fitness functions for segmenting osteons. Orientation of each object in the image is calculated using “regionprops” of MATLAB®. The fitness function is built based on maximizing the identified number of features having the same orientation. Thus a ratio parameter is developed by dividing the number of regions with orientations containing more than 2 objects to the total number of objects identified in an image. Maximizing the ratio value towards unity means that the PCNN have identified multiple features with associated orientations, i.e., identified osteons and excluded single oriented features having random orientations. The fitness function is given the target ratio:

    r=nN (6)

    Where n refers to the number of regions having more than 2 objects with the same orientation and N stands for the total number of regions in the image.

    The code for orientation finds the number of regions having more than 2 objects with same orientations as well as the total number of regions in the image. Based on those 2 parameters, values of ratio r are calculated. Figure 7 represents a hypothetical simulation of this method. Considered are cases of: 6 objects having same orientation 0º and 2 at 90º; 2 objects having same orientation of 0º and 3 objects at 90º; 2 objects at same orientation 30º and 1 object at 90º (excluded is 1 object having orientation −30º). In this figure, the total number of regions with objects having more than 2 identical orientations is 16: 8 objects of 0º degree orientation, 6 objects of 90º orientation, and 2 objects of 30º orientation. With total number of objects of 17, the ratio is calculated as r=8+6+28+6+2+1=1617=0.941.

    Figure 7. Simulation representing four hypothetical cases of micro-structural features with various orientation schemes.

    The algorithm aims to maximize r toward unity so that all objects with single orientations are excluded thus retaining keeping only regions that consists of multiple objects orientations that represent the osteon system. This ratio instructs the fitness function to find and extract the objects having more than 2 regions with same orientation. The target is limited to a minimum of 2 regions since osteons in the first stage of growth have at least one Haversian canal and one lacuna. The algorithm attempts to exclude regions with single orientations outside of the osteon.

    4.1.2. Euler number

    Euler number is a scalar that specifies the number of objects in a region minus the number of holes. Given cortical bone’s porosity-dominated topology, Euler number is an appropriate feature employed here to detect cement lines. MATLAB’s "regionprops” was used for this purpose.

    4.1.3. Size (of the perimeter of fitted ellipses)

    Cement lines have the largest perimeter in bone images since they surround the largest concentric layer of lamella. Size attribute is based on automated image approximate fits of cement lines shapes into ellipses. Therefore, perimeter lengths are estimated based on [23]

    Perimeter=π(2(a2+b2)) (7)

    Wherea and b are the major and minor axes, respectively, of the ellipse, the values of which are estimated using the ‘major/minor axis length’ property of the “regionprops” function in the image processing toolbox of MATLAB®.

    4.2. Combination of attributes: orientation, Euler number, and size

    In order to obtain enhanced pulses for detecting the cement line, introduced and tested here is a method that uses a combination of the three fitness functions based on the feature attributes discussed above: orientation, Euler number, and geometric size. The combination of three fitness functions aims to find the largest perimeter of concentric lamellae, e.g. cement line. An H&E-stained image is manually segmented to reveal the cement lines and their corresponding mean perimeter, orientation and Euler number. Said image is used for training as a target for the PSO fitness function. The PCNN-PSO-AT algorithm attempts to identify the 7 PCNN parameters that best match the combined target of that of the PSO fitness function. Found parameters are tested on other images.

    4.2.1. PCNN-PSO-AT cement line segmentation results

    Results for the combined fitness functions are summarized in Figure 8 and their corresponding PCNN parameters are listed in Table 1. The first and third columns in Figure 8 show the original images that are to be segmented, where image 1 in the 1st row is the training image and the other 7 images on the remaining rows are test images. The second and last columns represent the cement lines segments obtained using PCNN with the assigned parameters in Table 1.

    Figure 8. Resultant pulses for PCNN-PSO-AT fitness function using combinations of orientation, Euler number, and size: first and third columns show the original images, second and last columns represent the segmented resultant images.
    Table 1. PCNN parameters for fitness function using combinations of orientation, Euler number, and size.
    αlαfαθVlVfVθβ
    Cement lines-0.0851 0.2754 0.03610 -0.42187-0.5186 0.3903-0.4904
     | Show Table
    DownLoad: CSV

    The cement lines play an important role in separating the osteon system from the interstitial regions (cement lines separate newly formed osteons from old interstitial regions). The following section 4.2.2 explains how the cement lines of images in Figure 8 are isolated by extracting their boundaries and widening these boundaries using the "imdilate" function in MATLAB®, an image processing toolbox that thickens bright objects in binary images using the specified structuring element that determines the shape of a pixel neighborhood over which the maximum is taken [31]. The resultant segments in Figure 8 show these demarcating lines as being brighter than their surroundings. This accomplishment is due to the fundamental characteristic of PCNN that is to return output pulse images with plenty of information on the original image such as texture [32].

    4.2.2. Benchmarking of PCNN-PSO-AT methodology against k-means method

    A baseline segmentation method is used to benchmark against the methodology results found in 4.2.1 against those obtained by a (special approach) of the k-means clustering method. A criterion proposed by Deng et al. [33] where the derivation of pixels is obtained from color quantization. The color information in each image region has a uniformly distributed color-texture pattern as represented by few quantized colors and are distinguishable across 2 regions. In order to capture cement lines in white, class labels set at 5 as can be seen from the 5 colors in the segmentation maps in Figure 9. The figure shows the resultant segments obtained using the k-means method (numbers 1-8 correspond to the image numbers in Figure 8). The first and third columns show the segmentation maps obtained using k-means method, while the second and last columns represent the resultant cement lines segmented (in white). Visually contrasting the images in Figures 8 and 9 reveals that k-means did not reveal the osteon's cement lines as clearly as when employing the PCNN-PSO-AT methodology.

    Figure 9. Resultant cement line segments based on the k-means method (as developed in [33]), first and third columns show the segmentation maps using the methodology in [33], second and last columns represent the segments obtained using k-means.

    Since cortical bone’s osteon minimum diameter is reported to be about 40 µm [34], cement lines of resultant images in Figure 8 with lengths of major axis exceeding 40 µm are isolated causing all pixels outside and inside the widened/thickened boundaries to turn dark. Overlaying the output over the matrix resulted in the segments in the last column in Figure 10 that show the obtained cement lines demarcating secondary osteons from the matrix.

    Figure 10. Resultant segmented images showing in columns #1: original images, #2: resultant segmented images extracted from PCN-PSO-AT, #3: fitted ellipses plotted on top of extracted cement lines, #4: thickened cement lines, #5: cement lines from manual segmentation, #6: matrix obtained from [23], and #7: cement lines overlaid on the matrix.

    The 1st column in Figure 10 represents the original images, the 2nd column shows the extracted cement lines boundaries, the 3rd column shows the fitted ellipses plotted on top of the extracted cement lines, the 4th column shows the thickened extracted cement line boundaries using "imdilate", the 5th column exhibits the cement lines obtained using manual segmentation, the 6th column shows the resultant segmented matrix obtained using the methodology developed in [23] and the 7th column represents the overlay of the extracted thickened cement lines (from 4th column) on the matrix segments (6th column). A visual comparison between the 4th and 5th columns in Figure 10 indicates that the resultant cement lines are quite comparable to those segmented manually. Nevertheless, a quantitative evaluation is performed as proof of this similarity as is done in the following Section.

    5. Quality Assessment of Identified Osteon Boundaries

    The main goal of segmentation algorithms is to capture as accurately as possible features of interest, herein cement lines. In 5.1, classical quality metrics widely used for image segmentation evaluation namely precision rate, sensitivity, specificity, accuracy, and dice [35,36,37,38] are used to quantify the efficacy of the proposed methodology. As values of these metrics approach unity, the closer the segmentation method is to approaching the ground truth (taken here as manual segmentation). The results of another quality evaluation are also presented in 5.2 namely those of the modified Hausdorff distance (MHD) method.

    5.1. Classical quality metrics

    In order to calculate these metrics, a pixel comparison between the resulting segmentation images to ground truth ideal (manual) segmented images is accomplished through the calculation of true positive pixels (TP), false positive pixels (FP), false negative pixels (FN), and the true negative pixels (TN) (see [23] for more details).

    Precision=TP/(TP+FP) (8)
    Recall=Sensitivity=TP/(TP+FN) (9)
    Specificity=TN/(FP+TN) (10)
    Accuracy=(TP+TN)/(TP+FP+FN+TN) (11)
    Dice=2precisionrecall/(precision+recall)=2TP/(TP+FP)+(TP+FN) (12)

    In order to evaluate the performance of the combination method, the evaluation is conducted comparing with manually segmented cement line images. Similarly, k-means are compared to manually segmented results. In addition, an evaluation of the extracted cement lines boundaries in Figure 10 is presented against manually-drawn cement line segments (second column in Figure 10) with the results reported in Table 2.

    Table 2. Metrics for evaluating the quality of resulting cement line segments for the combination fitness function of the k-means, PCNN-PSO-AT methodology and the extracted cement lines (PCNN-PSO-AT).
    ImagePrecision rateSensitivitySpecificityAccuracyDice
    #k-meansPCNN-PSO-ATExtracted cement linesk-meansPCNN-PSO-ATExtracted cement linesk-meansPCNN-PSO-ATExtracted cement linesk-meansPCNN-PSO-ATExtracted cement linesk-meansPCNN-PSO-ATExtracted cement lines
    10.32220.81700.82620.32650.78410.88580.32780.78100.85920.38670.78170.96370.39590.62310.8472
    20.33590.73990.87930.31590.65190.84500.31410.76770.89690.37850.72870.92580.38320.69310.9909
    30.2190.47860.91950.40630.78140.87440.4310.76700.89580.44860.76870.96280.49220.62040.9313
    40.3370.76780.94890.3150.56470.93730.3130.75730.84850.37780.77210.87420.38210.60530.8902
    50.29490.75810.89160.34760.58210.88020.35510.77590.87230.40310.75630.83480.42150.60150.8703
    60.21460.80820.88070.40970.76480.92730.43540.72230.90650.45120.78270.89770.49630.61060.8439
    70.24180.50710.87830.38870.79100.91840.40820.75900.88800.43490.65680.95960.4710.53270.9546
    80.2820.71240.86530.35760.76840.85580.3680.59050.89530.41080.78490.84500.43340.61130.8845
    Mean0.28090.69860.88620.35840.71110.89050.36910.74010.88280.41150.75400.90800.43450.61230.9016
    SD0.05050.13170.03630.03900.09590.03380.05050.06300.02060.03030.04340.05300.04710.04350.0526
     | Show Table
    DownLoad: CSV

    Table 2 summarizes the quality results, where it can be seen that larger metrics values are reached for the combined PCNN-PSO-AT methodology compared to those for the k-means method. Operating the PCNN-PSO-AT methodology on image 4, for example, yielded values for precision, sensitivity, specificity, accuracy, and dice of 0.7678, 0.5647, 0.7573, 0.7721, and 0.6053, respectively, as compared with k-means obtained values for 0.337, 0.315, 0.313, 0.3778, and 0.3821. For tested image 8, obtained values for PCNN-PSO-AT were 0.7124, 0.7684, 0.5905, 0.7849, and 0.6113 as compared with k-means values of 0.282, 0.3576, 0.368, 0.4108, and 0.4334, respectively. For all 8 images, the mean values reveal that for all of the 5 quality metrics the PCNN-PSO-AT methodology is found to outperform the k-means method in detecting cement lines. Furthermore, better results with higher values, attesting to the efficacy of the methodology, for the metrics are found for the cement lines extracted through PCNN-PSO-AT. For image 1 for example, the values obtained for precision, sensitivity, specificity, accuracy, and dice were found to be 0.8262, 0.8858, 0.8592, 0.9637, and 0.8472, respectively. Comparable results were found for the other images. Mean values for all images obtained for precision, sensitivity, specificity, accuracy, and dice metrics were found to approach unity as 0.8862, 0.8905, 0.8828, 0.9080, 0.9016, respectively.

    5.2. The modified Hausdorff distance (MHD) method

    Another supervised evaluation method is employed to quantify the accuracy of the proposed segmentation methodology as compared with manually traced lines. Unlike the classical measures quality in equations 8-12, the modified Hausdorff distance (MHD) method [39,40] measures and compares the distance between two segmentation methods. The distance provides a normalized metric of the maximum distance that separates the points in segmented images from the points in the ground truth images. The lower the values of MHD the better are the matching with the ground truth image, thus the better the segmentation. It was determined [39] that an object with MHD value lower than 3 was similar enough to the ground truth.

    In Figure 11,the MHD values are reported for the resulting cement lines of the ground truth (manual segmented images) against those obtained by the k-means, PCNN-PSO-AT, and the extracted cement line boundaries using PCNN-PSO-AT. It could be clearly inferred that the values of MHD for the PCNN-PSO-AT methodology are superior to those of k-means. MHD distance values obtained for the extracted cement lines boundary using the PCNN-PSO-AT methodology are significantly less than 3 which is a testament to the accuracy of the methodology advanced in this work in segregating cement lines.

    Figure 11. Modified Hausdorff distance MHD values for evaluating the quality of extracted cement lines for the k-means method, PCNN-PSO-AT methodology, and the extracted cement lines using PCNN-PSO-AT as compared to ground truth (manual segmentation).

    6. Summary

    In cortical bone, cement lines are ill-defined boundaries at the outermost and largest perimeters in secondary osteons and which demarcate osteons from adjacent interstitial matrix. This study aims to automatically detect cement lines by employing an AI-based methodology that takes advantage of characteristic attributes of the lacuna-canalicular network (LCN) features present in the osteon namely 1) feature orientation, 2) Euler number, and 3) feature size (of the largest perimeter of fitted ellipse). The methodology combines fitness functions from 3 methods typically used separately in image segmentation: pulse coupled neural networks (PCNN), particle swarm optimization (PSO), and adaptive threshold (AT). The methodology was demonstrated to achieve high fidelity, automated segmentation of cement lines (Figure 8; and with enhanced visualization in Figure 10). In contrast with the popular k-means method, higher fidelity segmented cement lines are obtained with the PCNN-PSO-AT methodology as advanced in this work as evidenced by larger values of both quality metrics (Table 2) and modified Hausdorff distance (Figure 11).

    Acknowledgments

    The authors would like to acknowledge Mr. Charbel Seif, instructor at the Mechanical Engineering Department, and Mr. Ziad Al Baff, technician at the Surgical Pathology of the medical center at the American University of Beirut for their work in bone specimen preparation for microscope imaging. The authors acknowledge the support of the Lebanese National Council for Scientific Research (LNCSR) for support of the first author through the CNRS-L/AUB PhD Awards Program. The first author gratefully acknowledges the support of University Research Board (URB) of the American University of Beirut through which the Doctoral Fellowship is funded.

    Conflict of Interest

    The authors have no conflict of interest including financial and personal relationships with other people or organizations that could inappropriately influence (bias) this work.

    [1] Salguero L, Saadat F, Sevostianov I (2014) Micromechanical modeling of elastic properties of cortical bone accounting for anisotropy of dense tissue. J Biomechanics 47: 3279-3287.
    [2] Aishwarya R, Nagaraju V (2012) Automatic region of interest based medical image segmentation using spatial fuzzy k clustering method. Int J Electronics Commu 3: 226-229.
    [3] Deselaers T, Keysers D, Ney H (2004) Features for image retrieval: A quantitative comparison. Pattern Recogn: 228-236.
    [4] Couprie C, Najman L, Talbot H (2011) Seeded segmentation methods for medical image analysis. Med Image Process: 27-57.
    [5] Beham MP, Gurulakshmi A (2012) Morphological image processing approach on the detection of tumor and cancer cells. Devices Circuits Systems (ICDCS), 2012 International Conference on: 350-354.
    [6] Quelhas P, Marcuzzo M, Mendonça AM, et al. (2009) Cancer cell detection and invasion depth estimation in brightfield images. BMVC: 1-10.
    [7] Tassani S, Korfiatis V, Matsopoulos GK. Segmentation of micro-CT images: An understudied problem.
    [8] Wu Y, Bergot C, Jolivet E, et al. (2009) Cortical bone mineralization differences between hip-fractured females and controls. A microradiographic study. Bone 45: 207-212.
    [9] Ligesh CAS, Shanker N, Vijay A, et al. (2011) Estimation of bone mineral density from the digital image of the calcanium bone. Electro Comput Techno (ICECT), 2011 3rd International Conference on 3: 365-369.
    [10] Ma X, Overton T (1991) Automated image analysis for bone density measurements using computed tomography. Med Imaging 10: 611-615.
    [11] Wolf P, Luechinger R, Stacoff A, et al. (2007) Reliability of tarsal bone segmentation and its contribution to MR kinematic analysis methods. Comput Med Imaging Graphics 31:523-530.
    [12] Zhang Y, He Z, Fan S, et al. (2008) Automatic thresholding of micro-CT trabecular bone images. BioMed Engine Inform 2: 23-27.
    [13] Liu Z, Austin TJ, Moore D, et al. (1995) Image processing techniques for bone image analysis. Image Processing 1: 458-461.
    [14] Liu Z, Liew HL, Dance S (1996) Image processing techniques for quantitative bone image analysis. Sign Process Applica 1: 431-432.
    [15] Jatti A (2010) Segmentation of microscopic bone images. Int J Electron Engine 2.
    [16] Jatti A (2011) Segmentation and Analysis of Microscopic Osteosarcoma Bone Images. Int J Inform Techno Knowledge Manage 4: 195-200.
    [17] Liu Z, Liew HL, Clement JG, et al. (1999) Bone image segmentation. Biomed Engine 46: 565-573.
    [18] Liu Z, Austin TJ, Thomas CDL, et al. (1996) Bone feature analysis using image processing techniques. Comput Biol Med 26: 65-76. doi: 10.1016/0010-4825(95)00044-5
    [19] Cooper D, Erickson B, Peele AG, et al. (2011) Visualization of 3D osteon morphology by synchrotron radiation micro‐CT. J Anatomy 219: 481-489.
    [20] Dong P, Pacureanu A, Zuluaga MA, et al. (2014) Quantification of the 3D morphology of the bone cell network from synchrotron micro-CT images. Image Analy Stereol 33: 157-166. doi: 10.5566/ias.v33.p157-166
    [21] Hage IS, Hamade RF (2012) Structural micro processing of Haversian systems of a cortical bovine femur using optical stereomicroscope and MATLAB. ASME 2012 Int Mechan Engine Congress Exposit: 595-601.
    [22] Hage IS, Hamade RF (2013) Segmentation of histology slides of cortical bone using pulse coupled neural networks optimized by particle-swarm optimization. Comput Med Imaging Graphics 37: 466-474.
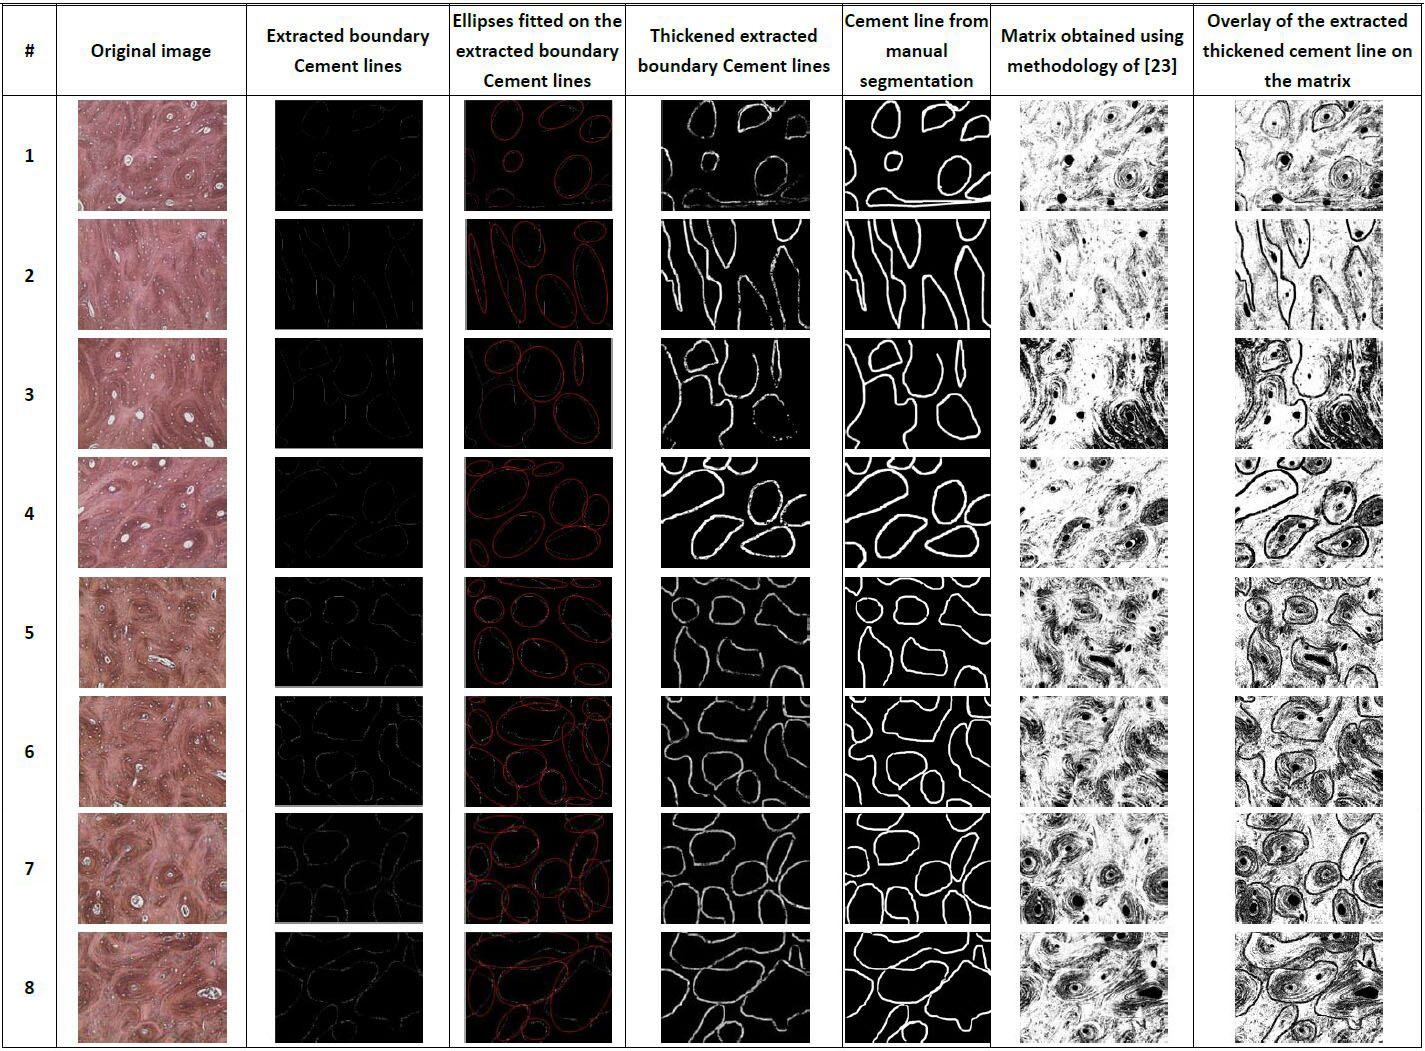
    [23] Hage IS, Hamade RF (2015) Geometric-attributes-based segmentation of cortical bone slides using optimized neural networks. J Bone Mine Metabol. In press.
    [24] Hage IS, Hamade RF (2013) Micro-FEM orthogonal cutting model for bone using microscope images enhanced via artificial intelligence. Procedia CIRP 8: 384-389.
    [25] Hage IS, Hamade RF (2013) Micro FEM simulations of single-cutting-edge sawing of cortical bone. ASME 2013 Int Mechan Engine Congress Exposit: V03AT03A049-V03AT03A049.
    [26] Lindblad T, Kinser JM (2005) Image processing using pulse-coupled neural networks, Springer.
    [27] Wang Z, Ma Y, Gu J (2010) Multi-focus image fusion using PCNN. Pattern Recog 43: 2003-2016. doi: 10.1016/j.patcog.2010.01.011
    [28] Poli R, Kennedy J, Blackwell T (2007) Particle swarm optimization. Swarm Intelligence 1: 33-57.
    [29] Gao K, Dong M, Jia F, et al. (2012) OTSU image segmentation algorithm with immune computation optimized PCNN parameters. Engine Technol (S-CET), 2012 Spring Congress: 1-4.
    [30] Pai Y, Chang Y, Ruan SJ (2010) Adaptive thresholding algorithm: Efficient computation technique based on intelligent block detection for degraded document images. Pattern Recog 43: 3177-3187.
    [31] Gonzalez RC, Woods RE (2002) Digital image processing using MATLAB. Pearson Education India.
    [32] Ma Y, Zhan K, Wang Z (2010) Applications of pulse-coupled neural networks. Higher Education Press.
    [33] Deng Y, Manjunath BS, Shin H, et al. (1999) Color Image Segmentation. IEEE CVPR 2: 2446.
    [34] Appleford MR, Pilia M (2014). U.S. Patent No. 20,140,236,312. Washington, DC: U.S. Patent and Trademark Office.
    [35] Dawant BM, Hartmann SL, Thirion JP, et al. (1999) Medical Imaging, Automatic 3-D segmentation of internal structures of the head in MR images using a combination of similarity and free-form transformations. I. Methodology and validation on normal subjects. IEEE 18: 909-916.
    [36] Conte D, Foggia P, Tufano F, et al. (2011) An Enhanced Level Set Algorithm for Wrist Bone Segmentation. Image Segment, InTech: 293-308.
    [37] Calder J, Tahmasebi AM, Mansouri AR (2011) A variational approach to bone segmentation in CT images. SPIE Med Imaging: 79620B-79620B-15.
    [38] Mahendran S, Baboo S (2011) Enhanced automatic X-ray bone image segmentation using wavelets and morphological operators. Int Conf on Information and Electronics Eng: 125-129.
    [39] Taha AA, Hanbury A (2015) Metrics for evaluating 3D medical image segmentation: analysis, selection, and tool. BMC Med Image 15: 29. doi: 10.1186/s12880-015-0068-x
    [40] Bégin S, Dupont-Therrien O, Bélanger E, et al. (2014) Automated method for the segmentation and morphometry of nerve fibers in large-scale CARS images of spinal cord tissue. Biomed Optics Express 5: 4145-4161. doi: 10.1364/BOE.5.004145
  • This article has been cited by:

    1. Ilige S. Hage, R. F. Hamade, A study of intracortical porosity’s area fractions and aspect ratios using computer vision and pulse-coupled neural networks, 2019, 57, 0140-0118, 577, 10.1007/s11517-018-1900-6
    2. Yu-xi Liu, Ai-hua Li, Yan-hua Li, L. Yang, Z. Xu, Effects of Microstructure Characteristics of Cortical Bone on its Microcrack Propagation, 2020, 185, 2267-1242, 03027, 10.1051/e3sconf/202018503027
    3. Herbert F. Jelinek, Andrei V. Kelarev, A Survey of Data Mining Methods for Automated Diagnosis of Cardiac Autonomic Neuropathy Progression, 2016, 3, 2375-1576, 217, 10.3934/medsci.2016.2.217
    4. Andrei V. Kelarev, Xun Yi, Hui Cui, Leanne Rylands, Herbert F. Jelinek, A survey of state-of-the-art methods for securing medical databases, 2018, 5, 2375-1576, 1, 10.3934/medsci.2018.1.1
  • Reader Comments
  • © 2015 the Author(s), licensee AIMS Press. This is an open access article distributed under the terms of the Creative Commons Attribution License (http://creativecommons.org/licenses/by/4.0)
通讯作者: 陈斌, bchen63@163.com
  • 1. 

    沈阳化工大学材料科学与工程学院 沈阳 110142

  1. 本站搜索
  2. 百度学术搜索
  3. 万方数据库搜索
  4. CNKI搜索

Metrics

Article views(7261) PDF downloads(1295) Cited by(4)

Article outline

Figures and Tables

Figures(11)  /  Tables(2)

Other Articles By Authors

/

DownLoad:  Full-Size Img  PowerPoint
Return
Return

Catalog