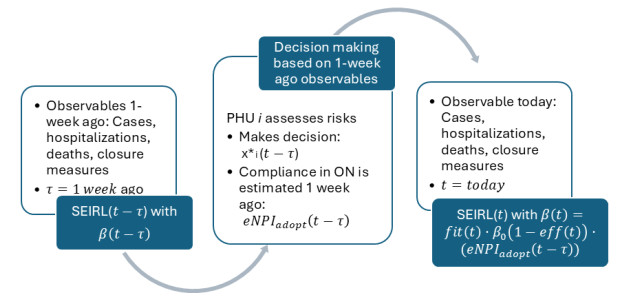
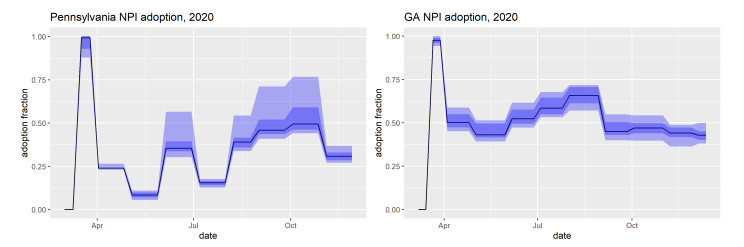
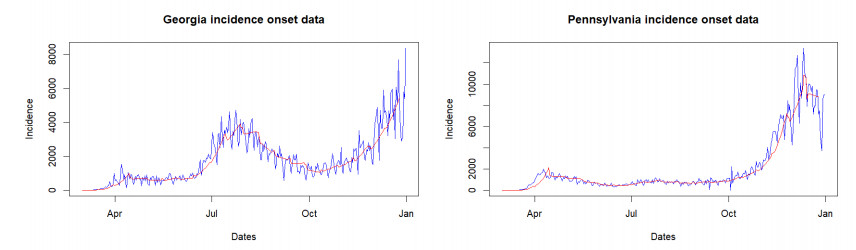
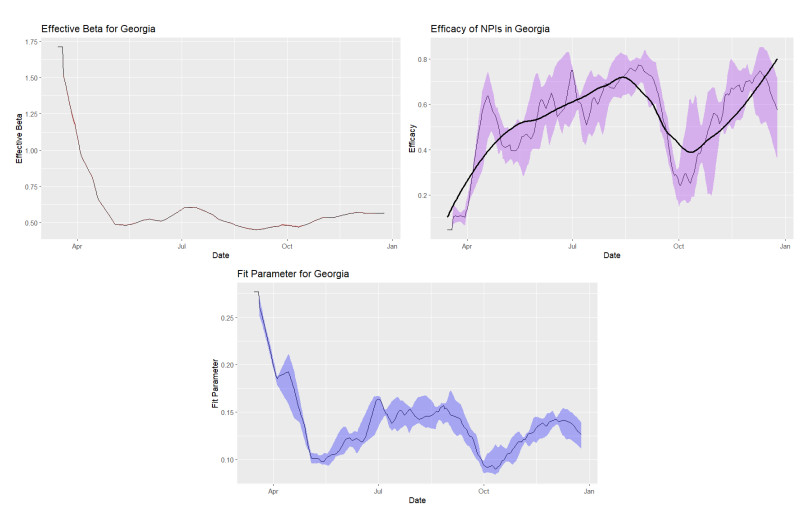
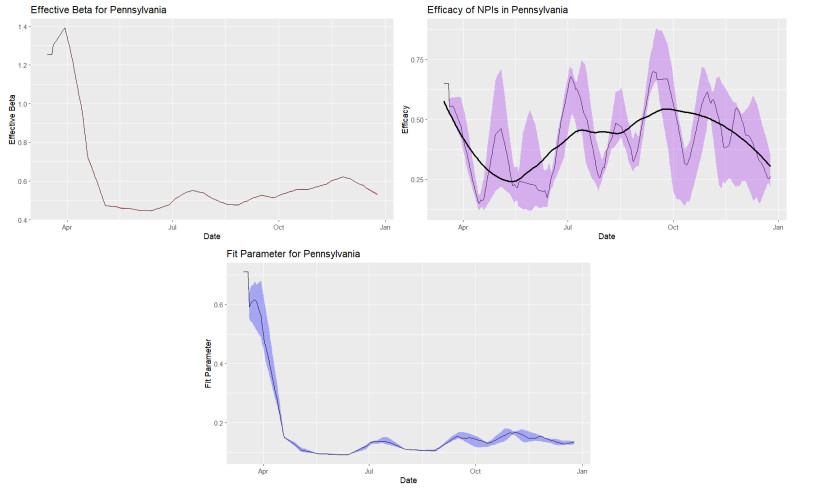
In this work, we provide estimates of non-pharmaceutical interventions (NPIs) adoption and its effects on the COVID-19 disease transmission across the province of Ontario, Canada, in 2020. Using freely available data, we estimate perceived risks of infection and a personal discomfort with complying with NPIs for Ontarians across 34 public health units. With the use of game theory, we model a time series of decision making processes in each public health region to extract an estimate of the adoption level of NPIs from March to December 2020. In conjunction with a susceptible-exposed-recovered-isolated compartmental model for Ontario, we are able to estimate a province-wide effectiveness level of NPIs. Last but not least, we show the model's versatility by applying it to Pennsylvania and Georgia in the United States.
Citation: Rhiannon Loster, Sarah Smook, Lia Humphrey, David Lyver, Zahra Mohammadi, Edward W. Thommes, Monica G. Cojocaru. Behaviour quantification of public health policy adoption - the case of non-pharmaceutical measures during COVID-19[J]. Mathematical Biosciences and Engineering, 2025, 22(4): 920-942. doi: 10.3934/mbe.2025033
In this work, we provide estimates of non-pharmaceutical interventions (NPIs) adoption and its effects on the COVID-19 disease transmission across the province of Ontario, Canada, in 2020. Using freely available data, we estimate perceived risks of infection and a personal discomfort with complying with NPIs for Ontarians across 34 public health units. With the use of game theory, we model a time series of decision making processes in each public health region to extract an estimate of the adoption level of NPIs from March to December 2020. In conjunction with a susceptible-exposed-recovered-isolated compartmental model for Ontario, we are able to estimate a province-wide effectiveness level of NPIs. Last but not least, we show the model's versatility by applying it to Pennsylvania and Georgia in the United States.

| [1] | Canadian Institute for Health Information, Canadian COVID-19 Intervention Timeline. Available from: https://www.cihi.ca/en/canadian-COVID-19-intervention-timeline. |
| [2] | C. Bauch, A. d'Onofrio, P. Manfredi, Behavioral epidemiology of infectious diseases: an overview, in Modeling the Interplay between Human Behavior and the Spread of Infectious Diseases, (2013), 1–19. https://doi.org/10.1007/978-1-4614-5474-8 |
| [3] | COVID-19 cases, hospitalizations and deaths in Ontario, Tech. Rep., March 2020. [Online]. Available from: https://toronto.ctvnews.ca/tracking-COVID-19-in-ontario-1.4834821. |
| [4] | N. Little, COVID-19 tracker Canada, Tech. Rep., 2020. [Online]. Available from: https://COVID19tracker.ca/. |
| [5] |
R. O. Stutt, R. Retkute, M. Bradley, C. A. Gilligan, J. Colvin, A modelling framework to assess the likely effectiveness of facemasks in combination with lock-down in managing the COVID-19 pandemic, Proc. R. Soc. A, 476 (2020), 2238. https://doi.org/10.1098/rspa.2020.0376 doi: 10.1098/rspa.2020.0376

|
| [6] | Canadian pandemic influenza preparedness: Planning guidance for the health sector, Health Canada, Tech. Rep., 2019. [Online]. Available from: https://www.canada.ca/content/dam/hc-sc/documents/services/flu-influenza/64-02-19-2374-Canadian%20Pandemic%20Influenza%20Prepardness_EN-05%20FINAL.pdf. |
| [7] | R. Fields, L. Humphrey, D. Flynn-Primrose, Z. Mohammadi, M. Nahirniak, E. Thommes, et al., Age-stratified transmission model of COVID-19 in Ontario with human mobility during pandemic's first wave, Heliyon, 7 (2021), e07905. |
| [8] |
K. Prem, A. R. Cook, M. Jit, Projecting social contact matrices in 152 countries using contact surveys and demographic data, PLoS Comput. Biol., 13 (2017), e1005697. https://doi.org/10.1371/journal.pcbi.1005697 doi: 10.1371/journal.pcbi.1005697
|
| [9] |
N. Ferguson, Capturing human behaviour, Nature, 446 (2007), 733. https://doi.org/10.1038/446733a doi: 10.1038/446733a
|
| [10] |
W. Zhong, Y. Kim, M. Jehn, Modeling dynamics of an influenza pandemic with heterogeneous coping behaviors: case study of a 2009 H1N1 outbreak in Arizona, Comput. Math. Organ. Theory, 19 (2013), 622–645. https://doi.org/10.1007/s10588-012-9146-6 doi: 10.1007/s10588-012-9146-6
|
| [11] |
G. Ferrante, S. Baldissera, P. F. Moghadam, G. Carrozzi, M. O. Trinito, S. Salmaso, Surveillance of perceptions, knowledge, attitudes and behaviors of the Italian adult population (18–69 years) during the 2009–2010 A/H1N1 influenza pandemic, Eur. J. Epidemiol., 26 (2011), 211–219. https://doi.org/10.1007/s10654-011-9576-3 doi: 10.1007/s10654-011-9576-3
|
| [12] |
J. Lau, X. Yang, H. Tsui, J. Kim, Monitoring community responses to the SARS epidemic in Hong Kong: from day 10 to day 62, J. Epidemiol. Community Health, 57 (2003), 864–870. https://doi.org/10.1136/jech.57.11.864 doi: 10.1136/jech.57.11.864
|
| [13] |
J. Li, Effects of behavior change on the spread of AIDS epidemic, Math. Comput. Model., 16 (1992), 103–111. https://doi.org/10.1016/0895-7177(92)90155-E doi: 10.1016/0895-7177(92)90155-E
|
| [14] |
F. Nyabadza, Z. Mukandavire, S. Hove-Musekwa, Modelling the HIV/AIDS epidemic trends in South Africa: Insights from a simple mathematical model, Nonlinear Anal. Real World Appl., 12 (2011), 2091–2104. https://doi.org/10.1016/j.nonrwa.2010.12.024 doi: 10.1016/j.nonrwa.2010.12.024
|
| [15] |
G. J. Rubin, R. Amlôt, L. Page, S. Wessely, Public perceptions, anxiety, and behaviour change in relation to the swine flu outbreak: cross sectional telephone survey, BMJ, 339 (2009). https://doi.org/10.1136/bmj.b2651 doi: 10.1136/bmj.b2651
|
| [16] |
S. Tully, M. Cojocaru, C. T. Bauch, Coevolution of risk perception, sexual behaviour, and HIV transmission in an agent-based model, J. Theor. Biol., 337 (2013), 125–132. https://doi.org/10.1016/j.jtbi.2013.08.014 doi: 10.1016/j.jtbi.2013.08.014
|
| [17] |
V. Capasso, G. Serio, A generalization of the kermack-mckendrick deterministic epidemic model, Math. Biosci., 42 (1978), 43–61. https://doi.org/10.1016/0025-5564(78)90006-8 doi: 10.1016/0025-5564(78)90006-8
|
| [18] |
F. Verelst, L. Willem, P. Beutels, Behavioural change models for infectious disease transmission: a systematic review (2010–2015), J. R. Soc. Interface, 13 (2016), 20160820. https://doi.org/10.1098/rsif.2016.0820 doi: 10.1098/rsif.2016.0820
|
| [19] |
X. Wang, H. Wang, Discrete inverse method for extracting disease transmission rates from accessible infection data, SIAM J. Appl. Math., 84 (2023), S336–S361. https://doi.org/10.1137/22M1498796 doi: 10.1137/22M1498796
|
| [20] |
X. Wang, H. Wang, P. Ramazi, K. Nah, M. Lewis, A hypothesis-free bridging of disease dynamics and non-pharmaceutical policies, Bull. Math. Biol., 84 (2022), 57. https://doi.org/10.1007/s11538-022-01012-8 doi: 10.1007/s11538-022-01012-8
|
| [21] |
W. Suwanprasert, COVID-19 and endogenous public avoidance: insights from an economic model, Available at SSRN 3565564, 2020. http://dx.doi.org/10.2139/ssrn.3565564 doi: 10.2139/ssrn.3565564
|
| [22] | J. Von Neumann, O. Morgenstern, Theory of Games and Economic Behavior, Princeton university press, 2007. |
| [23] | M. J. Osborne, A. Rubinstein, A Course in Game Theory, MIT Press, Cambridge, Massachusetts, 1994. |
| [24] |
C. T. Bauch, Imitation dynamics predict vaccinating behaviour, Proc. R. Soc. B: Biol. Sci., 272 (2005), 1669–1675. https://doi.org/10.1098/rspb.2005.3153 doi: 10.1098/rspb.2005.3153
|
| [25] |
C. T. Bauch, D. J. Earn, Vaccination and the theory of games, Proc. Natl. Acad. Sci., 101 (2004), 13391–13394. https://doi.org/10.1073/pnas.0403823101 doi: 10.1073/pnas.0403823101
|
| [26] |
M. G. Cojocaru, C. T. Bauch, M. D. Johnston, Dynamics of vaccination strategies via projected dynamical systems, Bull. Math. Biol., 69 (2007), 1453. https://doi.org/10.1007/s11538-006-9173-x doi: 10.1007/s11538-006-9173-x
|
| [27] |
A. d'Onofrio, P. Manfredi, P. Poletti, The impact of vaccine side effects on the natural history of immunization programmes: an imitation-game approach, J. Theor. Biol., 273 (2011), 63–71. https://doi.org/10.1016/j.jtbi.2010.12.029 doi: 10.1016/j.jtbi.2010.12.029
|
| [28] |
Y. Ibuka, M. Li, J. Vietri, G. B. Chapman, A. P. Galvani, Free-riding behavior in vaccination decisions: an experimental study, PloS One, 9 (2014), e87164. https://doi.org/10.1371/journal.pone.0087164 doi: 10.1371/journal.pone.0087164
|
| [29] | L. Humphrey, E. W. Thommes, R. Fields, N. Hakim, A. Chit, M. G. Cojocaru, A path out of COVID-19 quarantine: an analysis of policy scenarios, medRxiv, 2020. |
| [30] |
Z. Mohammadi, M. G. Cojocaru, E. W. Thommes, Human behaviour, NPI and mobility reduction effects on COVID-19 transmission in different countries of the world, BMC Public Health, 22 (2022), 1594. https://doi.org/10.1186/s12889-022-13921-3 doi: 10.1186/s12889-022-13921-3
|
| [31] | J. Lyons, The independence of Ontario's public health units: does governing structure matter, Healthcare Policy, 12 (2016), 71. |
| [32] | 2016 Census Profile, Statistics Canada, Tech. Rep., 2017. Available from: https://www12.statcan.gc.ca/census-recensement/2016/dp-pd/prof/index.cfm?Lang = E. |
| [33] | 2021 census of population. statistics canada catalogue no. 98-316-x2021001, Tech. Rep., 2023. [Online]. Available from: https://www12.statcan.gc.ca/census-recensement/2021/dp-pd/prof/index.cfm?Lang = E. |
| [34] | Health services locator map, 2021. [Online]. Available from: https://www.publichealthontario.ca/en/data-and-analysis/commonly-used-products/maps/health-services-locator. |
| [35] | L. Pelley, Hundreds of ICU Patients Transferred between Ontario Hospitals as COVID-19 Admissions Rise, CBC News, 2021. [Online]. Available from: https://www.cbc.ca/news/canada/toronto/health-patient-transfers-ontario-hospitals-pandemic-1.5962460. |
| [36] | Google COVID-19 community mobility reports, 2020. Available from: https://www.google.com/COVID19/mobility/. |
| [37] | T. Hale, J. Anania, N. Angrist, T. Boby, E. Cameron-Blake, M. Di, et al., Variation in government responses to COVID-19, 2021. [Online]. Available from: https://www.bsg.ox.ac.uk/research/publications/variation-government-responses-covid-19. |
| [38] | The Institute for Health Metrics and Evaluation, Compliance with Mask. [Online]. Available from: https://covid19.healthdata.org/. |
| [39] |
A. R. Tuite, D. N. Fisman, A. L. Greer, Mathematical modelling of COVID-19 transmission and mitigation strategies in the population of Ontario, Canada, CMAJ, 192 (2020), E497–E505. https://doi.org/10.1503/cmaj.200476 doi: 10.1503/cmaj.200476
|
| [40] | K. Mizumoto, K. Kagaya, A. Zarebski, G. Chowell, Estimating the asymptomatic proportion of coronavirus disease 2019 (COVID-19) cases on board the diamond princess cruise ship, Yokohama, Japan, 2020, Eurosurveillance, 25 (2020), 2000180. |
| [41] |
W. He, G. Y. Yi, Y. Zhu, Estimation of the basic reproduction number, average incubation time, asymptomatic infection rate, and case fatality rate for COVID-19: Meta-analysis and sensitivity analysis, J. Med. Virol., 11 (2020), 2543–2550. https://doi.org/10.1002/jmv.26041 doi: 10.1002/jmv.26041
|
| [42] | P. H. Ontario, COVID-19 – what we know so far about…asymptomatic infection and asymptomatic transmission, 2020. [Online]. Available from: https://www.publichealthontario.ca/en/data-and-analysis/commonly-used-products/maps/health-services-locator. |
| [43] |
J. F. Daoust, É. Bélanger, R. Dassonneville, E. Lachapelle, R. Nadeau, Is the unequal COVID–19 burden in canada due to unequal levels of citizen discipline across provinces, Can. Public Policy, 48 (2022), 124–143. https://doi.org/10.3138/cpp.2021-060 doi: 10.3138/cpp.2021-060
|
| [44] |
J. Wu, B. Tang, N. L. Bragazzi, K. Nah, Z. McCarthy, Quantifying the role of social distancing, personal protection and case detection in mitigating COVID-19 outbreak in Ontario, Canada, J. Math. Ind., 10 (2020), 1–12. https://doi.org/10.1186/s13362-020-00083-3 doi: 10.1186/s13362-020-00083-3
|
| [45] |
J. F. Nash, Equilibrium points in n-person games, Proc. Natl. Acad. Sci., 36 (1950), 48–49. https://doi.org/10.4324/9781003547983 doi: 10.4324/9781003547983
|
| [46] | Table 22-10-0143-01 Smartphone personal use and selected smartphone habits by gender and age group, Tech. Rep., June 2021. [Online]. Available from: https://www150.statcan.gc.ca/t1/tbl1/en/tv.action?pid = 2210014301. |
| [47] | L. Ceci, Top U.S. Mapping apps by Downloads 2021, Tech. Rep., February 2022. [Online]. Available from: https://www.statista.com/statistics/865413/most-popular-us-mapping-apps-ranked-by-audience/. |
| [48] | C. Cheung, J. Lyons, B. Madsen, S. Miller, S. Sheikh, The Bank of Canada COVID-19 stringency index: measuring policy response across provinces, 2021. [Online]. Available from: https://www.bankofcanada.ca/2021/02/staff-analytical-note-2021-1/. |

Figures(12) / Tables(4)

Rhiannon Loster, Sarah Smook, Lia Humphrey, David Lyver, Zahra Mohammadi, Edward W. Thommes, Monica G. Cojocaru. Behaviour quantification of public health policy adoption - the case of non-pharmaceutical measures during COVID-19[J]. Mathematical Biosciences and Engineering, 2025, 22(4): 920-942. doi: 10.3934/mbe.2025033


 DownLoad: