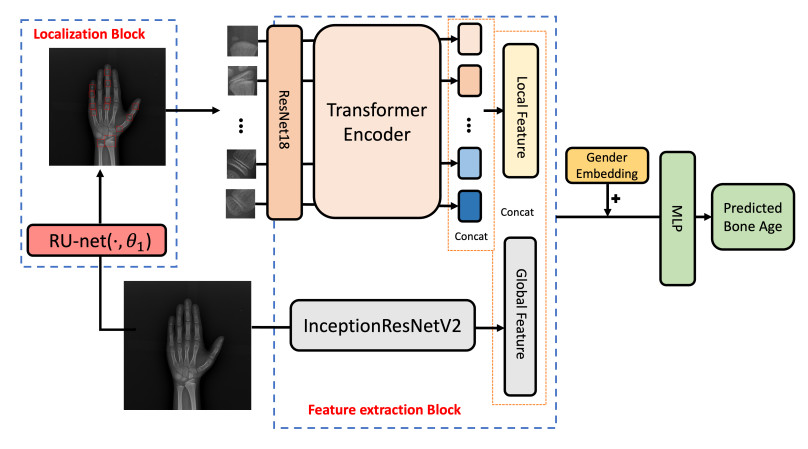
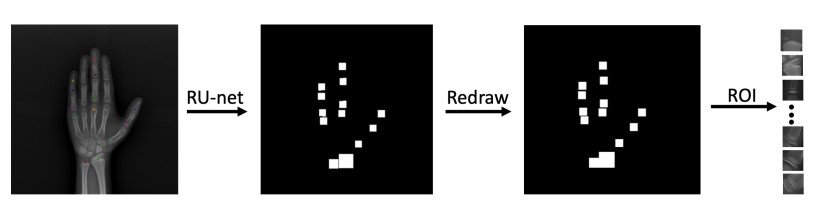
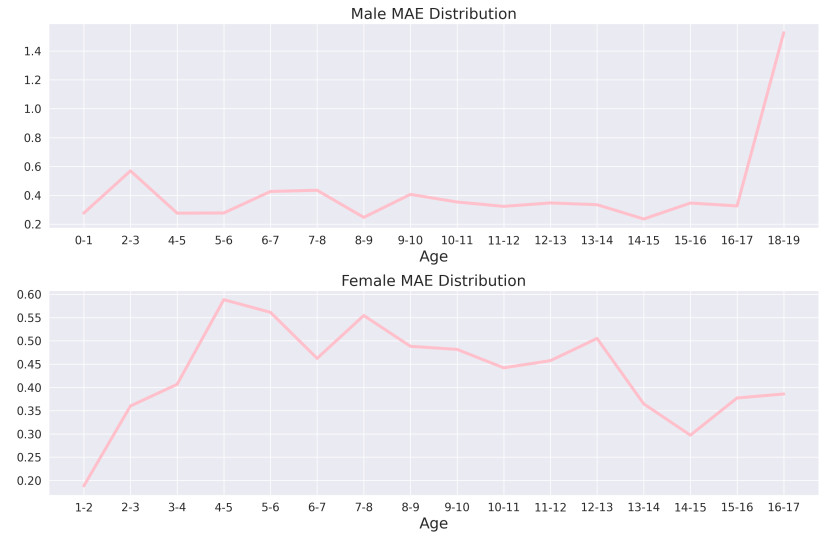
Bone age assessment (BAA) is a widely used clinical practice for the biological development of adolescents. The Tanner Whitehouse (TW) method is a traditionally mainstream method that manually extracts multiple regions of interest (ROIs) related to skeletal maturity to infer bone age. In this paper, we propose a deep learning-based method for fully automatic ROIs localization and BAA. The method consists of two parts: a U-net-based backbone, selected for its strong performance in semantic segmentation, which enables precise and efficient localization without the need for complex pre- or post-processing. This method achieves a localization precision of 99.1% on the public RSNA dataset. Second, an InceptionResNetV2 network is utilized for feature extraction from both the ROIs and the whole image, as it effectively captures both local and global features, making it well-suited for bone age prediction. The BAA neural network combines the advantages of both ROIs-based methods (TW3 method) and global feature-based methods (GP method), providing high interpretability and accuracy. Numerical experiments demonstrate that the method achieves a mean absolute error (MAE) of 0.38 years for males and 0.45 years for females on the public RSNA dataset, and 0.41 years for males and 0.44 years for females on an in-house dataset, validating the accuracy of both localization and prediction.
Citation: Yuzhong Zhao, Yihao Wang, Haolei Yuan, Weiwei Xie, Qiaoqiao Ding, Xiaoqun Zhang. A fully automated U-net based ROIs localization and bone age assessment method[J]. Mathematical Biosciences and Engineering, 2025, 22(1): 138-151. doi: 10.3934/mbe.2025007
Bone age assessment (BAA) is a widely used clinical practice for the biological development of adolescents. The Tanner Whitehouse (TW) method is a traditionally mainstream method that manually extracts multiple regions of interest (ROIs) related to skeletal maturity to infer bone age. In this paper, we propose a deep learning-based method for fully automatic ROIs localization and BAA. The method consists of two parts: a U-net-based backbone, selected for its strong performance in semantic segmentation, which enables precise and efficient localization without the need for complex pre- or post-processing. This method achieves a localization precision of 99.1% on the public RSNA dataset. Second, an InceptionResNetV2 network is utilized for feature extraction from both the ROIs and the whole image, as it effectively captures both local and global features, making it well-suited for bone age prediction. The BAA neural network combines the advantages of both ROIs-based methods (TW3 method) and global feature-based methods (GP method), providing high interpretability and accuracy. Numerical experiments demonstrate that the method achieves a mean absolute error (MAE) of 0.38 years for males and 0.45 years for females on the public RSNA dataset, and 0.41 years for males and 0.44 years for females on an in-house dataset, validating the accuracy of both localization and prediction.

| [1] | W. Greulich, S. I. Pyle, Radiographis Atlas of the Skeletal Development of the Hand and Wrist, Stanford University Press, 1959. |
| [2] | J. M. Tanner, R. H. Whitehouse, N. Cameron, W. A. Marshall, M. J. R. Healy, H. Gold-stein, Assessment of Skeletal Maturity and Prediction of Adult Height (TW2 Method), Academic press, London, 1976. |
| [3] |
R. M. Malina, G. P. Beunen, Assessment of skeletal maturity and prediction of adult height (TW3 method), Am. J. Hum. Biol., 14 (2002), 788–789. https://doi.org/10.1002/ajhb.10098 doi: 10.1002/ajhb.10098

|
| [4] |
H. H. Thodberg, S. Kreiborg, A. Juul, K. D. Pedersen, The bonexpert method for automated determination of skeletal maturity, IEEE Trans. Med. Imaging, 28 (2008), 52–66. https://doi.org/10.1109/TMI.2008.926067 doi: 10.1109/TMI.2008.926067
|
| [5] |
S. Koitka, M. S. Kim, M. Qu, A. Fischer, C. M. Friedrich, F. Nensa, Mimicking the radiologists' workflow: Estimating pediatric hand bone age with stacked deep neural networks, Med. Image Anal., 64 (2020), 101743. https://doi.org/10.1016/j.media.2020.101743 doi: 10.1016/j.media.2020.101743
|
| [6] |
S. J. Son, Y. Song, N. Kim, Y. Do, N. Kwak, M. S. Lee, et al., TW3-based fully automated bone age assessment system using deep neural networks, IEEE Access, 7 (2019), 33346–33358. https://doi.org/10.1109/ACCESS.2019.2903131 doi: 10.1109/ACCESS.2019.2903131
|
| [7] |
H. Lee, S. Tajmir, J. Lee, M. Zissen, B. A. Yeshiwas, T. K. Alkasab, et al., Fully automated deep learning system for bone age assessment, J. Digital Imaging, 30 (2017), 427–441. https://doi.org/10.1007/s10278-017-9955-8 doi: 10.1007/s10278-017-9955-8
|
| [8] |
C. Spampinato, S. Palazzo, D. Giordano, M. Aldinucci, R. Leonardi, Deep learning for automated skeletal bone age assessment in X-ray images, Med. Image Anal., 36 (2017), 41–51. https://doi.org/10.1016/j.media.2016.10.010 doi: 10.1016/j.media.2016.10.010
|
| [9] | P. Gong, Z. Yin, Y. Wang, Y. Yu, Towards robust bone age assessment: Rethinking label noise and ambiguity, in International Conference on Medical Image Computing and Computer-Assisted Intervention, (2020), 621–630. https://doi.org/10.1007/978-3-030-59725-2_60 |
| [10] | V. I. Iglovikov, A. Rakhlin, A. A. Kalinin, A. A. Shvets, Paediatric bone age assessment using deep convolutional neural networks, in Deep Learning in Medical Image Analysis and Multimodal Learning for Clinical Decision Support, (2018), 300–308. https://doi.org/10.1007/978-3-030-00889-5_34 |
| [11] |
D. B. Larson, M. C. Chen, M. P. Lungren, S. S. Halabi, N. V. Stence, C. P. Langlotz, Performance of a deep-learning neural network model in assessing skeletal maturity on pediatric hand radiographs, Radiology, 287 (2018), 313–322. https://doi.org/10.1148/radiol.2017170236 doi: 10.1148/radiol.2017170236
|
| [12] | K. Simonyan, A. Zisserman, Very deep convolutional networks for large-scale image recognition, arXiv preprint, 2015, arXiv: 1409.1556. https://doi.org/10.48550/arXiv.1409.1556 |
| [13] | C. Szegedy, S. Ioffe, V. Vanhoucke, A. A. Alemi, Inception-v4, inception-resnet and the impact of residual connections on learning, in Thirty-first AAAI Conference on Artificial Intelligence, 31 (2017). https://doi.org/10.1609/aaai.v31i1.11231 |
| [14] |
C. F. Cheng, E. T. C. Huang, J. T. Kuo, K. Y. K. Liao, F. J. Tsai, Report of clinical bone age assessment using deep learning for an asian population in Taiwan, BioMedicine, 11 (2021), 50–58. https://doi.org/10.37796/2211-8039.1256 doi: 10.37796/2211-8039.1256
|
| [15] |
S. Ren, K. He, R. Girshick, J. Sun, Faster R-CNN: Towards real-time object detection with region proposal networks, IEEE Trans. Pattern Anal. Mach. Intell., 39 (2017), 1137–1139. https://doi.org/10.1109/TPAMI.2016.2577031 doi: 10.1109/TPAMI.2016.2577031
|
| [16] |
S. S. Halabi, L. M. Prevedello, J. Kalpathy-Cramer, A. B. Mamonov, A. Bilbily, M. Cicero, et al., The RSNA pediatric bone age machine learning challenge, Radiology, 290 (2019), 498–503. https://doi.org/10.1148/radiol.2018180736 doi: 10.1148/radiol.2018180736
|
| [17] | O. Ronneberger, P. Fischer, T. Brox, U-net: Convolutional networks for biomedical image segmentation, in International Conference on Medical Image Computing and Computer-assisted Intervention, (2015), 234–241. https://doi.org/10.1007/978-3-319-24574-4_28 |
| [18] |
F. Jia, J. Liu, X. C. Tai, A regularized convolutional neural network for semantic image segmentation, Anal. Appl., 19 (2021), 147–165. https://doi.org/10.1142/S0219530519410148 doi: 10.1142/S0219530519410148
|
| [19] | F. Milletari, N. Navab, S. A. Ahmadi, V-net: Fully convolutional neural networks for volumetric medical image segmentation, in 2016 Fourth International Conference on 3D Vision (3DV), (2016), 565–571. https://doi.org/10.1109/3DV.2016.79 |
| [20] | A. Dosovitskiy, L. Beyer, A. Kolesnikov, D. Weissenborn, X. Zhai, T. Unterthiner, et al., An image is worth 16x16 words: Transformers for image recognition at scale, arXiv preprint, 2021, arXiv: 2010.11929. https://doi.org/10.48550/arXiv.2010.11929 |
| [21] |
S. M. Pizer, E. P. Amburn, J. D. Austin, R. Cromartie, A. Geselowitz, T. Greer, et al., Adaptive histogram equalization and its variations, Comput. Vision Graphics Image Proc., 39 (1987), 355–368. https://doi.org/10.1016/S0734-189X(87)80186-X doi: 10.1016/S0734-189X(87)80186-X
|
| [22] |
M. Everingham, S. Eslami, L. Van Gool, C. K. Williams, J. Winn, A. Zisserman, The pascal visual object classes challenge: A retrospective, Int. J. Comput. Vision, 111 (2015), 98–136. https://doi.org/10.1007/s11263-014-0733-5 doi: 10.1007/s11263-014-0733-5
|
| [23] |
A. Gertych, A. Zhang, J. Sayre, S. Pospiech-Kurkowska, H. Huang, Bone age assessment of children using a digital hand atlas, Comput. Med. Imaging Graphics, 31 (2007), 322–331. https://doi.org/10.1016/j.compmedimag.2007.02.012 doi: 10.1016/j.compmedimag.2007.02.012
|
| [24] |
X. Chen, J. Li, Y. Zhang, Y. Lu, S. Liu, Automatic feature extraction in X-ray image based on deep learning approach for determination of bone age, Future Gener. Comput. Syst., 110 (2020), 795–801. https://doi.org/10.1016/j.future.2019.10.032 doi: 10.1016/j.future.2019.10.032
|
| [25] |
J. H. Lee, K. G. Kim, Applying deep learning in medical images: The case of bone age estimation, Healthcare Inf. Res., 24 (2018), 86–92. https://doi.org/10.4258/hir.2018.24.1.86 doi: 10.4258/hir.2018.24.1.86
|
| [26] |
S. Mutasa, P. D. Chang, C. Ruzal-Shapiro, R. Ayyala, Mabal: A novel deep-learning architecture for machine-assisted bone age labeling, J. Digital Imaging, 31 (2018), 513–519. https://doi.org/10.1007/s10278-018-0053-3 doi: 10.1007/s10278-018-0053-3
|
| [27] |
T. D. Bui, J. J. Lee, J. Shin, Incorporated region detection and classification using deep convolutional networks for bone age assessment, Artif. Intell. Med., 97 (2019), 1–8. https://doi.org/10.1016/j.artmed.2019.04.005 doi: 10.1016/j.artmed.2019.04.005
|
| [28] | J. Zhou, Z. Li, W. Zhi, B. Liang, D. Moses, L. Dawes, Using convolutional neural networks and transfer learning for bone age classification, in 2017 International Conference on Digital Image Computing: Techniques and Applications (DICTA), (2017), 1–6. https://doi.org/10.1109/DICTA.2017.8227503 |
| [29] |
C. Tong, B. Liang, J. Li, Z. Zheng, A deep automated skeletal bone age assessment model with heterogeneous features learning, J. Med. Syst., 42 (2018), 1–8. https://doi.org/10.1007/s10916-018-1091-6 doi: 10.1007/s10916-018-1091-6
|
Figures(4) / Tables(3)

Yuzhong Zhao, Yihao Wang, Haolei Yuan, Weiwei Xie, Qiaoqiao Ding, Xiaoqun Zhang. A fully automated U-net based ROIs localization and bone age assessment method[J]. Mathematical Biosciences and Engineering, 2025, 22(1): 138-151. doi: 10.3934/mbe.2025007


 DownLoad: