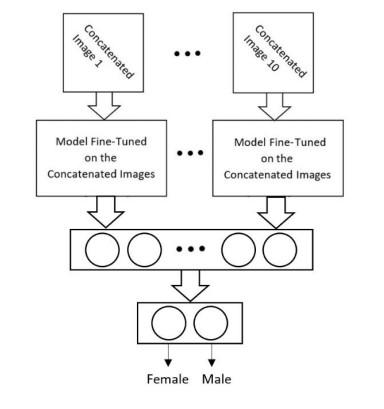
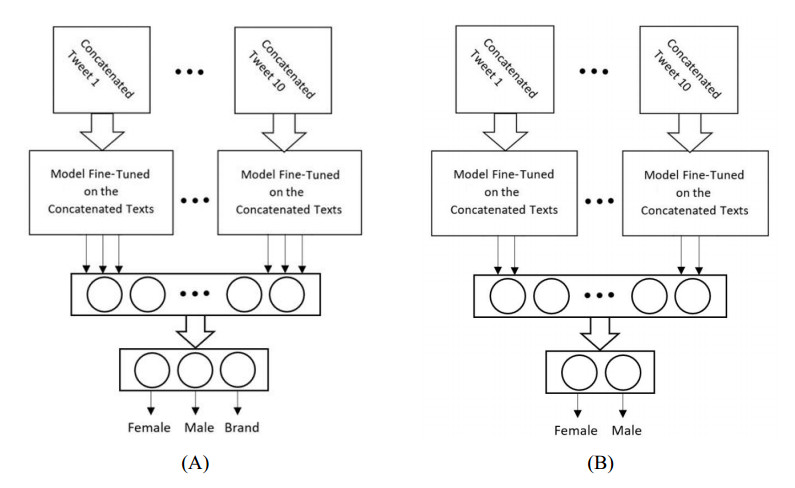
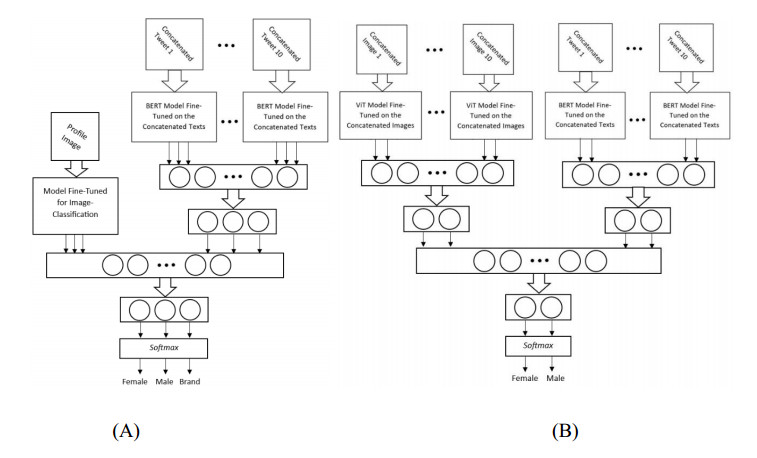
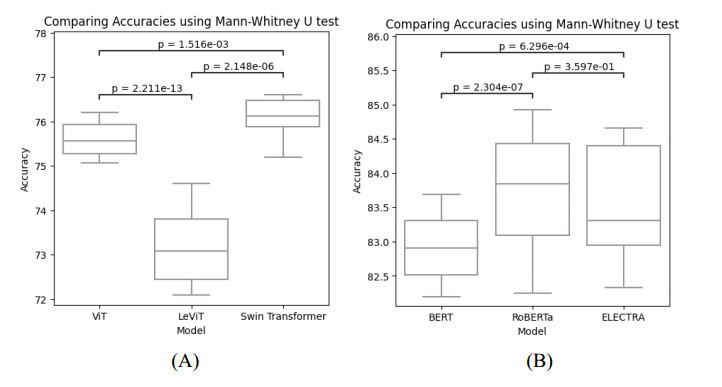
Social media contains useful information about people and society that could help advance research in many different areas of health (e.g. by applying opinion mining, emotion/sentiment analysis and statistical analysis) such as mental health, health surveillance, socio-economic inequality and gender vulnerability. User demographics provide rich information that could help study the subject further. However, user demographics such as gender are considered private and are not freely available. In this study, we propose a model based on transformers to predict the user's gender from their images and tweets. The image-based classification model is trained in two different methods: using the profile image of the user and using various image contents posted by the user on Twitter. For the first method a Twitter gender recognition dataset, publicly available on Kaggle and for the second method the PAN-18 dataset is used. Several transformer models, i.e. vision transformers (ViT), LeViT and Swin Transformer are fine-tuned for both of the image datasets and then compared. Next, different transformer models, namely, bidirectional encoders representations from transformers (BERT), RoBERTa and ELECTRA are fine-tuned to recognize the user's gender by their tweets. This is highly beneficial, because not all users provide an image that indicates their gender. The gender of such users could be detected from their tweets. The significance of the image and text classification models were evaluated using the Mann-Whitney U test. Finally, the combination model improved the accuracy of image and text classification models by 11.73 and 5.26% for the Kaggle dataset and by 8.55 and 9.8% for the PAN-18 dataset, respectively. This shows that the image and text classification models are capable of complementing each other by providing additional information to one another. Our overall multimodal method has an accuracy of 88.11% for the Kaggle and 89.24% for the PAN-18 dataset and outperforms state-of-the-art models. Our work benefits research that critically require user demographic information such as gender to further analyze and study social media content for health-related issues.
Citation: Zahra Movahedi Nia, Ali Ahmadi, Bruce Mellado, Jianhong Wu, James Orbinski, Ali Asgary, Jude D. Kong. Twitter-based gender recognition using transformers[J]. Mathematical Biosciences and Engineering, 2023, 20(9): 15962-15981. doi: 10.3934/mbe.2023711
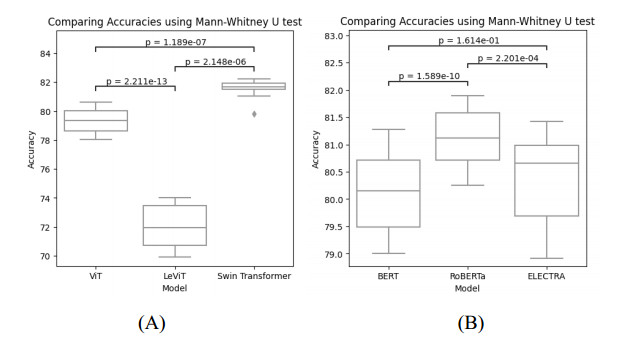
Social media contains useful information about people and society that could help advance research in many different areas of health (e.g. by applying opinion mining, emotion/sentiment analysis and statistical analysis) such as mental health, health surveillance, socio-economic inequality and gender vulnerability. User demographics provide rich information that could help study the subject further. However, user demographics such as gender are considered private and are not freely available. In this study, we propose a model based on transformers to predict the user's gender from their images and tweets. The image-based classification model is trained in two different methods: using the profile image of the user and using various image contents posted by the user on Twitter. For the first method a Twitter gender recognition dataset, publicly available on Kaggle and for the second method the PAN-18 dataset is used. Several transformer models, i.e. vision transformers (ViT), LeViT and Swin Transformer are fine-tuned for both of the image datasets and then compared. Next, different transformer models, namely, bidirectional encoders representations from transformers (BERT), RoBERTa and ELECTRA are fine-tuned to recognize the user's gender by their tweets. This is highly beneficial, because not all users provide an image that indicates their gender. The gender of such users could be detected from their tweets. The significance of the image and text classification models were evaluated using the Mann-Whitney U test. Finally, the combination model improved the accuracy of image and text classification models by 11.73 and 5.26% for the Kaggle dataset and by 8.55 and 9.8% for the PAN-18 dataset, respectively. This shows that the image and text classification models are capable of complementing each other by providing additional information to one another. Our overall multimodal method has an accuracy of 88.11% for the Kaggle and 89.24% for the PAN-18 dataset and outperforms state-of-the-art models. Our work benefits research that critically require user demographic information such as gender to further analyze and study social media content for health-related issues.

| [1] |
J. Gao, P. Zheng, Y. Jia, H. Chen, Y. Mao, S. Chen, et al., Mental health problems and social media exposure during COVID-19 outbreak, PLOS ONE, 15 (2020). https://doi.org/10.1371/journal.pone.0231924 doi: 10.1371/journal.pone.0231924

|
| [2] |
M. J. Aramburu, R. Berlanga, I. Lanza, Social media multidimensional analysis for intelligent health surveillance, Int. J. Env. Res. Public Health, 17 (2020), 2289. https://doi.org/10.3390/ijerph17072289 doi: 10.3390/ijerph17072289
|
| [3] |
J. B. Whiting, J. C. Pickens, A. L. Sagers, M. PettyJohn, B. Davies, Trauma, social media, and #WhyIDidntReport: An analysis of twitter posts about reluctance to report sexual assault, J. Marital. Fam. Ther., 47 (2021), 749–766. https://doi.org/10.1111/jmft.12470 doi: 10.1111/jmft.12470
|
| [4] |
T. Simon, A. Goldberg, L. Aharonson-Daniel, D. Leykin, B. Adini, Twitter in the cross fire–the use of social media in the Westgate Mall terror attack in kenya, PLOS ONE, 9 (2014). https://doi.org/10.1371/journal.pone.0104136 doi: 10.1371/journal.pone.0104136
|
| [5] |
G. Coppersmith, R. Leary, A. Fine, Natural language processing of social media as screening for suicide risk, Biomed. Inform. Insights, 10 (2018). https://doi.org/10.1177/1178222618792860 doi: 10.1177/1178222618792860
|
| [6] |
S. S. Hill, F. J. Dore, T. E. Steven, R. J. McLoughlin, A. S. Crawford, P. R. Sturrock, et al., Twitter use among departments of surgery with general surgery residency programs, J. Surg. Educ., 78 (2021), 35–42. https://doi.org/10.1016/j.jsurg.2020.06.008 doi: 10.1016/j.jsurg.2020.06.008
|
| [7] |
K. R. Blake, B. Bastian, T. F. Denson, R. C. Brooks, Income inequality not gender inequality positively covaries with female sexualization on social media, Proc. Natl. Acad. Sci. U. S. A., 115 (2018), 8722–8727. https://doi.org/10.1073/pnas.1717959115 doi: 10.1073/pnas.1717959115
|
| [8] |
S. Ahemd, D. Madrid-Morales, Is it still a man's world? Social media news and gender inequality in online political engagement, Inform. Commun. Soc., 24 (2020), 381–399. https://doi.org/10.1080/1369118X.2020.1851387 doi: 10.1080/1369118X.2020.1851387
|
| [9] | P. Vashisth, K. Meehan, Gender classification using Twitter text data, in 2020 31st Irish Signals and Systems Conference (ISSC), (2020), 1–6. https://doi.org/10.1109/ISSC49989.2020.9180161 |
| [10] |
C. Ikae, J. Savoy, Gender identification on Twitter, J. Assoc. Inform. Sci. Tech., 73 (2021), 58–69. https://doi.org/10.1002/asi.24541 doi: 10.1002/asi.24541
|
| [11] |
Ö. Çoban, A. İnan, S. A. Özel, Facebook tells me your gender: An exploratory study of gender prediction for Turkish Facebook users, ACM Trans. Asian Low-Reso., 20 (2021), 1–38. https://doi.org/10.1145/3448253 doi: 10.1145/3448253
|
| [12] |
I. Ameer, G. Sidorov, R. M. A. Nawab, Author profiling for age and gender using combination of features of various types, J. Intell. Fuzzy Syst., 36 (2019), 4833–4843. https://doi.org/10.3233/JIFS-179031 doi: 10.3233/JIFS-179031
|
| [13] |
Y. C. Yang, M. A. Al-Garadi, J. S. Love, J. Perrone, A. Sarker, Automatic gender detection in Twitter profiles for health-related cohort studies, JAMIA Open, 4 (2021). https://doi.org/10.1093/jamiaopen/ooab042 doi: 10.1093/jamiaopen/ooab042
|
| [14] |
C. Suman, A. Naman, S. Saha, P. Bhattacharyya, A multimodal author profiling system for tweets, IEEE Trans. Comput. Social Syst., 8 (2021), 1407–1416. https://doi.org/10.1109/TCSS.2021.3082942 doi: 10.1109/TCSS.2021.3082942
|
| [15] | T. Takahashi, T. Tahara, K. Nagatani, Y. Miura, T. Taniguchi, T. Ohkuma, Text and image synergy with feature cross technique for gender identification, in Proceedings of the Ninth International Conference of the CLEF Association (CLEF 2018), (2018), 1–22. |
| [16] | A. Vaswani, N. Shazeer, N. Parmar, J. Uszkoreit, L. Jones, A. N. Gomez, et al., Attention is all you need, in Advances in Neural Information Processing Systems 30 (NIPS 2017), (2017), 6000–6010. |
| [17] | Y. Kim, C. Denton, L. Hoang, A. M. Rush, Structured attention networks, preprint, arXiv: 1702.00887. |
| [18] | A. Parikh, O. Täckström, D. Das, J. Uszkoreit, A decomposable attention model for natural language inference, preprint, arXiv: 1606.01933. |
| [19] |
A. Galassi, M. Lippi, P. Torroni, Attention in natural language processing, IEEE Trans. Neur. Net. Lear. Syst., 32 (2021), 4291–4308. https://doi.org/10.1109/TNNLS.2020.3019893 doi: 10.1109/TNNLS.2020.3019893
|
| [20] | P. Ramachandran, N. Parmar, A. Vaswani, I. Bello, A. Levskaya, J. Shlens, Stand-Alone Self-Attention in Vision Models, Adv. Neur. Inform. Process. Syst., 32 (2019). |
| [21] | J. Devlin, M. W. Chang, K. Lee, K. Toutanova, BERT: Pre-training of deep bidirectional transformers for language understanding, in Proceedings of the 2019 Conference of the North American Chapter of the Association for Computational Linguistics: Human Language Technologies, 1 (2019), 4171–4186. https://doi.org/10.18653/v1/N19-1423 |
| [22] | A. Dosovitskiy, L. Beyer, A. Kolesnikov, D. Weissenborn, X. Zhai, T. Unterthiner, et al., An image is worth 16 × 16 words: Transformers for image recognition at scale, preprint, arXiv: 2010.11929. |
| [23] | OpenAI, Improving language understanding with unsupervised learning, 2018, [cited 19 June 2023]. Available from: https://openai.com/research/language-unsupervised |
| [24] | Y. Liu, M. Ott, N. Goyal, J. Du, M. Joshi, D. Chen, et al., RoBERTa: A robustly optimized BERT pretraining approach, preprint, arXiv: cs.CL/1907.11692. |
| [25] | Z. Yang, Z. Dai, Y. Yang, J. Carbonell, R. Salakhutdinov, Q. V. Le, XLNet: Generalized autoregressive pretraining for language understanding, preprint, arXiv: cs.CL/1906.08237. |
| [26] | K. Clark, M. T. Luong, Q. V. Le, C. D. Manning, ELECTRA: Pre-training text encoders as discriminators rather than generators, preprint, arXiv: cs.CL/2003.10555v1. |
| [27] | M. Chen, A. Radford, R. Child, J. Wu, H. Jun, D. Luan, et al., Generative pretraining from pixels, in Proceedings of the 37th International Conference on Machine Learning, 119 (2020), 119–1691. |
| [28] | Google Research, Google Brain Team, 2011, [cited 24 May 2022]. Available from: https://research.google/teams/brain/ |
| [29] | K. He, X. Zhang, S. Ren, J. Sun, Deep residual learning for image recognition, in 2016 IEEE Conference on Computer Vision and Pattern Recognition (CVPR), (2016), 770–778. https://doi.org/10.1109/CVPR.2016.90 |
| [30] | M. Tan, Q. V. Le, EfficientNet: Rethinking model scaling for convolutional neural networks, preprint, arXiv: cs.LG/1905.11946. |
| [31] | H. Touvron, M. Cord, M. Douze, F. Massa, A. Sablayrolles, H. Jegou, Training data-efficient image transformers & distillation through attention, preprint, arXiv: cs.CV/2012.12877. |
| [32] | Z. Liu, Y. Lin, Y. Cao, H. Hu, Y. Wei, Z. Zhang, et al., Swin transformer: Hierarchical vision transformer using shifted windows, in 2021 IEEE/CVF International Conference on Computer Vision (ICCV), ICCV, (2021), 9992–10002. https://doi.org/10.1109/ICCV48922.2021.00986 |
| [33] | K. Yuan, S. Guo, Z. Liu, A. Zhou, F. Yu, W. Wu, Incorporating convolution designs into visual transformers, in 2021 IEEE/CVF International Conference on Computer Vision (ICCV), (2021), 559–568. https://doi.org/10.1109/ICCV48922.2021.00062 |
| [34] | Y. Li, K. Zhang, J. Cao, R. Timofte, L. V. Gool, LocalViT: Vringing locality to vision transformers, preprint, arXiv: cs.CV/2104.05707. |
| [35] | A. Srinivas, T. Y. Lin, N. Parmar, J. Shlens, P. Abbeel, A. Vaswani, Bottleneck transformers for visual recognition, preprint, arXiv: cs.CV/2101.11605. |
| [36] | H. Wu, B. Xiao, N. Codella, M. Liu, X. Dai, L. Yuan, et al., CvT: Introducing convolutions to vision transformers, in 2021 IEEE/CVF International Conference on Computer Vision (ICCV), (2021). https://doi.org/10.1109/ICCV48922.2021.00009 |
| [37] | B. Graham, A. El-Nouby, H. Touvron, P. Stock, A. Joulin, H. Jegou, et al., LeViT: a Vosopm transformer in ConvNet's clothing for faster inference, preprint, arXiv: cs.CV/2104.01136. |
| [38] | N. Carion, F. Massa, G. Synnaeve, N. Usunier, A. Kirillov, S. Zagoruyko, End-to-end object detection with transformers, Computer Vision – ECCV 2020, Springer, Cham, (2020). https://doi.org/10.1007/978-3-030-58452-8_13 |
| [39] | Y. Fang, B. Liao, X. Wang, J. Fang, J. Qi, R. Wu, et al., You only look at one sequence: Rethinking transformer in vision through object detection, preprint, arXiv: cs.CV/2106.00666. |
| [40] | H. Wang, Y. Zhu, B. Green, H. Adam, A. Yuille, L. C. Chen, Axial-DeepLab: Stand alone axial-attention for panoptic segmentation, Computer Vision – ECCV 2020, Springer, Cham, (2020). https://doi.org/10.1007/978-3-030-58548-8_7 |
| [41] | Y. Jiang, S. Chang, Z. Wang, TransGAN: Two pure transformers can make one strong GAN, and that can scale up, preprint, arXiv: cs.CV/2102.07074. |
| [42] | L. Li, Z. Song, X. Zhang, E. A. Fox, A hybrid model for role-related user classification on Twitter, preprint, arXiv: cs.SI/1811.10202. |
| [43] | G. Ciccone, A. Sultan, L. Laporte, E. Egyed-Asigmond, A. Alhamzeh, M. Granitzer, Stacked gender prediction from tweet texts and images notebook for pan at CLEF 2018, in CLEF 2018-Conference and Labs of the Evaluation, (2018). |
| [44] |
M. A. Alvarez-Carmona, L. Pellegrin, M. Montes-y-Gómez, F. Sánchez-Vega, H. J. Escalante, A. P. López-Monroy, et al., A visual approach for age and gender identification on Twitter, J. Intell. Fuzzy Syst., 34 (2018), 3133–3145. https://doi.org/10.3233/JIFS-169497 doi: 10.3233/JIFS-169497
|
| [45] | Twitter User Gender Classification, DATA, 2016, [cited 21 June 2023]. Available from: https://www.kaggle.com/datasets/crowdflower/twitter-user-gender-classification?resource = download |
| [46] | F. Rangel, P. Rosso, M. M-Y-Gómez, M. Potthast, B. Stein, Overview of the 6th author profiling task at pan 2018: Multimodal gender identification in Twitter, in Working notes papers of the CLEF, (2018). |
| [47] | PAN, DATA, 2018, [cited 21 June 2022]. Available from: https://pan.webis.de/data.html |
| [48] | Gender Recognition Using Transformers, 2023. Available from: https://github.com/Zahra1221/Gender-Recognition-using-Transformers |
| [49] | M. Sayyadiharikandeh, G. L. Ciampaglia, A. Flammini, Cross-domain gender detection in Twitter, in Proceedings of the Workshop on Computational Approaches to Social Modeling, (2016). |
| [50] | L. Geng, K. Zhang, X. Wei, X. Feng, Soft biometrics in online social networks: A case study on Twitter user gender recognition, in 2017 IEEE Winter Applications of Computer Vision Workshops (WACVW), (2017), 1–8. https://doi.org/10.1109/WACVW.2017.8 |
| [51] |
X. Zhang, S. Javid, J. Dias, N. Werghi, Person gender classification on RGB-D data with self-joint attention, IEEE Access, 9 (2021), 166303–166313. https://doi.org/10.1109/ACCESS.2021.3135428 doi: 10.1109/ACCESS.2021.3135428
|
| [52] |
A. Garain, B. Ray, P. K. Singh, A. Ahmadian, N. Senu, R. Sarkar, GRA_NET: A deep learning model for classification of age and gender from facial images, IEEE Access, 9 (2021), 85672–85689. https://doi.org/10.1109/ACCESS.2021.3085971 doi: 10.1109/ACCESS.2021.3085971
|
| [53] |
J. Cheng, Y. Li, J. Wang, L. Yu, S. Wang, Exploiting effective facial patches for robust gender recognition, IEEE, Tsinghua Sci. Technol., 24 (2019), 333–345. https://doi.org/10.26599/TST.2018.9010090 doi: 10.26599/TST.2018.9010090
|
| [54] | L. Li, Z. Song, X. Zhang, E. A. Fox, A hybrid model for role-related user classification on Twitter, preprint, arXiv: 1811.10202. |
| [55] |
C. Suman, A. Naman, S. Saha, P. Bhattacharyya, A multimodal author profiling system for tweets, IEEE Trans. Comput. Social Syst., 8 (2021), 1407–1416. https://doi.org/10.1109/TCSS.2021.3082942 doi: 10.1109/TCSS.2021.3082942
|
| [56] |
B. Onikoyi, N. Nnamoko, I. Korkontzelos, Gender prediction with descriptive textual data using a Machine Learning approach, Natural Language Proces. J., 4 (2023). https://doi.org/10.1016/j.nlp.2023.100018 doi: 10.1016/j.nlp.2023.100018
|
| [57] | Twitter Developer Platform, Developer Agreement and Policy, 2023, Available from: https://developer.twitter.com/en/developer-terms/agreement-and-policy, (accessed 21 June 2023) |
| [58] | DocNow Hydrator, 2021, [cited 21 June 2023]. Available from: https://github.com/DocNow/hydrator |
| [59] |
M. Jafari, N. Ansari-Pour, Why, When and How to Adjust Your P Values?, Cell J., 20 (2019), 604–607. https://doi.org/10.22074/cellj.2019.5992 doi: 10.22074/cellj.2019.5992
|
| [60] | S. Daneshvar, D. Inkpen, Gender Identification in Twitter using N-grams and LSA, in proceedings of the ninth international conference of the CLEF association (CLEF 2018), (2018). |
Figures(5) / Tables(8)

Zahra Movahedi Nia, Ali Ahmadi, Bruce Mellado, Jianhong Wu, James Orbinski, Ali Asgary, Jude D. Kong. Twitter-based gender recognition using transformers[J]. Mathematical Biosciences and Engineering, 2023, 20(9): 15962-15981. doi: 10.3934/mbe.2023711


 DownLoad: