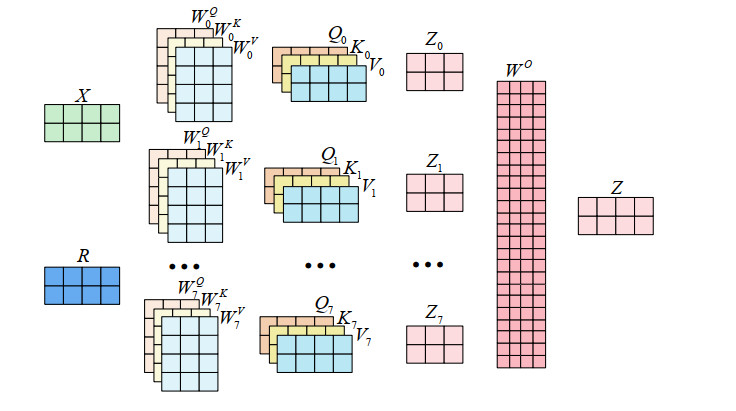
The operation and maintenance of railway signal systems create a significant and complex quantity of text data about faults. Aiming at the problems of fuzzy entity boundaries and low accuracy of entity recognition in the field of railway signal equipment faults, this paper provides a method for entity recognition of railway signal equipment fault information based on RoBERTa-wwm and deep learning integration. First, the model utilizes the RoBERTa-wwm pretrained language model to get the word vector of text sequences. Second, a parallel network consisting of a BiLSTM and a CNN is constructed to obtain the context feature information and the local attention information, respectively. Third, the feature vectors output from BiLSTM and CNN are combined and fed into MHA, focusing on extracting key feature information and mining the connection between different features. Finally, the label sequences with constraint relationships are outputted in CRF to complete the entity recognition task. The experimental analysis is carried out with fault text of railway signal equipment in the past ten years, and the experimental results show that the model has a higher evaluation index compared with the traditional model on this dataset, in which the precision, recall and F1 value are 93.25%, 92.45%, and 92.85%, respectively.
Citation: Junting Lin, Shan Li, Ning Qin, Shuxin Ding. Entity recognition of railway signal equipment fault information based on RoBERTa-wwm and deep learning integration[J]. Mathematical Biosciences and Engineering, 2024, 21(1): 1228-1248. doi: 10.3934/mbe.2024052
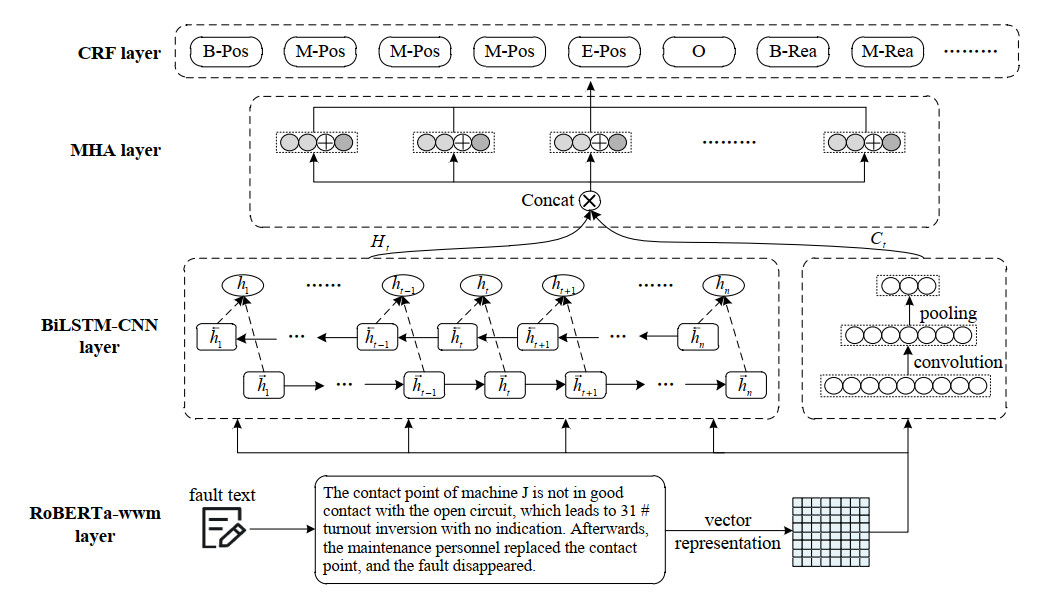
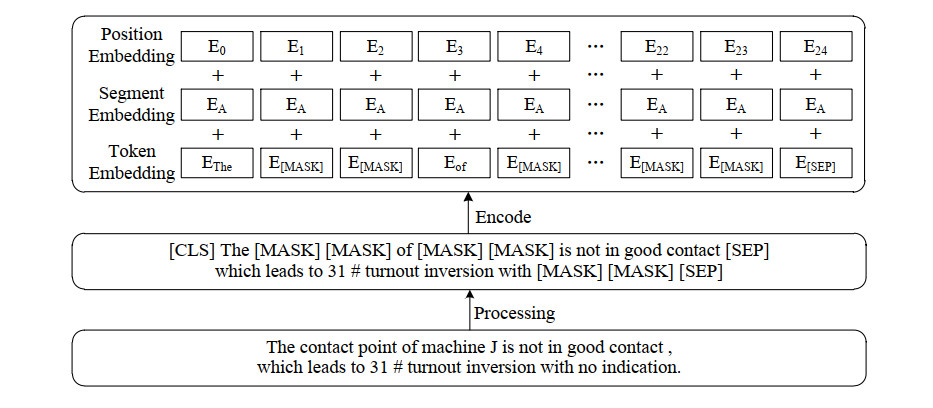
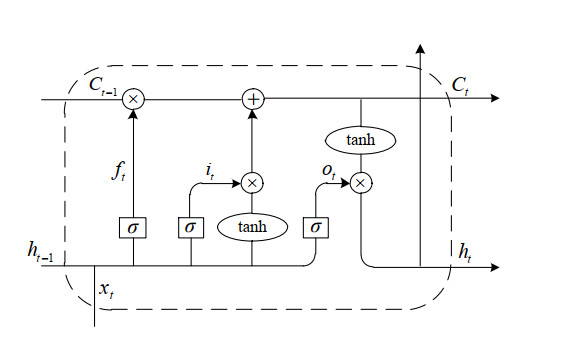
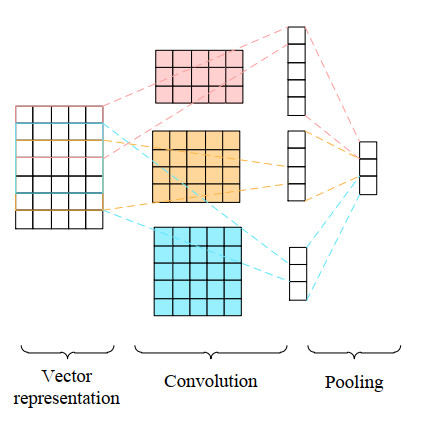
The operation and maintenance of railway signal systems create a significant and complex quantity of text data about faults. Aiming at the problems of fuzzy entity boundaries and low accuracy of entity recognition in the field of railway signal equipment faults, this paper provides a method for entity recognition of railway signal equipment fault information based on RoBERTa-wwm and deep learning integration. First, the model utilizes the RoBERTa-wwm pretrained language model to get the word vector of text sequences. Second, a parallel network consisting of a BiLSTM and a CNN is constructed to obtain the context feature information and the local attention information, respectively. Third, the feature vectors output from BiLSTM and CNN are combined and fed into MHA, focusing on extracting key feature information and mining the connection between different features. Finally, the label sequences with constraint relationships are outputted in CRF to complete the entity recognition task. The experimental analysis is carried out with fault text of railway signal equipment in the past ten years, and the experimental results show that the model has a higher evaluation index compared with the traditional model on this dataset, in which the precision, recall and F1 value are 93.25%, 92.45%, and 92.85%, respectively.

| [1] | L. Tong, Introduction to railways, China Railway Publishing House, (2016), 37–45. |
| [2] | A. Singhal, Introducing the knowledge graph: Things, not strings, 2012. Available from: https://blog.google/products/search/introducing-knowledge-graph-things-not/ |
| [3] |
H. Sun, X. Li, Named entity recognition for power distribution network data, Comput. Syst. Appl., 32 (2023), 387–393. https://doi.org/10.1145/1390156.1390177 doi: 10.1145/1390156.1390177

|
| [4] |
Y. Chen, Q. Dai, J. Liu, Named entity recognition of railway accident texts with character position features, Comput. Syst. Appl., 31 (2022), 211–219. https://doi.org/10.15888/j.cnki.csa.008860 doi: 10.15888/j.cnki.csa.008860
|
| [5] | J. Yang, Y. Zhang, L. Li, X. Li, F. Liu, T. Solorio, YEDDA: A lightweight collaborative text span annotation tool, In Proceedings of the 56th Annual Meeting of the Association for Computational Linguistics, (2018), 31–36. |
| [6] | H. Wang, G. Qi, H. Chen, Knowledge graph methods, practices and applications, Publish. House Electron. Industry, (2019), 137–142. |
| [7] |
H. Yu, H. Zhang, Q. Liu, X. Lv, S. Shi, Chinese named entity identification using cascaded hidden Markov model, J. Commun., 27 (2006), 87–94. https://doi.org/10.3321/j.issn:1000-436X.2006.02.013 doi: 10.3321/j.issn:1000-436X.2006.02.013
|
| [8] | Y. Zhang, Z. Xu, X. Xue, Fusion of multiple features for Chinese named entity recognition based on Maximum Entropy Model, J. Comput. Res. Dev., 45 (2008), 1004–1010. https://doi.org/CNKI:SUN:JFYZ.0.2008-06-013 |
| [9] |
L. Wu, L. Liu, H. Li, Y. Gao, A Chinese toponym recognition method based on Conditional Random Field, Geomat. Info. Sci. Wuhan. Univ., 42 (2017), 150–156. https://doi.org/10.13203/j.whugis20141009 doi: 10.13203/j.whugis20141009
|
| [10] |
Y. He, F. Du, Y. Shi, L. Song, Survey of named entity recognition based on deep learning, Comput. Eng. Appl., 57 (2021), 21–36. https://doi.org/10.3778/j.issn.1002-8331.2012-0170 doi: 10.3778/j.issn.1002-8331.2012-0170
|
| [11] | Z. Huang, K. Xu, K. Yu, Bidirectional LSTM-CRF models for sequence tagging, 2015. Available from: https://doi.org/10.48550/arXiv.1508.01991 |
| [12] | L. Yang, Research of railway fault accident text big data mining key technologies and application, Ph.D thesis, China Academy of Railway Sciences in Beijing, 2018. https://doi.org/CNKI: CDMD: 1.1018.130739 |
| [13] | T. Mikolov, K. Chen, G. Corrado, J. Dean, Efficient estimation of word representations in vector space, In Proceedings of the 1th International Conference on Learning Representations, (2013). |
| [14] |
J. Kong, L. Zhang, M. Jiang, T. Liu, Incorporating multi-level CNN and attention mechanism for Chinese clinical named entity recognition, J. Biomed. Inform., 116 (2021), 103737. https://doi.org/10.1016/j.jbi.2021.103737 doi: 10.1016/j.jbi.2021.103737
|
| [15] |
C, Li, K. M, Entity recognition of Chinese medical text based on multi-head self-attention combined with BILSTM-CRF, Math. Biosci. Eng., 19 (2022), 2206–2218. https://doi.org/10.3934/mbe.2022103 doi: 10.3934/mbe.2022103
|
| [16] | J. Devlin, M. W. Chang, K. Lee, K. Toutanova, Bert: Pre-training of deep bidirectional transformers for language understanding, In Proceedings of the 2019 Conference of the North American Chapter of the Association for Computational Linguistics: Human Language Technologies, 1 (2019), 4171–4186. https://doi.org/10.18653/v1/N19-1423 |
| [17] | A. Radford, J. Wu, R. Child, D. Luan, D. Amodei, I. Sutskever, Language models are unsupervised multitask learners, 2019. Available from: https://insightcivic.s3.us-east-1.amazonaws.com/language-models.pdf |
| [18] |
T. Yuan, X. Qin, C. Wei, A Chinese named entity recognition method based on ERNIE-BiLSTM-CRF for food safety domain, Appl. Sci., 13 (2023), 2849. https://doi.org/10.3390/app13052849 doi: 10.3390/app13052849
|
| [19] |
Q. An, B. Pan, Z. Liu, S. Du, Y. Cui, Chinese named entity recognition in football based on ALBERT-BiLSTM Model, Appl. Sci., 13 (2023), 10814. https://doi.org/10.3390/app131910814 doi: 10.3390/app131910814
|
| [20] |
Z. Guo, X. Deng, Intelligent identification method of legal case entity based on BERT-BiLSTM-CRF, J. Beijing. Univ. Posts. Telecom., 44 (2021), 129–134. https://doi.org/10.13190/j.jbupt.2020-241 doi: 10.13190/j.jbupt.2020-241
|
| [21] |
L. Li, H. Zhou, X. Guo, C. Liu, J. Su, Z. Tang, Named entity recognition of diseases and insect pests based on multi source information fusion, Trans. Chin. Soc. Agric. Mach., 52 (2021), 253–263. https://doi.org/10.6041/j.issn.1000-1298.2021.12.027 doi: 10.6041/j.issn.1000-1298.2021.12.027
|
| [22] |
H. Lin, W. Bai, R. Lu, R. Lu, Z. Zhao, X. Li, Named entity recognition of fault information of high-speed railway turnout from BMBC model, J. Railw. Sci. Eng., 20 (2023), 1149–1159. https://doi.org/10.19713/j.cnki.43-1423/u.t20220637 doi: 10.19713/j.cnki.43-1423/u.t20220637
|
| [23] | X. Ma, E. Hovy, End-to-end sequence labeling via bi-directional LSTM-CNNs-CRF, In Proceedings of the 54th Annual Meeting of the Association for Computational Linguistics, 1 (2016), 1064–1074. https://doi.org/10.18653/v1/P16-1101 |
| [24] | Y. Liu, M. Ott, N. Goyal, J. Du, M. Joshi, D. Chen, et al., RoBERTa: A robustly optimized BERT pretraining approach, In Proceedings of the 8th International Conference on Learning Representations, (2020), 26–30. |
| [25] |
Y. Zhang, Y. Wang, B. Li, Identifying named entities of Chinese electronic medical records based on RoBERTa-wwm dynamic fusion model, Data. Anal. Knowl. Discov., 6 (2022), 242–250. https://doi.org/10.11925/infotech.2096-3467.2021.0951 doi: 10.11925/infotech.2096-3467.2021.0951
|
| [26] |
X. Li, T. Shi, P. Li, M. Dai, X. Zhang, Research on knowledge extraction method for High-speed railway signal equipment fault based on text, J. Chin. Rail. Soc., 43 (2021), 92–100. https://doi.org/10. 3969/j.issn.1001-8360.2021.03.012 doi: 10.3969/j.issn.1001-8360.2021.03.012
|
| [27] |
J. Tian, H. Song, L. Chen, G. Sheng, X. Jiang, Entity recognition approach of equipment failure text for knowledge graph construction, Power. Syst. Technol., 46 (2022), 3913–3922. https://doi.org/10.13335/j.1000-3673.pst.2021.1886 doi: 10.13335/j.1000-3673.pst.2021.1886
|
| [28] |
J. Liu, H. Yang, Z. Sun, H. Yang, L. Shao, H. Yu, et al., Named entity recognition for the diagnosis and treatment of aquatic animal diseases using knowledge graph construction, Trans. Chin. Soc. Agric. Eng., 38 (2022), 210–217. https://doi.org/10.11975/j.issn.1002-6819.2022.07.023 doi: 10.11975/j.issn.1002-6819.2022.07.023
|
| [29] |
J. Yu, W. Zhu, L. Liao, Entity recognition of support policy text based on RoBERTa-wwm-BiLSTM-CRF, Comput. Eng. Sci., 45 (2023), 1498–1507. https://doi.org/10.3969/j.issn.1007-130X.2023.08.019 doi: 10.3969/j.issn.1007-130X.2023.08.019
|
| [30] |
J. Lin, E. Liu, Research on named entity recognition method of metro on-board equipment based on multiheaded self-attention mechanism and CNN-BiLSTM-CRF, Comput. Intell. Neurosci., 2022 (2022), 1687–5273. https://doi.org/10.1155/2022/6374988 doi: 10.1155/2022/6374988
|
| [31] |
S. Cheng, I. C. Prentice, Y. Huang, Y. Jin, Y. Guo, R. Arcucci, Data-driven surrogate model with latent data assimilation: Application to wildfire forecasting, J. Comput. Phys., 464 (2022). https://doi.org/10.1016/j.jcp.2022.111302 doi: 10.1016/j.jcp.2022.111302
|
| [32] |
Y. Zhang, S. Cheng, N. Kovalchuk, M. Simmons, O. K. Matar, Y. Guo, et al., Ensemble latent assimilation with deep learning surrogate model: Application to drop interaction in a microfluidics device, Lab Chip, 22 (2022), 3187–3202. https://doi.org/10.1039/D2LC00303A doi: 10.1039/D2LC00303A
|
| [33] | A. Vaswani, N. Shazeer, N. Parmar, J. Uszkoreit, L. Jones, A. N. Gomez, et al., Attention is all you need, In Proceedings of the 31st International Conference on Neural Information Processing Systems, (2017), 6000–6010. |
Figures(7) / Tables(12)

Junting Lin, Shan Li, Ning Qin, Shuxin Ding. Entity recognition of railway signal equipment fault information based on RoBERTa-wwm and deep learning integration[J]. Mathematical Biosciences and Engineering, 2024, 21(1): 1228-1248. doi: 10.3934/mbe.2024052


 DownLoad: