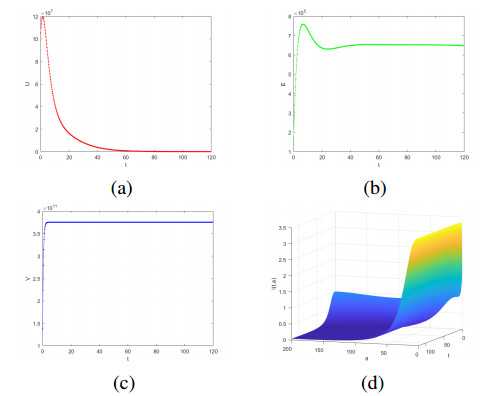
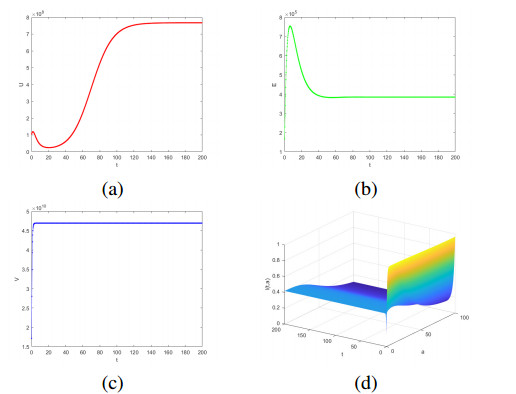
Cancer is recognized as one of the serious diseases threatening human health. Oncolytic therapy is a safe and effective new cancer treatment method. Considering the limited ability of uninfected tumor cells to infect and the age of infected tumor cells have a significant effect on oncolytic therapy, an age-structured model of oncolytic therapy involving Holling-Ⅱ functional response is proposed to investigate the theoretical significance of oncolytic therapy. First, the existence and uniqueness of the solution is obtained. Furthermore, the stability of the system is confirmed. Then, the local stability and global stability of infection-free homeostasis are studied. The uniform persistence and local stability of the infected state are studied. The global stability of the infected state is proved by constructing the Lyapunov function. Finally, the theoretical results are verified by numerical simulation. The results show that when the tumor cells are at the appropriate age, injection of the right amount of oncolytic virus can achieve the purpose of tumor treatment.
Citation: Lu Gao, Yuanshun Tan, Jin Yang, Changcheng Xiang. Dynamic analysis of an age structure model for oncolytic virus therapy[J]. Mathematical Biosciences and Engineering, 2023, 20(2): 3301-3323. doi: 10.3934/mbe.2023155
Cancer is recognized as one of the serious diseases threatening human health. Oncolytic therapy is a safe and effective new cancer treatment method. Considering the limited ability of uninfected tumor cells to infect and the age of infected tumor cells have a significant effect on oncolytic therapy, an age-structured model of oncolytic therapy involving Holling-Ⅱ functional response is proposed to investigate the theoretical significance of oncolytic therapy. First, the existence and uniqueness of the solution is obtained. Furthermore, the stability of the system is confirmed. Then, the local stability and global stability of infection-free homeostasis are studied. The uniform persistence and local stability of the infected state are studied. The global stability of the infected state is proved by constructing the Lyapunov function. Finally, the theoretical results are verified by numerical simulation. The results show that when the tumor cells are at the appropriate age, injection of the right amount of oncolytic virus can achieve the purpose of tumor treatment.

| [1] |
F. Bray, J. Ferlay, I. Soerjomataram, R. Siegel, L. Torre, A. Jemal, Global cancer statistics 2018: Globocan estimates of incidence and mortality worldwide for 36 cancers in 185 countries, CA A Cancer J. Clin., 68 (2018), 394–424. https://doi.org/10.3322/caac.21492 doi: 10.3322/caac.21492

|
| [2] |
E. Antonio-Chiocca, Oncolytic viruses, Nat. Rev. Cancer, 2 (2002), 938–950. https://doi.org/10.1038/nrc948 doi: 10.1038/nrc948
|
| [3] |
H.L. Kaufman, D. Maciorowski, Advancing oncolytic virus therapy by understanding the biology, Nat. Rev. Clin. Oncol., 18 (2021), 197–198. https://doi.org/10.1038/s41571-021-00490-4 doi: 10.1038/s41571-021-00490-4
|
| [4] |
L. Aurelian, Oncolytic virotherapy: The questions and the promise, Oncolyt. Virother., 2 (2013), 19–29. https://doi.org/10.2147/OV.S39609 doi: 10.2147/OV.S39609
|
| [5] |
H. Fukuhara, Y. Ino, T, Todo, Oncolytic virus therapy: A new era of cancer treatment at dawn, Nihon Rinsho Japanese J. Clin. Med., 107 (2016), 1373–1379. https://doi.org/10.1111/cas.13027 doi: 10.1111/cas.13027
|
| [6] |
C. Ribacka, S. Pesonen, A. Hemminki, Cancer, stem cells, and oncolytic viruses, Ann. Med., 40 (2008), 496–505. :https://doi.org/10.1080/07853890802021342 doi: 10.1080/07853890802021342
|
| [7] | Z. D. Ezzeddine, R. L. Martuza, D. Platika, M. P. Short, A. Malick, B. Choi, et al., Selective killing of glioma cells in culture and in vivo by retrovirus transfer of the herpes simplex virus thymidine kinase gene, New Biol., 3 (1991), 608–614. |
| [8] | H. Demisse, An overview on oncolytic viruses as cancer therapy, Int. J. Cancer Stud. Res., 6 (2017), 122–130. |
| [9] |
H. Yang, Y. S. Tan, Dynamic behavior of prostate cancer cells under antitumor immunity and pulse vaccination in a random environment, Nonlinear Dynam., 105 (2021), 2645–2664. https://doi.org/10.1007/s11071-021-06745-0 doi: 10.1007/s11071-021-06745-0
|
| [10] |
K. Garber, China approves world's first oncolytic virus therapy for cancer treatment, J. Nat. Cancer Instit., 98 (2006), 298–300. https://doi.org/10.1093/jnci/djj111 doi: 10.1093/jnci/djj111
|
| [11] |
S. E. Lawler, M. C. Speranza, C. F. Cho, E. A. Chiocca, Oncolytic viruses in cancer treatment: A review, JAMA Oncol., 3 (2017), 841–849. https://doi.org/10.1001/jamaoncol.2016.2064 doi: 10.1001/jamaoncol.2016.2064
|
| [12] |
N. L. Komarova, D. Wodarz, ODE models for oncolytic virus dynamics, J. Theor. Biol., 263 (2010), 530–543. https://doi.org/10.1016/j.jtbi.2010.01.009 doi: 10.1016/j.jtbi.2010.01.009
|
| [13] | D. Wodarz, N. Komarova, Dynamics of cancer: Mathematical foundations of oncology, World Scientific, 2014. |
| [14] |
W. Si, W. N. Zhang, Control exponential growth of tumor cells with slow spread of oncolytic virus, J. Theor. Biol., 367 (2015), 111–129. https://doi.org/10.1016/j.jtbi.2014.11.015 doi: 10.1016/j.jtbi.2014.11.015
|
| [15] |
M. Agarwal, A. S. Bhadauria, Mathematical modeling and analysis of tumor therapy with oncolytic virus, Appl. Math., 2 (2011), 131–140. https://doi.org/:10.4236/am.2011.210 doi: 10.4236/am.2011.210
|
| [16] |
J. Malinzi, P. Sibanda, H. Mambili-Mamboundou, Analysis of virotherapy in solid tumor invasion, Math. Biosci., 263 (2015), 102–110. https://doi.org/10.1016/j.mbs.2015.01.015 doi: 10.1016/j.mbs.2015.01.015
|
| [17] |
M. J. Piotrowska, An immune system–tumour interactions model with discrete time delay: Model analysis and validation, Commun. Nonlinear Sci. Numer. Simul., 34 (2016), 185–198. https://doi.org/10.1016/j.cnsns.2015.10.022 doi: 10.1016/j.cnsns.2015.10.022
|
| [18] |
A. Friedman, X. L. Lai, Combination therapy for cancer with oncolytic virus and checkpoint inhibitor: A mathematical model, PloS One, 13 (2018), 1–21. https://doi.org/10.1371/journal.pone.0192449 doi: 10.1371/journal.pone.0192449
|
| [19] |
A. Jenner, A. Coster, P. Kim, F. Frascoli, Treating cancerous cells with viruses, Letters Biomath., 5 (2018), S117–S136. https://doi.org/10.30707/LiB5.2Jenner doi: 10.30707/LiB5.2Jenner
|
| [20] |
A. L. Jenner, C. O. Yun, P. S. Kim, A. C. F. Coster, Mathematical modelling of the interaction between cancer cells and an oncolytic virus: Insights into the effects of treatment protocols, Bull. Math. Biol., 80 (2018), 1615–1629. https://doi.org/10.1007/s11538-018-0424-4 doi: 10.1007/s11538-018-0424-4
|
| [21] |
D. Wodarz, Computational modeling approaches to the dynamics of oncolytic viruses, Wiley Interd. Rev. Syst. Biol. Med., 8 (2016), 242–252. https://doi.org/10.1002/wsbm.1332 doi: 10.1002/wsbm.1332
|
| [22] |
A. T. Power, J. C. Bell, Cell-based delivery of oncolytic viruses: a new strategic alliance for a biological strike against cancer, Molecular Ther., 15 (2007), 660–665. https://doi.org/10.1038/sj.mt.6300098 doi: 10.1038/sj.mt.6300098
|
| [23] |
Z. Abernathy, K. Abernathy, J. Stevens, A mathematical model for tumor growth and treatment using virotherapy, AIMS Math., 5 (2020), 4136–-4150. https://doi.org/10.3934/math.2020265 doi: 10.3934/math.2020265
|
| [24] | D. Wodarz, Viruses as antitumor weapons: Defining conditions for tumor remission, Cancer Res., 61 (2001), 3501–3507. |
| [25] |
Ž. Bajzer, T. Carr, K. Josić, S. J. Russell, D. Dingli, Modeling of cancer virotherapy with recombinant measles viruses, J. Theor. Biol., 252 (2008), 109–122. https://doi.org/10.1016/j.jtbi.2008.01.016 doi: 10.1016/j.jtbi.2008.01.016
|
| [26] |
M. I. Titze, J. Frank, M. Ehrhardt, S. Smola, N. Graf, T. Lehr, A generic viral dynamic model to systematically characterize the interaction between oncolytic virus kinetics and tumor growth, European J. Pharm. Sci., 97 (2017), 38–46. https://doi.org/10.1016/j.ejps.2016.11.003 doi: 10.1016/j.ejps.2016.11.003
|
| [27] |
G. V. R. K. Vithanage, H. C. Wei, S. R. J. Jang, Bistability in a model of tumor-immune system interactions with an oncolytic viral therapy, Math. Biosci. Eng., 19 (2021), 1559–1587. https://doi.org/10.3934/mbe.2022072 doi: 10.3934/mbe.2022072
|
| [28] |
Q. Li, Y. N. Xiao, Modeling the virus-induced tumor-specific immune response with delay in tumor virotherapy, Commun. Nonlinear Sci. Numer. Simul., 108 (2022), 106196. https://doi.org/10.1016/j.cnsns.2021.106196 doi: 10.1016/j.cnsns.2021.106196
|
| [29] |
K. J. Mahasa, R. Ouifki, A. Eladdadi, L. de-Pillis, A combination therapy of oncolytic viruses and chimeric antigen receptor T cells: A mathematical model proof-of-concept, Math. Biosci. Eng., 19 (2022), 4429–4457. https://doi.org/ 10.3934/mbe.2022205 doi: 10.3934/mbe.2022205
|
| [30] |
S. M. Al-Tuwairqi, N. O. Al-Johani, E. A. Simbawa, Modeling dynamics of cancer virotherapy with immune response, Adv. Differ. Equat., 438 (2020), 1–26. https://doi.org/10.1186/s13662-020-02893-6 doi: 10.1186/s13662-020-02893-6
|
| [31] |
H. R. Thieme, C. Castillo-Chavez, How may infection-age-dependent infectivity affect the dynamics of HIV/AIDS?, SIAM J. Appl. Math., 53 (1993), 1447-1479. https://doi.org/10.1137/0153068 doi: 10.1137/0153068
|
| [32] |
C. L. Althaus, A. S. De Vos, R. J. De Boer, Reassessing the human immunodeficiency virus type 1 life cycle through age-structured modeling: Life span of infected cells, viral generation time, and basic reproductive number, R0, J. Virol., 83 (2009), 7659–7667. https://doi.org/10.1128/JVI.01799-08 doi: 10.1128/JVI.01799-08
|
| [33] |
Y. S. Tan, X. X. Li, J. Yang, R. Cheke, Global stability of an age-structured model of smoking and its treatment, Int. J. Biomath., 16 (2023). https://doi.org/10.1142/S1793524522500632 doi: 10.1142/S1793524522500632
|
| [34] |
J. L. Wang, G. Huang, Y. Takeuchi, S. Q. Liu, SVEIR epidemiological model with varying infectivity and distributed delays, Math. Biosci. Eng., 8 (2011), 875–888. https://doi.org/10.3934/mbe.2011.8.875 doi: 10.3934/mbe.2011.8.875
|
| [35] |
P. W. Nelson, M. A. Gilchrist, D. Coombs, J. M. Hyman, A. S. Perelson, An age-structured model of HIV infection that allows for variations in the production rate of viral particles and the death rate of productively infected cells, Math. Biosci. Eng., 1 (2004), 267–288. https://doi.org/10.3934/mbe.2004.1.267 doi: 10.3934/mbe.2004.1.267
|
| [36] |
J. L. Wang, J. Y. Lang, X. F. Zou, Analysis of an age structured HIV infection model with virus-to-cell infection and cell-to-cell transmission, Nonlinear Anal. Real World Appl., 34 (2017), 75–96. https://doi.org/10.1016/j.nonrwa.2016.08.001 doi: 10.1016/j.nonrwa.2016.08.001
|
| [37] |
Y. Zhao, M. T. Li, S. L. Yuan, Analysis of transmission and control of tuberculosis in Mainland China, 2005—2016, based on the age-structure mathematical model, Int. J. Environ. Res. Public Health, 14 (2017), 1192–1206. https://doi.org/10.3390/ijerph14101192 doi: 10.3390/ijerph14101192
|
| [38] |
R. Qesmi, S. ElSaadany, J. M. Heffernan, J. H. Wu, A hepatitis B and C virus model with age since infection that exhibits backward bifurcation, SIAM J. Appl. Math., 71 (2011), 1509–1530. https://doi.org/10.1137/10079690X doi: 10.1137/10079690X
|
| [39] |
X. C. Duan, Yuan, S. L. Yuan, K. F. Wang, Dynamics of a diffusive age-structured HBV model with saturating incidence, Math. Biosci. Eng., 13 (2016), 935–968. https://doi.org/10.3934/mbe.2016024 doi: 10.3934/mbe.2016024
|
| [40] |
M. W. Shen, Y. N. Xiao, L. B. Rong, Global stability of an infection-age structured HIV-1 model linking within-host and between-host dynamics, Math. Biosci., 263 (2015), 37–50. https://doi.org/10.1016/j.mbs.2015.02.003 doi: 10.1016/j.mbs.2015.02.003
|
| [41] |
C. Y. Ding, Z. Z. Wang, Q. Zhang, Age-structure model for oncolytic virotherapy, Int. J. Biomath., 15 (2022), 1192. https://doi.org/10.1142/S1793524521500911 doi: 10.1142/S1793524521500911
|
| [42] |
J. H. Pang, J. Chen, Z. J. Liu, P. Bi, S. G. Ruan, Local and global stabilities of a viral dynamics model with infection-age and immune response, J. Dynam. Differ. Equat., 31 (2019), 793–-813. https://doi.org/10.1007/s10884-018-9663-1 doi: 10.1007/s10884-018-9663-1
|
| [43] | M. Iannelli, Mathematical theory of age-structured population dynamics, Giardini editori e stampatori in Pisa, (1995). |
| [44] |
H. Inaba, H. Sekine, A mathematical model for Chagas disease with infection-age-dependent infectivity, Math. Biosci., 190 (2004), 39–69. https://doi.org/10.1016/j.mbs.2004.02.004 doi: 10.1016/j.mbs.2004.02.004
|
| [45] |
J. K. Hale, P. Waltman, Persistence in infinite-dimensional systems, SIAM J. Math. Anal., 20 (1989), 388–395. https://doi.org/10.1137/0520025 doi: 10.1137/0520025
|
| [46] |
P. Magal, X. Q. Zhao, Global attractors and steady states for uniformly persistent dynamical systems, SIAM J. Math. Anal., 37 (2005), 251–275. https://doi.org/10.1137/S0036141003439173 doi: 10.1137/S0036141003439173
|
| [47] |
P. S. Kim, J. J. Crivelli, I. K. Choi, C. O. Yun, J. R. Wares, Quantitative impact of immunomodulation versus oncolysis with cytokine-expressing virus therapeutics, Math. Biosci. Eng., 12 (2015), 841–858. https://doi.org/10.3934/mbe.2015.12.841 doi: 10.3934/mbe.2015.12.841
|
Figures(2) / Tables(1)

Lu Gao, Yuanshun Tan, Jin Yang, Changcheng Xiang. Dynamic analysis of an age structure model for oncolytic virus therapy[J]. Mathematical Biosciences and Engineering, 2023, 20(2): 3301-3323. doi: 10.3934/mbe.2023155


 DownLoad: