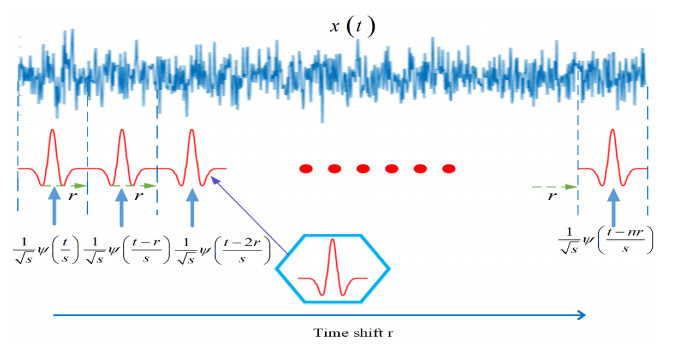
A bearing is an important and easily damaged component of mechanical equipment. For early fault diagnosis of ball bearings, acoustic emission signals are more sensitive and less affected by mechanical background noise. To cope with the large amount of data brought by the high sampling frequency and high sampling points of acoustic emission signals, a compressed sensing processing framework is introduced to research data compression and feature extraction, and a wavelet sparse convolutional network is proposed for resolved diagnosis and evaluation. The main research objective of this paper is to maximize the compression rate of the signal under the constraint of ensuring the reconstruction error of the acoustic emission signal, which can reduce the data volume of the acoustic emission signal and reduce the pressure of data analysis for subsequent fault diagnosis. At the same time, a wide convolution kernel based on a continuous wavelet is introduced when designing the neural network, and the energy information of different frequency bands of the signal is extracted by the wavelet convolution kernel to characterize the fault characteristics of the equipment. The energy pooling layer is designed to enhance the deep mining ability of compressed features, and the regularized loss function is introduced to improve the diagnostic accuracy and robustness through feature sparseness. The experimental results show that the method can effectively extract the fault characteristics of the bearing acoustic emission signal, improve the analysis efficiency and accurately classify the bearing faults.
Citation: Jinyi Tai, Chang Liu, Xing Wu, Jianwei Yang. Bearing fault diagnosis based on wavelet sparse convolutional network and acoustic emission compression signals[J]. Mathematical Biosciences and Engineering, 2022, 19(8): 8057-8080. doi: 10.3934/mbe.2022377
A bearing is an important and easily damaged component of mechanical equipment. For early fault diagnosis of ball bearings, acoustic emission signals are more sensitive and less affected by mechanical background noise. To cope with the large amount of data brought by the high sampling frequency and high sampling points of acoustic emission signals, a compressed sensing processing framework is introduced to research data compression and feature extraction, and a wavelet sparse convolutional network is proposed for resolved diagnosis and evaluation. The main research objective of this paper is to maximize the compression rate of the signal under the constraint of ensuring the reconstruction error of the acoustic emission signal, which can reduce the data volume of the acoustic emission signal and reduce the pressure of data analysis for subsequent fault diagnosis. At the same time, a wide convolution kernel based on a continuous wavelet is introduced when designing the neural network, and the energy information of different frequency bands of the signal is extracted by the wavelet convolution kernel to characterize the fault characteristics of the equipment. The energy pooling layer is designed to enhance the deep mining ability of compressed features, and the regularized loss function is introduced to improve the diagnostic accuracy and robustness through feature sparseness. The experimental results show that the method can effectively extract the fault characteristics of the bearing acoustic emission signal, improve the analysis efficiency and accurately classify the bearing faults.

| [1] |
Y. Lv, J. Luo, C. Yi, Enhanced orthogonal matching pursuit algorithm and its application in mechanical equipment fault diagnosis, Shock Vib., 2017 (2017), 1–13. https://doi.org/10.1155/2017/4896056 doi: 10.1155/2017/4896056

|
| [2] |
T. R. Kurfess, S. Billington, S. Y. Liang, Advanced diagnostic and prognostic techniques for rolling element bearings, Springer London, (2006), 137–165. https://doi.org/10.1007/1-84628-269-1_6 doi: 10.1007/1-84628-269-1_6
|
| [3] |
C. Liu, K. Gryllias, A Semi-supervised support vector data description-based fault detection method for rolling element bearings based on cyclic spectral analysis, Mech. Syst. Sig. Process., 140 (2020), 106682. https://doi.org/10.1016/j.ymssp.2020.106682 doi: 10.1016/j.ymssp.2020.106682
|
| [4] |
Q. Ni, J. C. Ji, K. Feng, B. Halkon, A fault information-guided variational mode decomposition (FIVMD) method for rolling element bearings diagnosis, Mech. Syst. Sig. Process., 164 (2022), 108216. https://doi.org/10.1016/j.ymssp.2021.108216 doi: 10.1016/j.ymssp.2021.108216
|
| [5] |
Q. Ni, J. C. Ji, K. Feng, B. J. Halkon, A novel correntropy-based band selection method for the fault diagnosis of bearings under fault-irrelevant impulsive and cyclostationary interferences, Mech. Syst. Sig. Process., 153 (2020), 107498. https://doi.org/10.1016/j.ymssp.2020.107498 doi: 10.1016/j.ymssp.2020.107498
|
| [6] | H. An, W. Liang, Y. Zhang, Y. Li, Y. Liang, J. Tan, Rotate vector reducer crankshaft fault diagnosis using acoustic emission techniques, in 2017 5th International Conference on Enterprise Systems (ES), (2017), 294–298. https://doi.org/10.1109/ES.2017.55 |
| [7] |
Y. Zhang, W. Lu, F. Chu, Planet gear fault localization for wind turbine gearbox using acoustic emission signals, Renewable Energy, 109 (2017), 449–460. https://doi.org/10.1016/j.renene.2017.03.035 doi: 10.1016/j.renene.2017.03.035
|
| [8] |
D. L. Donoho, Compressed sensing, IEEE Trans. Inf. Theory, 52 (2006), 1289–1306. https://doi.org/10.1109/TIT.2006.871582 doi: 10.1109/TIT.2006.871582
|
| [9] |
X. Zhang, N. Hu, C. Zhe, A bearing fault detection method base on compressed sensing, engineering asset management-systems, Eng. Asset Manage.-Syst., (2015), 789–798. https://doi.org/10.1007/978-3-319-09507-3_69 doi: 10.1007/978-3-319-09507-3_69
|
| [10] |
G. Tang, W. Hou, H. Wang, G. Luo, J. Ma, Compressive sensing of roller bearing faults via harmonic detection from under-sampled vibration signals, Sensors (Basel, Switzerland), 15 (2015), 25648–25662. https://doi.org/10.3390/s151025648 doi: 10.3390/s151025648
|
| [11] |
Y. Wang, J. Xiang, Q. Mo, S. He, Compressed sparse time–frequency feature representation via compressive sensing and its applications in fault diagnosis, Measurement, 68 (2015), 70–81. https://doi.org/10.1016/j.measurement.2015.02.046 doi: 10.1016/j.measurement.2015.02.046
|
| [12] |
Q. Y. G. Tang, H. Q. Wang, G. Luo, J. Ma, Sparse classification of rotating machinery faults based on compressive sensing strategy, Mechatronics, 31 (2015), 60–67. https://doi.org/10.1016/j.mechatronics.2015.04.006 doi: 10.1016/j.mechatronics.2015.04.006
|
| [13] |
L. Chang, W. Xing, J. Mao, X. Liu, Acoustic emission signal processing for rolling bearing running state assessment using compressive sensing, Mech. Syst. Sig. Process., 91 (2017), 395–406. https://doi.org/10.1016/j.ymssp.2016.12.010 doi: 10.1016/j.ymssp.2016.12.010
|
| [14] |
H. Ahmed, M. Wong, A. K. Nandi, Intelligent condition monitoring method for bearing faults from highly compressed measurements using sparse over-complete features, Mech. Syst. Sig. Process., 99 (2018), 459–477. https://doi.org/10.1016/j.ymssp.2017.06.027 doi: 10.1016/j.ymssp.2017.06.027
|
| [15] |
H. Shao, H. Jiang, H. Zhang, W. Duan, T. Liang, S. Wu, Rolling bearing fault feature learning using improved convolutional deep belief network with compressed sensing, Mech. Syst. Sig. Process., 100 (2018), 743–765. https://doi.org/10.1016/j.ymssp.2017.08.002 doi: 10.1016/j.ymssp.2017.08.002
|
| [16] |
H. Yuan, X. Wang, X. Sun, Z. Ju, Compressive sensing-based feature extraction for bearing fault diagnosis using a heuristic neural network, Meas. Sci. Technol., 28 (2017), 065018. https://doi.org/10.1088/1361-6501/aa6a07 doi: 10.1088/1361-6501/aa6a07
|
| [17] |
R. Chen, X. Huang, L. Yang, X. Xu, X. Zhang, Y. Zhang, Intelligent fault diagnosis method of planetary gearboxes based on convolution neural network and discrete wavelet transform, Comput. Ind., 106 (2019), 48–59. https://doi.org/10.1016/j.compind.2018.11.003 doi: 10.1016/j.compind.2018.11.003
|
| [18] |
E. Candes, T. Tao, Near optimal signal recovery from random projections: Universal encoding strategies?, IEEE Trans. Inf. Theory, 52 (2004), 5406–5425. https://doi.org/10.1109/TIT.2006.885507 doi: 10.1109/TIT.2006.885507
|
| [19] | J. I. Xiu-Xia, X. X. Bian, Study on performance of greedy algorithms for signal reconstruction, Comput. Simul., 2013. |
| [20] |
M. A. Davenport, M. F. Duarte, Y. C. Eldar, G. Kutyniok, Introduction to compressed sensing, Citeseer, (2012), 1–64. https://doi.org/10.1017/CBO9780511794308.002 doi: 10.1017/CBO9780511794308.002
|
| [21] |
J. Schmidhuber, Deep learning in neural networks: An overview, Neural Networks, 61 (2015), 85–117. https://doi.org/10.1016/j.neunet.2014.09.003 doi: 10.1016/j.neunet.2014.09.003
|
| [22] |
R. Socher, Y. Bengio, C. D. Manning, Deep learning for NLP (without magic), Acl. Tuto., 2012 (2013), 5–5. https://dl.acm.org/doi/pdf/10.5555/2390500.2390505 doi: 10.5555/2390500.2390505
|
| [23] |
G. Hinton, L. Deng, D. Yu, G. E. Dahl, B. Kingsbury, Deep neural networks for acoustic modeling in speech recognition: The shared views of four research groups, IEEE Sig. Process.Mag., 29 (2012), 82–97. https://doi.org/10.1109/MSP.2012.2205597 doi: 10.1109/MSP.2012.2205597
|
| [24] |
T. Li, Z. Zhao, C. Sun, L. Cheng, R. X. Gao, WaveletKernelNet: An interpretable deep neural network for industrial intelligent diagnosis, IEEE Trans. Syst., 52 (2019), 2302–2312. https://doi.org/10.1109/TSMC.2020.3048950 doi: 10.1109/TSMC.2020.3048950
|
| [25] |
F. Y. Guo, Y. C. Zhang, Y. Wang, P. Wang, P. J. Ren, R. Guo, X. Y. Wang, Fault detection of reciprocating compressor valve based on one-dimensional convolutional neural network, Math. Probl. Eng., 2020 (2020). https://doi.org/10.1155/2020/8058723 doi: 10.1155/2020/8058723
|
| [26] |
D. T. Hoang, T. T. Xuan, M. Van, H. J. Kang, A deep neural network-based feature fusion for bearing fault diagnosis, Sensors, 21 (2021), 244. https://doi.org/10.3390/s21010244 doi: 10.3390/s21010244
|
| [27] | D. E. Rumelhart, Learning internal representations by error propagation, In D. E. Rumelhart, J. L. McCelland and PDP Research Group, Parallel Distrib. Process., 1 (1986). https://dl.acm.org/doi/10.5555/104279.104293 |
| [28] |
K. F. Al-Raheem, A. Roy, K. P. Ramachandran, D. K. Harrison, S. Grainger, Application of the laplace-wavelet combined with ANN for rolling bearing fault diagnosis, J. Vib. Acoust., 130 (2008), 3077–3100. https://doi.org/10.1115/1.2948399 doi: 10.1115/1.2948399
|
| [29] |
M. Liao, C. Liu, C. Wang, J. Yang, Research on a rolling bearing fault detection method with wavelet convolution deep transfer learning, IEEE Access, 9 (2021), 45175–45188. https://doi.org/10.1109/ACCESS.2021.3067152 doi: 10.1109/ACCESS.2021.3067152
|
| [30] |
C. Wang, C. Liu, M. Liao, Q. Yang, An enhanced diagnosis method for weak fault features of bearing acoustic emission signal based on compressed sensing, Math. Biosci. Eng., 18 (2021), 1670–1688. https://doi.org/10.3934/mbe.2021086 doi: 10.3934/mbe.2021086
|


Figures(12) / Tables(7)

Jinyi Tai, Chang Liu, Xing Wu, Jianwei Yang. Bearing fault diagnosis based on wavelet sparse convolutional network and acoustic emission compression signals[J]. Mathematical Biosciences and Engineering, 2022, 19(8): 8057-8080. doi: 10.3934/mbe.2022377


 DownLoad: