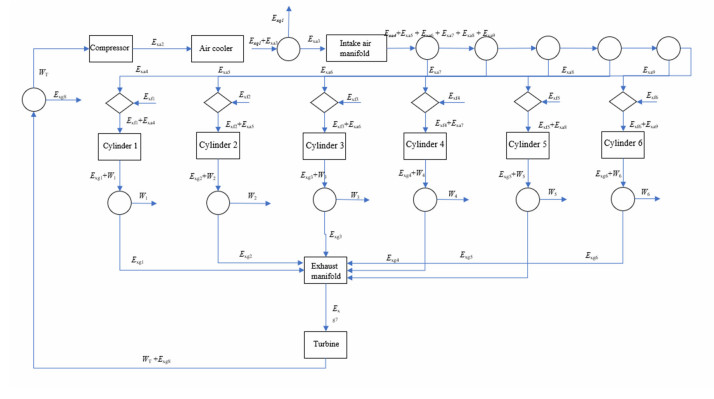
To satisfy the requirements of low fuel consumption, low emission, and high efficiency of the shipping industry, marine diesel engines are developing in the direction of automation and energy-saving, which increases the possibility and complexity of marine diesel engine failures. A one-dimension thermodynamic model for the marine diesel engine is built with AVL Boost software. The model is applied to a low-speed two-stroke 6S50MC diesel engine, and the error between the main performance parameters obtained by simulation and the test bench data is less than 3% under 100% and 75% load. Based on the model, 6 typical single faults and many typical double faults concomitant phenomena of diesel are reproduced. Based on the second law of thermodynamics, the exergy flow among the components and the external environment is analyzed. The thermoeconomic model of a marine diesel engine is established where the "fuel" and "product" of the components are defined according to their function. The fault diagnosis results show that the effects of faults generally propagate through the diesel engine system and affect the behavior of several components, resulting in induced malfunction in normal components. Therefore the malfunction MFi of each component is the superposition of the intrinsic malfunction and the induced malfunction according to the malfunction and dysfunction analysis. The thermoeconomic fault diagnosis method can be used to narrow the search range of abnormal components though it cannot accurately locate the fault.
Citation: Nan Xu, Guolei Zhang, Longbin Yang, Zhenyu Shen, Min Xu, Lei Chang. Research on thermoeconomic fault diagnosis for marine low speed two stroke diesel engine[J]. Mathematical Biosciences and Engineering, 2022, 19(6): 5393-5408. doi: 10.3934/mbe.2022253
To satisfy the requirements of low fuel consumption, low emission, and high efficiency of the shipping industry, marine diesel engines are developing in the direction of automation and energy-saving, which increases the possibility and complexity of marine diesel engine failures. A one-dimension thermodynamic model for the marine diesel engine is built with AVL Boost software. The model is applied to a low-speed two-stroke 6S50MC diesel engine, and the error between the main performance parameters obtained by simulation and the test bench data is less than 3% under 100% and 75% load. Based on the model, 6 typical single faults and many typical double faults concomitant phenomena of diesel are reproduced. Based on the second law of thermodynamics, the exergy flow among the components and the external environment is analyzed. The thermoeconomic model of a marine diesel engine is established where the "fuel" and "product" of the components are defined according to their function. The fault diagnosis results show that the effects of faults generally propagate through the diesel engine system and affect the behavior of several components, resulting in induced malfunction in normal components. Therefore the malfunction MFi of each component is the superposition of the intrinsic malfunction and the induced malfunction according to the malfunction and dysfunction analysis. The thermoeconomic fault diagnosis method can be used to narrow the search range of abnormal components though it cannot accurately locate the fault.

| [1] | J. Carlton, J. Aldwinkle, J. Anderson, Future Ship Powering Options: Exploring Alternative Methods of Ship Propulsion, Royal Academy of Engineering, London, 2013, . |
| [2] | B. Haight, Marine propulsion order survey, in Diesel and Gas Turbine Worldwide, 2013. |
| [3] |
A. K. S. Jardine, D. Lin, D. Banjevic, A review on machinery diagnostics and prognostics implementing condition-based maintenance, Mech. Syst. Signal Process., 20 (2006), 1483–1510. https://doi.org/10.1016/j.ymssp.2005.09.012 doi: 10.1016/j.ymssp.2005.09.012

|
| [4] |
D. T. Hountalas, A. D. Kouremenos, Development and application of a fully automatic troubleshooting method for large marine diesel engines, Appl. Therm. Eng., 19 (1999), 299–324. https://doi.org/10.1016/S1359-4311(98)00048-9 doi: 10.1016/S1359-4311(98)00048-9
|
| [5] |
V. T. Lamaris, D. T. Hountalas, A general purpose diagnostic technique for marine diesel engines–Application on the main propulsion and auxiliary diesel units of a marine vessel, Energy Convers. Manage., 51 (2010), 740–753. https://doi.org/10.1016/j.enconman.2009.10.031 doi: 10.1016/j.enconman.2009.10.031
|
| [6] | V. Verda, L. Serra, A. Valero, Effects of the productive structure on the results of the thermoeconomic diagnosis of energy systems, Int. J. Thermodyn., 5 (2002), 127–137. |
| [7] |
A. Valero, F. Lerch, L. Serra, J. Royo, Structural theory and thermoeconomic diagnosis: Part Ⅱ: application to an actual power plant, Energy Convers. Manag., 43 (2002), 1519–1535. https://doi.org/10.1016/S0196-8904(02)00033-X doi: 10.1016/S0196-8904(02)00033-X
|
| [8] | V. Verda, Thermoeconomic analysis and diagnosis of energy utility systems-from diagnosis to prognosis, Int. J. Thermodyn., 7 (2004), 73–83. |
| [9] | A. Stoppato, A. Lazzaretto, Exergetic analysis for energy system diagnosis, in 1996 3 rd Biennial Joint Conference on Engineering Systems Design and Analysis, ESDA, (1996), 191–198. |
| [10] |
C. Torres, A. Valero, L. Serra, J. Royo, Structural theory and thermoeconomic diagnosis: Part I. on malfunction and dysfunction analysis, Energy Convers. Manag., 43 (2002), 1503–1518. https://doi.org/10.1016/S0196-8904(02)00032-8 doi: 10.1016/S0196-8904(02)00032-8
|
| [11] |
V. Verda, L. Serra, A. Valero, Thermoeconomic diagnosis: zooming strategy applied to highly complex energy systems: Part 1: detection and localization of anomalies, J. Energy Resour. Technol., 127 (2005), 42–49. https://doi.org/10.1115/1.1819315 doi: 10.1115/1.1819315
|
| [12] |
V. Verda, L. Serra, A. Valero, Thermoeconomic diagnosis: zooming strategy applied to highly complex energy systems: Part 2: on the choice of the productive structure, J. Energy Resour. Technol., 127 (2005), 50–58. https://doi.org/10.1115/1.1819314 doi: 10.1115/1.1819314
|
| [13] |
J. Zhu, H. Ren, Y. Luo, Simulation research on egr reducing NOX emission of diesel engine, Int. J. Energy Power Eng., 4 (2015), 275–279. https://doi.org/10.11648/j.ijepe.20150405.16 doi: 10.11648/j.ijepe.20150405.16
|
| [14] | C. Iclodean, N. Burnete, Computer simulation of CI engines fuelled with biofuels by modelling injection iRate law, Res. J. Agric. Sci., 44 (2012), 249–257. |
| [15] | T. Firsa, AVL boost simulation of engine performance and emission for compressed natural gas direct injection engine, J. Energy Environ., 6 (2014). |
| [16] |
J. A. P. Rubio, F. Vera-García, J. H. Grau, J. M. Cámara, D. A. Hernandez, Marine diesel engine failure simulator based on thermodynamic model, Appl. Therm. Eng., 144 (2018), 982–995. https://doi.org/10.1016/j.applthermaleng.2018.08.096 doi: 10.1016/j.applthermaleng.2018.08.096
|
| [17] |
N. X. Khoa, O. Lim, The effects of combustion duration on residual gas, effective release energy, engine power and engine emissions characteristics of the motorcycle engine, Appl. Energy, 248 (2019), 54–63. https://doi.org/10.1016/j.apenergy.2019.04.075 doi: 10.1016/j.apenergy.2019.04.075
|
| [18] |
J. Castresana, G. Gabiña, L. Martin, Z. Uriondo, Comparative performance and emissions assessments of a single-cylinder diesel engine using artificial neural network and thermodynamic simulation, Appl. Therm. Eng., 185 (2021), 116343. https://doi.org/10.1016/j.applthermaleng.2020.116343 doi: 10.1016/j.applthermaleng.2020.116343
|
| [19] |
D. T. Hountalas, Prediction of marine diesel engine performance under fault conditions, Appl. Therm. Eng., 20 (2000), 1753–1783. https://doi.org/10.1016/S1359-4311(00)00006-5 doi: 10.1016/S1359-4311(00)00006-5
|
| [20] |
H. M. Nahim, R. Younes, H. Shraim, M. Ouladsine, Oriented review to potential simulator for faults modeling in diesel engine, J. Marine Sci. Tech., 21 (2016), 533–551. https://doi.org/10.1007/s00773-015-0358-6 doi: 10.1007/s00773-015-0358-6
|
| [21] |
N. Matulić, G. Radica, S. Nižetić, Engine model for onboard marine engine failure simulation, J. Therm. Anal. Calorim., 141 (2020), 119–130. https://doi.org/10.1007/s10973-019-09118-3 doi: 10.1007/s10973-019-09118-3
|
| [22] |
M. Cheliotis, I. Lazakis, G. Theotokatos, Machine learning and data-driven fault detection for ship systems operations, Ocean Eng., 216 (2020), 107968. https://doi.org/10.1016/j.oceaneng.2020.107968 doi: 10.1016/j.oceaneng.2020.107968
|
| [23] |
C. Dere, C. Deniz, Effect analysis on energy efficiency enhancement of controlled cylinder liner temperatures in marine diesel engines with model based approach, Energ. Conversion Manag., 220 (2020), 113015. https://doi.org/10.1016/j.enconman.2020.113015 doi: 10.1016/j.enconman.2020.113015
|
| [24] | A. Valero, M. A. Lozano, C. Torres, Theory of perturbations, in On Causality in Organized Eenergy Systems, Pergamon Press, (1990), 409–420. |
| [25] | M. Reini, Analisi e Sviluppo dei Metodi Termoeconomici per lo Studio Degli Impianti di Conversione Dell'Energia, PhD thesis, The University of Padova, 1994. |
| [26] |
Y. Yoo, H. S. Oh, C. Uysal, H. Y. Kwak, Thermoeconomic diagnosis of an air-cooled air conditioning system, Int. J. Exergy, 26 (2018), 393–417. https://doi.org/10.1504/IJEX.2018.093185 doi: 10.1504/IJEX.2018.093185
|
| [27] |
T. Mendesa, O. J. Venturinib, J. A. M. Silva, D. J. R. Orozco, M. J. Pirani, Disaggregation models for the thermoeconomic diagnosis of a vapor compression refrigeration system, Energy, 193 (2020), 116731. https://doi.org/10.1016/j.energy.2019.116731 doi: 10.1016/j.energy.2019.116731
|
| [28] | A. Lazzaretto, A. Macor, A. Mirandola, A. Stoppato, F. Donatini, Analysis and diagnosis of the operation performances of a steam power plant, in Brazilian Congress of Mechanical Engineering, (1997), 404. |
| [29] |
A. Stoppato, C. Carraretto, A. Mirandola, A diagnosis procedure for energy conversion plants. part 1–description of the method, Int. Mech. Eng. Congr. Expo., 2001,493–500. https://doi.org/10.1115/IMECE2001/AES-23658 doi: 10.1115/IMECE2001/AES-23658
|
| [30] | A. Lazzaretto, A. Macor, A. Mirandola, A. Stoppato, Potentialities and limits of exergoeconomic methods in the design, analysis and diagnosis of energy conversion plants, Proc. Adv. Energy Stud., (1998), 515–530. |
Figures(1) / Tables(13)

Nan Xu, Guolei Zhang, Longbin Yang, Zhenyu Shen, Min Xu, Lei Chang. Research on thermoeconomic fault diagnosis for marine low speed two stroke diesel engine[J]. Mathematical Biosciences and Engineering, 2022, 19(6): 5393-5408. doi: 10.3934/mbe.2022253


 DownLoad: