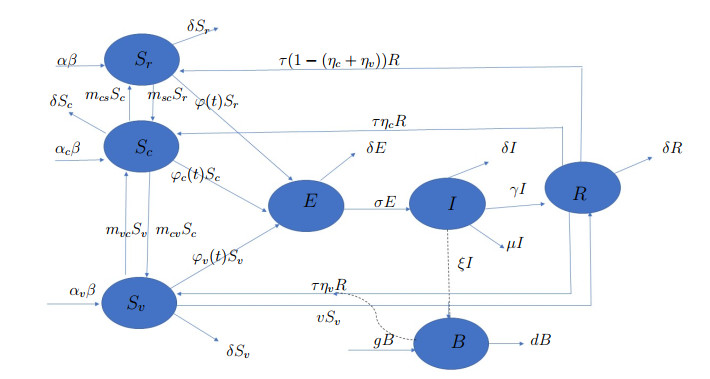
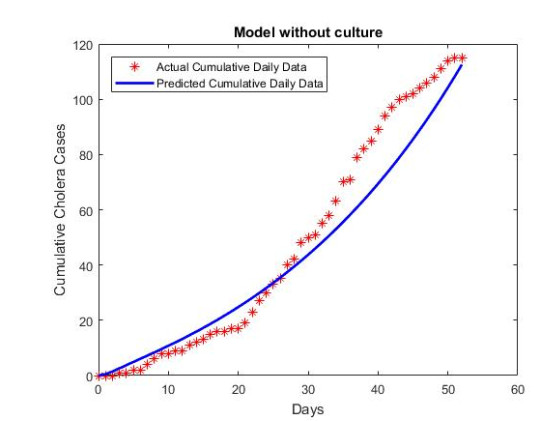
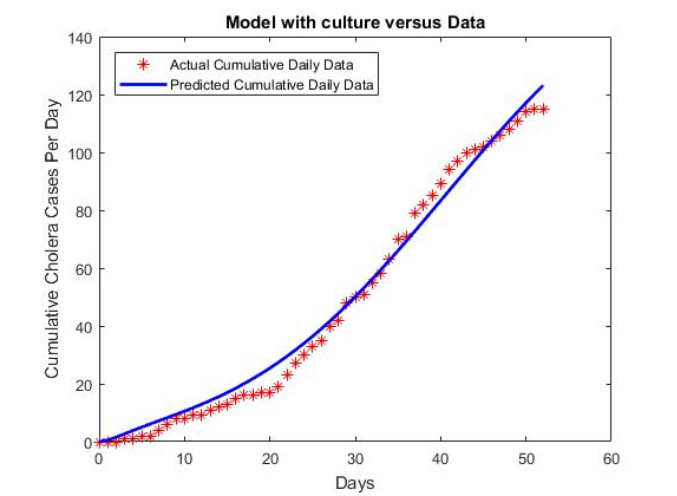
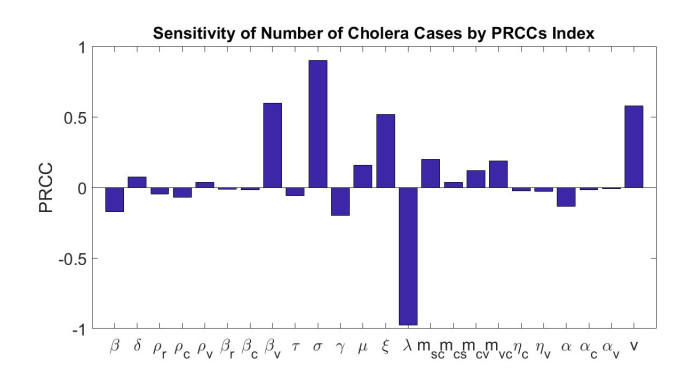
The Far North Region of Cameroon, a high risk cholera endemic region, has been experiencing serious and recurrent cholera outbreaks in recent years. Cholera outbreaks in this region are associated with cultural practices (traditional and religious beliefs). In this paper, we introduce a mathematical model of the influence of cultural practices on the dynamics of cholera in the Far North Region. Our model is an SEIR type model with a pathogen class and multiple susceptible classes based on traditional and religious beliefs. Using daily reported cholera cases from three health districts (Kaélé, Kar Hay and Moutourwa) in the Far North Region from June 25, 2019 to August 16, 2019, we estimate parameter values of our model and use Akaike information criterion (AIC) to demonstrate that our model gives a good fit for our data on cholera cases. We use sensitivity analysis to study the impact of each model parameter on the threshold parameter (control reproduction number), $ \mathcal{R}_c $, and the number of model predicted cholera cases. Finally, we investigate the effect of cultural practices on the number of cholera cases in the region.
Citation: Eric Che, Eric Numfor, Suzanne Lenhart, Abdul-Aziz Yakubu. Mathematical modeling of the influence of cultural practices on cholera infections in Cameroon[J]. Mathematical Biosciences and Engineering, 2021, 18(6): 8374-8391. doi: 10.3934/mbe.2021415
The Far North Region of Cameroon, a high risk cholera endemic region, has been experiencing serious and recurrent cholera outbreaks in recent years. Cholera outbreaks in this region are associated with cultural practices (traditional and religious beliefs). In this paper, we introduce a mathematical model of the influence of cultural practices on the dynamics of cholera in the Far North Region. Our model is an SEIR type model with a pathogen class and multiple susceptible classes based on traditional and religious beliefs. Using daily reported cholera cases from three health districts (Kaélé, Kar Hay and Moutourwa) in the Far North Region from June 25, 2019 to August 16, 2019, we estimate parameter values of our model and use Akaike information criterion (AIC) to demonstrate that our model gives a good fit for our data on cholera cases. We use sensitivity analysis to study the impact of each model parameter on the threshold parameter (control reproduction number), $ \mathcal{R}_c $, and the number of model predicted cholera cases. Finally, we investigate the effect of cultural practices on the number of cholera cases in the region.

| [1] | WHO, Cholera, available from: https://www.who.int/immunization/diseases/cholera/en/. |
| [2] | WHO, Weekly Epidemiological Record, No 36, (2017), 92,521–536, available from: http://www.who.int/wer. |
| [3] |
D. Posny, C. Modnak, J. Wang, A multigroup model for cholera dynamics and control, Int. J. Biomath., 9 (2016), 1650001. doi: 10.1142/S1793524516500017

|
| [4] |
M. Ali, A. R. Nelson, A. L. Lopez, D. A. Sack, Updated Global Burden of Cholera in Endemic Countries, PLoS Negl. Trop. Dis., 9 (2015), e0003832. doi: 10.1371/journal.pntd.0003832
|
| [5] | UNICEF, Cholera epidemiology and response factsheet Cameroon, available from https://www.unicef.org/cholera/files/UNICEF-Factsheet-Cameroon-EN-FINAL.pdf. |
| [6] | WHO, Cholera, available from: https://www.who.int/news-room/fact-sheets/detail/cholera. |
| [7] | A. Manguvo, B. Mafuvadze, The impact of traditional and religious practices on the spread of Ebola in West Africa: time for a strategic shift, Pan Afr. Med. J., 22 (2015), 9. |
| [8] | M. C. Ngwa, A. Young, S. Liang, J. Blackburn, A. Mouhaman, J. G. Morris, Cultural influences behind cholera transmission in the Far North Region, Republic of Cameroon: a field experience and implications for operational level planning of interventions, Pan Afr. Med. J., 08 (2017), 311. |
| [9] | M. K. Nfor, Recurrent Cholera Outbreak in Far North Cameroon Highlights Development Gaps, Reliefweb, 2014, available from: https://reliefweb.int/report/cameroon/recurrent-cholera-outbreak-far-north-cameroon-highlights-development-gaps |
| [10] | K. R. Fister, H. Gaff, S. Lenhart, E. Numfor, E. Schaefer, J. Wang, Optimal Control of Vaccination in an Age-structured Cholera Model, In: Chowell G., Hyman J. (eds), Mathematical Modeling of Emerging and Re-emerging Infectious Diseases, Springer, Cham, (2016), 221–248. |
| [11] |
M. R. Kelly, J. H. Tien, M. C. Eisenberg, S. Lenhart, The impact of spatial arrangements on the epidemic disease dynamics and intervention strategies, J. Biol. Dyn., 10 (2016), 222–249. doi: 10.1080/17513758.2016.1156172
|
| [12] | J. H. Tien, D. J. D. Earn, Multiple transmission pathways and disease dynamics in a waterborne pathogen model, Bull. Math. Biol., 72 (2010), 1502–1533. |
| [13] | P. van den Driessche. Reproduction numbers of infectious disease models, Infect. Dis. Model., 2 (2017), 288–303. |
| [14] | J. Wang, C. Modnak, Modeling Cholera Dynamics with Controls, Canadian Appl. Math. Q., 19 (2011), 255–273. |
| [15] |
E. Che, Y. Kang, A. Yakubu, Risk structured model of cholera infections in Cameroon, Math. Biosci., 320 (2020), 108303. doi: 10.1016/j.mbs.2019.108303
|
| [16] |
M. Al-arydah, A. Mwasa, J. M. Tchuenche, R. J. Smith, Modeling Cholera Disease with Education and Chlorination, J. Biol. Syst., 21 (2013), 1340007. doi: 10.1142/S021833901340007X
|
| [17] | Ministry of Public Health Cameroon, Rapport de situation N$^{o}$10 Épidémie de choléra dans la région de l'Extrême-Nord, 17 août 2019. Available from https://reliefweb.int/report/cameroon/rapport-de-situation-n-10-pid-mie-de-chol-ra-dans-la-r-gion-de-l-extr-me-nord-17-ao. |
| [18] |
C. T. Codeço, Endemic and epidemic dynamics of cholera: the role of the aquatic reservoir, BMC Infect. Dis., 1 (2001), no. 1. doi: 10.1186/1471-2334-1-1
|
| [19] |
N. Siewe, A. A. Yakubu, A. R. Satoskar, A. Friedman. Immune response to infection by leishmania: A mathematical model, Math. Biosci., 276 (2016), 28–43. doi: 10.1016/j.mbs.2016.02.015
|
| [20] | O. Diekmann, J. P. Heesterbeek, Mathematical epidemiology of infectious diseases, Wiley, (2000). |
| [21] | O. Diekmann, H. Heesterbeek, T. Britton, Mathematical tools for understanding infectious disease dynamics, Princeton University Press, (2012). |
| [22] |
P. van den Driessche, J. Watmough, Reproduction numbers and sub-threshold endemic equilibria for compartmental models of disease transmission, Math. Biosci., 180 (2002), 29–48. doi: 10.1016/S0025-5564(02)00108-6
|
| [23] |
A. S. Azman, K. E. Rudolph, D. A. T. Cummings, J. Lessler, The incubation period of cholera: A systematic review, J. Infect., 66 (2013), 432–438. doi: 10.1016/j.jinf.2012.11.013
|
| [24] |
M. Bani-Yaghoub, R. Gautam, Z. Shuai, P. van den Driessche, R. Ivanek, Reproduction numbers for infections with free-living pathogens growing in the environment, J. Biol. Dyn., 6 (2012), 923–940. doi: 10.1080/17513758.2012.693206
|
| [25] |
D. M. Hartley, J. G. Morris Jr., D. L. Smith, Hyperinfectivity: A critical element in the ability of V. cholerae to cause epidemics?, PLoS Med., 3 (2005), e7. doi: 10.1371/journal.pmed.0030007
|
| [26] | Knoema, World Data Atlas, Cameroon. Available from: https://knoema.com/atlas/Cameroon. |
| [27] |
K. L. Webster, I. F. Creed, M. D. Skowronski, Y. H. Kaheil, Comparison of the Performance of Statistical Models that Predict Soil Respiration from Forests, Soil Sci. Soc. Am. J., 73 (2009), 1157–1167. doi: 10.2136/sssaj2008.0310
|
| [28] |
N. Chitnis, J. M. Hyman, J. M. Cushing, Determining Important Parameters in the Spread of Malaria Through the Sensitivity Analysis of a Mathematical Model, Bull. Math. Biol., 70 (2008), 1272–1296. doi: 10.1007/s11538-008-9299-0
|
| [29] |
S. M. Blower, H. Dowlatabadi, Sensitivity and uncertainty analysis of complex models of disease transmission: an HIV model, as an example, Int. Stat. Rev., 62 (1994), 229–243. doi: 10.2307/1403510
|
| [30] | C. Edholm, B. Levy, A. Abebe, T. Marijani, S. Le Fevre, S. Lenhart, et al., A Risk-Structured Mathematical Model of Buruli Ulcer Disease in Ghana. In Kaper H., Roberts F. (eds) Math. Planet Earth, Springer, Cham, 5 (2019), 109–128. |
| [31] |
S. Marino, I. B. Hogue, C. J. Ray, D. E. Kirschner, A methodology for performing global uncertainty and sensitivity analysis in systems biology, J. Theor. Biol., 254 (2008), 178–196. doi: 10.1016/j.jtbi.2008.04.011
|
| [32] | M. D. McKay, R. J. Beckman, W. J. Conover, A comparison of three methods for selecting values of input variables in the analysis of output from a computer code, Technometrics, 21 (1979), 239–245. |
| [33] |
L. Allen, P. van den Driessche, The basic reproduction number in discrete-time epidemic models, J. Differ. Equ. Appl., 14 (2008), 1127–1147. doi: 10.1080/10236190802332308
|
Figures(5) / Tables(6)

Eric Che, Eric Numfor, Suzanne Lenhart, Abdul-Aziz Yakubu. Mathematical modeling of the influence of cultural practices on cholera infections in Cameroon[J]. Mathematical Biosciences and Engineering, 2021, 18(6): 8374-8391. doi: 10.3934/mbe.2021415


 DownLoad: