Citation: Mohamed A Elblbesy, Mohamed Attia. Optimization of fractal dimension and shape analysis as discriminators of erythrocyte abnormalities. A new approach to a reproducible diagnostic tool[J]. Mathematical Biosciences and Engineering, 2020, 17(5): 4706-4717. doi: 10.3934/mbe.2020258

| [1] | B. Constantino, Reporting and grading of abnormal red blood cell morphology, Int. J. Lab. Hematol., 37 (2015), 1-7. |
| [2] | J. Ford, Red blood cell morphology, Int. J. Lab. Hematol., 35 (2013), 351-357. |
| [3] | M. Buttarello, M. Plebani, Automated blood cell counts: state of the art, Am. J. Clin. Pathol., 130 (2008), 104-116. |
| [4] | L. Da Costa, Digital image analysis of blood cells, Clin. Lab. Med., 35 (2015), 105-122. |
| [5] | L. Pantanowitz, Digital images and the future of digital pathology, J. Pathol. Inform., 1 (2010), 15. |
| [6] | I. Mansoor, C. Zalles, F. Zahid, K. Gossage, R. M. Levenson, D. L. Rimm, Fine-needle aspiration of follicular adenoma versus parathyroid adenoma, Cancer Cytopathol., 114 (2008), 22-26. |
| [7] | H. Peng, Z. Ruan, F. Long, J. H. Simpson, E. W. Myers, V3D enables real-time 3D visualization and quantitative analysis of large-scale biological image data sets, Nat. Biotechnol., 28 (2010), 348-353. |
| [8] | A. H. K. Roeder, A. Cunha, M. C. Burl, E. M. Meyerowitz, A computational image analysis glossary for biologists, Development, 139 (2012), 3071-3080. |
| [9] | N. A. Davies, N. K. Harrison, R. H. Morris, S. Noble, M. J. Lawrence, L. A. D'Silva, et al., Fractal dimension (df) as a new structural biomarker of clot microstructure in different stages of lung cancer, Thromb. Haemost., 114 (2015), 1251-1259. |
| [10] | A. R. Backes, L. C. Gerhardinger, E. Batista Neto Jdo, O. M. Bruno, Medical image retrieval and analysis by Markov random fields and multi-scale fractal dimension, Phys. Med. Biol., 60 (2015), 1125-1139. |
| [11] | Z. Ali, I. Elamvazuthi, M. Alsulaiman, G. Muhammad, Detection of voice pathology using fractal dimension in a multiresolution Analysis of Normal and Disordered Speech Signals, J. Med. Syst., 40 (2016), 20. |
| [12] | G. Mohan and M. M. Subashini, MRI based medical image analysis: Survey on brain tumor grade classification, Biomed. Signal Process, 39 (2018), 139-161. |
| [13] | A. Bitler, R. S. Dover, Y. Shai, Fractal properties of cell surface structures: A view from AFM; 2018. Elsevier. pp. 64-70. |
| [14] | G. Landini, Fractals in microscopy, J. Microsc., 241 (2011), 1-8. |
| [15] | B. Yao, F. Imani, A. S. Sakpal, E. Reutzel, H. Yang, Multifractal analysis of image profiles for the characterization and detection of defects in additive manufacturing, J. Manuf. Sci. Eng., 140 (2018), 031014. |
| [16] | T. F. Nonnenmacher, G. Baumann, A. Barth, G. A. Losa, Digital image analysis of self-similar cell profiles, Int. J. Biomed. Comput., 37 (1994), 131-138. |
| [17] | K. Harrar, R. Jennane, K. Zaouchi, T. Janvier, H. Toumi, E. Lespessailles, Oriented fractal analysis for improved bone microarchitecture characterization, Biomed. Signal Process, 39 (2018), 474-485. |
| [18] | B. a. K. T. Venkatalakshmi, Automatic red blood cell counting using Hough transform, 2013 IEEE Conference on Information & Communication Technologies (ICT) (2013). |
| [19] | M. Habibzadeh, A. Krzyżak, T. Fevens, Comparative study of shape, intensity and texture features and support vector machine for white blood cell classification, J. Theor. Appl. Comput. Sci., 7 (2013), 20-35. |
| [20] | E. A. Mohammed, M. M. Mohamed, B. H. Far, C. Naugler, Peripheral blood smear image analysis: A comprehensive review, J. Pathol. Inform., 5 (2014), 9. |
| [21] | G. De Vico, V. Peretti,G. A. Losa, Fractal organization of feline oocyte cytoplasm, Eur. J. Histochem., 49 (2005), 151-156. |
| [22] | B. B. Mandelbrot The fractal geometry of nature. New York: W.H. Freeman. 1983, pp. 468. |
| [23] | E. R. Weibel, Fractal geometry: A design principle for living organisms, Am. J. Physiol., 261 (1991), L361-369. |
| [24] | J. W. Fuseler, J. P. Robichaux, H. I. Atiyah, A. F. Ramsdell, Morphometric and fractal dimension analysis identifies early neoplastic changes in mammary epithelium of MMTV-cNeu mice, Anticancer Res., 34 (2014), 1171-1177. |
| [25] | W. Sumelka, Fractional calculus for continuum mechanics-anisotropic non-locality, Bull. Pol. Ac. Tech., 64 (2016), 361-372. |
| [26] | X. Zhang, Y. Xu, R. L. Jackson, An analysis of generated fractal and measured rough surfaces in regards to their multi-scale structure and fractal dimension, Tribol. Int., 105 (2017), 94-101. |
| [27] | A. Annadhason, Methods of fractal dimension computation, IRACST, 2 (2012).166-169. |
| [28] | R. D. Peng, H. P. Xie, Y. Ju, Computation method of fractal dimension for 2-D digital image, J. China Univ. Min. Technol., 33 (2004), 19-24. |
| [29] | C. T. Rueden, J. Schindelin, M. C. Hiner, B. E. DeZonia, A. E. Walter, E. T. Arena, et al., ImageJ2: ImageJ for the next generation of scientific image data, BMC Bioinform., 18 (2017), 529. |
| [30] | S. R. Nayak, J. Mishra, P. mohan Jena, Fractal analysis of image sets using differential box counting techniques, Int. J. Inform. Technol., 10 (2018), 39-47. |
| [31] | L. S. Liebovitch, T. Toth, A fast algorithm to determine fractal dimensions by box counting, Phys. Letters, 141 (1989), 386-390. |
| [32] | T. Markiewicz, M. Dziekiewicz, S. Osowski, M. Maruszynski, W. Kozlowski, R. Boguslawska-Walecka, Thresholding techniques for segmentation of atherosclerotic plaque and lumen areas in vascular arteries, Bull. Pol. Ac. Tech., 63 (2015), 269-280. |
| [33] | T. Y. Goh, S. N. Basah, H. Yazid, M. J. A. Safar, F. S. A. Saad, Performance analysis of image thresholding: Otsu technique, Measurement, 114 (2018), 298-307. |
| [34] | N. Otsu, A threshold selection method from gray-level histograms, IEEE Transact. Syst. Man Cybernet., 9 (1979), 62-66. |
| [35] | M. J. Anderson, A new method for non‐parametric multivariate analysis of variance, Austral Ecol., 26 (2001), 32-46. |
| [36] | M. C. Albertini, L. Teodori, E. Piatti, M. P. Piacentini, A. Accorsi, M. B. Rocchi, Automated analysis of morphometric parameters for accurate definition of erythrocyte cell shape, Cytometry A., 52 (2003), 12-18. |
| [37] | Z. Liang, P. Shi, An efficient and effective method to solve kernel Fisher discriminant analysis, Neurocomputing, 61 (2004), 485-493. |
| [38] | R. Singh, N. Rajpal, R. Mehta, Dynamic ECG Classification Using Shift-Invariant DTCWT and Discriminant Analysis. Proceedings of ICETIT 2019: Springer. (2020), pp. 490-500. |
| [39] | V. V. Revin, A. A. Ushakova, N. V. Gromova, L. A. Balykova, E. S. Revina, V. V. Stolyarova, et al., Study of Erythrocyte Indices, Erythrocyte Morphometric Indicators, and Oxygen-Binding Properties of Hemoglobin Hematoporphyrin Patients with Cardiovascular Diseases, Adv. Hematol., 2017 (2017). |
| [40] | M. Stankovic, I. Pantic, D. E. L. SR, N. Puskas, I. Zaletel, S. Milutinovic-Smiljanic, et al., Quantification of structural changes in acute inflammation by fractal dimension, angular second moment and correlation, J. Microsc., 261 (2016), 277-284. |
| [41] | F. M. Smits, C. Porcaro, C. Cottone, A. Cancelli, P. M. Rossini, F. Tecchio, Electroencephalographic fractal dimension in healthy ageing and Alzheimer's disease, PLoS One, 11 (2016), e0149587. |
| [42] | J. Pribic, J. Vasiljevic, K. Kanjer, Z. N. Konstantinovic, N. T. Milosevic, D. N. Vukosavljevic, et al., Fractal dimension and lacunarity of tumor microscopic images as prognostic indicators of clinical outcome in early breast cancer, Biomark. Med., 9 (2015), 1279-1277. |
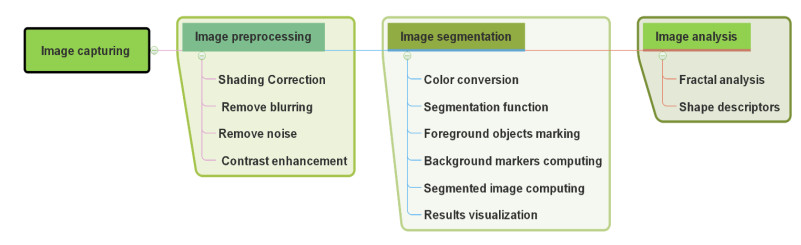
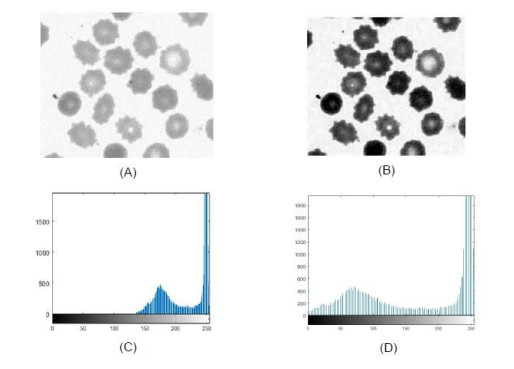
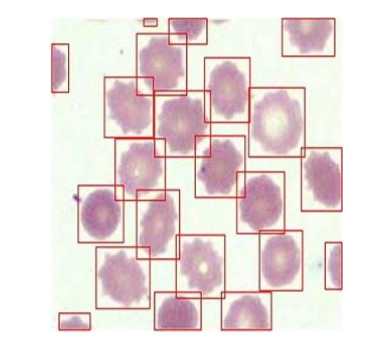
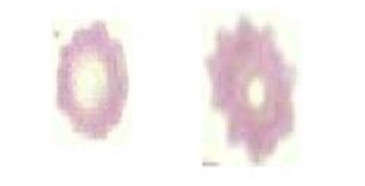
Figures(7) / Tables(4)

Mohamed A Elblbesy, Mohamed Attia. Optimization of fractal dimension and shape analysis as discriminators of erythrocyte abnormalities. A new approach to a reproducible diagnostic tool[J]. Mathematical Biosciences and Engineering, 2020, 17(5): 4706-4717. doi: 10.3934/mbe.2020258


 DownLoad: