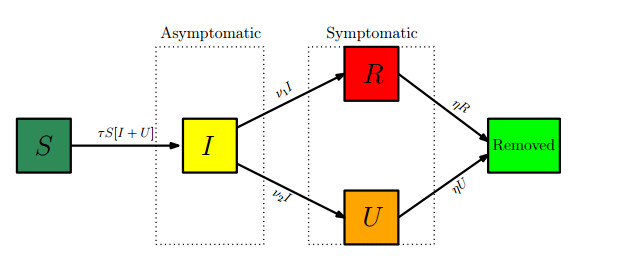
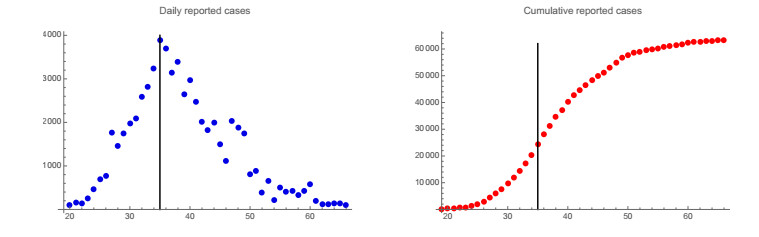
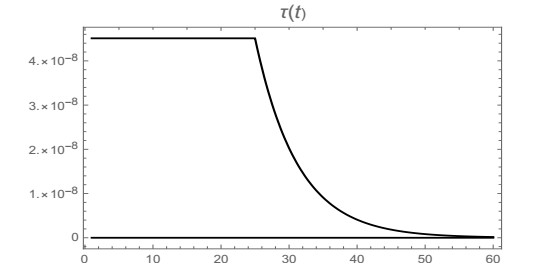
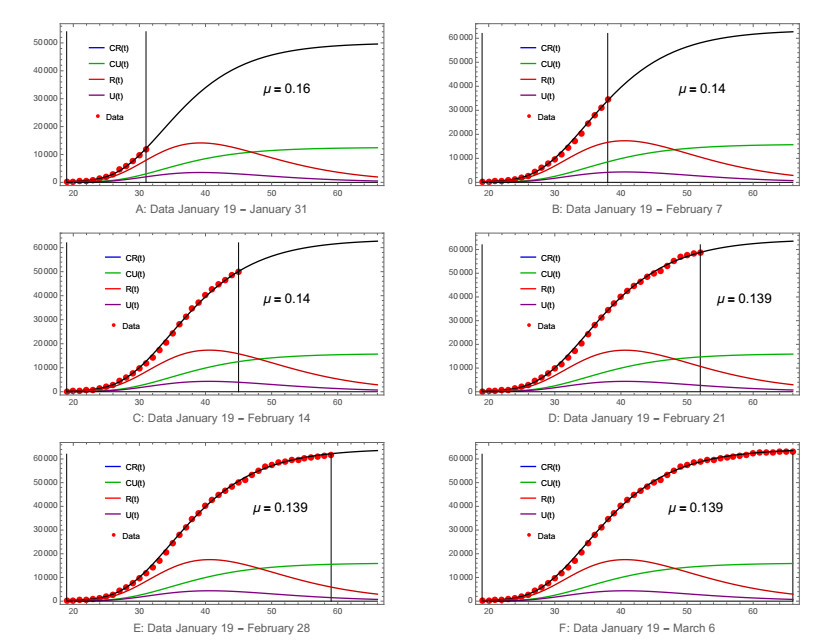
We model the COVID-19 coronavirus epidemic in China. We use early reported case data to predict the cumulative number of reported cases to a final size. The key features of our model are the timing of implementation of major public policies restricting social movement, the identification and isolation of unreported cases, and the impact of asymptomatic infectious cases.
Citation: Zhihua Liu, Pierre Magal, Ousmane Seydi, Glenn Webb. Predicting the cumulative number of cases for the COVID-19 epidemic in China from early data[J]. Mathematical Biosciences and Engineering, 2020, 17(4): 3040-3051. doi: 10.3934/mbe.2020172
We model the COVID-19 coronavirus epidemic in China. We use early reported case data to predict the cumulative number of reported cases to a final size. The key features of our model are the timing of implementation of major public policies restricting social movement, the identification and isolation of unreported cases, and the impact of asymptomatic infectious cases.

| [1] |
D. S. Hui, E. I. Azhar, T. A. Madani, F. Ntoumi, R. Kock, O. Dar, et al., The continuing 2019-nCoV epidemic threat of novel corona viruses to global health - The latest 2019 novel corona virus outbreak in Wuhan, China, Int. J. Infect. Dis., 91 (2020), 264-266. doi: 10.1016/j.ijid.2020.01.009

|
| [2] | H. Nishiura, N. M. Linton, A. R. Akhmetzhanov, Initial cluster of novel coronavirus (2019-nCoV) infections in Wuhan, China Is consistent with substantial human-to-human transmission, J. Clin. Med., 9 (2020), 488. |
| [3] | K. Roosa, Y. Lee, R. Luo, A. Kirpich, R. Rothenberg, J. M. Hyman, et al., Real-time forecasts of the COVID-19 epidemic in China from February 5th to February 24th, Infect. Dis. Model., 5 (2020), 256-263. |
| [4] | Y. Shao, J. Wu, IDM editorial statement on the 2019-nCoV, Infect. Dis. Model., 5 (2020), 233-234. |
| [5] | B. Tang, N. L. Bragazzi, Q. Li, S. Tang, Y. Xiao, J. Wu, An updated estimation of the risk of transmission of the novel coronavirus (2019-nCov), Infect. Dis. Model., 5 (2020), 248-255. |
| [6] |
B. Tang, X. Wang, Q. Li, N. L. Bragazzi, S. Tang, Y. Xiao, et al., Estimation of the transmission risk of the 2019-nCoV and its implication for public health interventions, J. Clin. Med., 9 (2020), 462. doi: 10.3390/jcm9020462
|
| [7] | R. N. Thompson, Novel coronavirus outbreak in Wuhan, China, 2020: Intense surveillance Is vital for preventing sustained transmission in new locations, J. Clin. Med., 9 (2020), 498. |
| [8] | J. T. Wu, K. Leung, G. M. Leung, Nowcasting and forecasting the potential domestic and international spread of the 2019-nCoV outbreak originating in Wuhan, China: a modelling study, The Lancet, 395 (2020), 689-697. |
| [9] |
S. Zhao, S. S. Musa, Q. Lin, J. Ran, G. Yang, W. Wang, et al., Estimating the unreported number of novel Coronavirus (2019-nCoV) cases in China in the first half of January 2020: A data-driven modelling analysis of the early outbreak, J. Clin. Med., 9 (2020), 388. doi: 10.3390/jcm9020388
|
| [10] | Z. Liu, P. Magal, O. Seydi, G. Webb, Understanding unreported cases in the 2019-nCov epidemic outbreak in Wuhan, China, and the importance of major public health interventions, Biology, 9 (2020), 50. |
| [11] | Centers for Disease control and prevention, Healthcare Professionals: Frequently Asked Questions and Answers, 2020. Available from: https://www.cdc.gov/coronavirus/2019-ncov/hcp/faq.html. |
| [12] | ARIA BENDIX, A Person Can Carry And Transmit COVID-19 Without Showing Symptoms, Scientists Confirm, BUSINESS INSIDER, 24 February, 2020. Available from: https://www.sciencealert.com/\researchers-confirmed-patients-can-transmit-the-coronavirus-without\-showing-symptoms. |
Figures(9) / Tables(2)

Zhihua Liu, Pierre Magal, Ousmane Seydi, Glenn Webb. Predicting the cumulative number of cases for the COVID-19 epidemic in China from early data[J]. Mathematical Biosciences and Engineering, 2020, 17(4): 3040-3051. doi: 10.3934/mbe.2020172


 DownLoad: