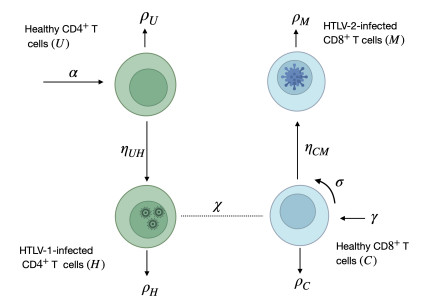
With the increasing prevalence of viral infections, the human T-cell leukemia virus (HTLV) is becoming a focal point of research. Of the four identified strains, HTLV-1 and HTLV-2 are particularly associated with various health issues. Both strains exhibit similar biological characteristics and transmission pathways, making them prevalent in specific high-risk populations, particularly among individuals who use injection drugs. HTLV-1 primarily targets the CD4$ ^{+} $ T cells, whereas HTLV-2 mainly affects the CD8$ ^{+} $ T cells. As far as we know, no mathematical model has been proposed to describe the within-host co-dynamics of HTLV-1 and HTLV-2. Therefore, this study presents a new mathematical framework to examine the within-host dynamics of HTLV-1 and HTLV-2 co-infection. Initially, the model's well-posedness is established by proving that the solutions remain both nonnegative and bounded over time. The equilibrium states and corresponding threshold conditions of the model are determined, and the criteria for the global asymptotic stability of each equilibrium are formulated. The global stability of the equilibria is analyzed using appropriate Lyapunov functions and LaSalle's invariance principle. These theoretical results are validated through numerical simulations. Additionally, sensitivity analysis of the basic reproduction numbers for HTLV-1 single infection ($ R_{1} $) and HTLV-2 single infection ($ R_{2} $) is performed to better understand the key parameters influencing co-infection dynamics. The study also explores the impact of CD8$ ^{+} $ T cell proliferation in the co-infection dynamics of HTLV-1 and HTLV-2, highlighting the importance of the CD8$ ^{+} $ T cell response in controlling the progression of HTLV-1. Furthermore, the impact of the viral infection rate on the co-infection dynamics of HTLV-1 and HTLV-2 is discussed. The results indicate that co-infection with HTLV-1 and HTLV-2 may increase the risk and severity of both viral infections.
Citation: E. A. Almohaimeed, A. M. Elaiw, A. D. Hobiny. Modeling HTLV-1 and HTLV-2 co-infection dynamics[J]. AIMS Mathematics, 2025, 10(3): 5696-5730. doi: 10.3934/math.2025263
With the increasing prevalence of viral infections, the human T-cell leukemia virus (HTLV) is becoming a focal point of research. Of the four identified strains, HTLV-1 and HTLV-2 are particularly associated with various health issues. Both strains exhibit similar biological characteristics and transmission pathways, making them prevalent in specific high-risk populations, particularly among individuals who use injection drugs. HTLV-1 primarily targets the CD4$ ^{+} $ T cells, whereas HTLV-2 mainly affects the CD8$ ^{+} $ T cells. As far as we know, no mathematical model has been proposed to describe the within-host co-dynamics of HTLV-1 and HTLV-2. Therefore, this study presents a new mathematical framework to examine the within-host dynamics of HTLV-1 and HTLV-2 co-infection. Initially, the model's well-posedness is established by proving that the solutions remain both nonnegative and bounded over time. The equilibrium states and corresponding threshold conditions of the model are determined, and the criteria for the global asymptotic stability of each equilibrium are formulated. The global stability of the equilibria is analyzed using appropriate Lyapunov functions and LaSalle's invariance principle. These theoretical results are validated through numerical simulations. Additionally, sensitivity analysis of the basic reproduction numbers for HTLV-1 single infection ($ R_{1} $) and HTLV-2 single infection ($ R_{2} $) is performed to better understand the key parameters influencing co-infection dynamics. The study also explores the impact of CD8$ ^{+} $ T cell proliferation in the co-infection dynamics of HTLV-1 and HTLV-2, highlighting the importance of the CD8$ ^{+} $ T cell response in controlling the progression of HTLV-1. Furthermore, the impact of the viral infection rate on the co-infection dynamics of HTLV-1 and HTLV-2 is discussed. The results indicate that co-infection with HTLV-1 and HTLV-2 may increase the risk and severity of both viral infections.

| [1] |
M. T. Raza, S. Mizan, F. Yasmin, A. S. Akash, S. M. Shahik, Epitope-based universal vaccine for human T-lymphotropic virus-1 (HTLV-1), PloS One, 16 (2021), e0248001. https://doi.org/10.1371/journal.pone.0248001 doi: 10.1371/journal.pone.0248001

|
| [2] |
K. S. Jones, K. Fugo, C. Petrow-Sadowski, Y. Huang, D. C. Bertolette, I. Lisinski, et al., Human T-cell leukemia virus type 1 (HTLV-1) and HTLV-2 use different receptor complexes to enter T cells, J. Virol., 80 (2006), 8291–8302. https://doi.org/10.1128/JVI.00389-06 doi: 10.1128/JVI.00389-06
|
| [3] |
F. Marino-Merlo, E. Balestrieri, C. Matteucci, A. Mastino, S. Grelli, B. Macchi, Antiretroviral therapy in HTLV-1 infection: an updated overview, Pathogens, 9 (2020), 342. https://doi.org/10.3390/pathogens9050342 doi: 10.3390/pathogens9050342
|
| [4] |
D. M. Solorzano-Salazar, A. Hernández-Vásquez, F. J. Visconti-Lopez, D. Azañedo, Research on HTLV-1 and HTLV-2 in latin America and the Caribbean over the last ten years, Heliyon, 9 (2023), e13800. https://doi.org/10.1016/j.heliyon.2023.e13800 doi: 10.1016/j.heliyon.2023.e13800
|
| [5] |
M. P. Martinez, J. Al-Saleem, P. L. Green, Comparative virology of HTLV-1 and HTLV-2, Retrovirology, 16 (2019), 21. https://doi.org/10.1186/s12977-019-0483-0 doi: 10.1186/s12977-019-0483-0
|
| [6] |
A. Gessain, O. Cassar, Epidemiological aspects and world distribution of HTLV-1 infection, Front. Microbiol., 3 (2012), 388. https://doi.org/10.3389/fmicb.2012.00388 doi: 10.3389/fmicb.2012.00388
|
| [7] |
E. L. Murphy, O. Cassar, A. Gessain, Estimating the number of HTLV-2 infected persons in the world, Retrovirology, 12 (2015), O5. https://doi.org/10.1186/1742-4690-12-S1-O5 doi: 10.1186/1742-4690-12-S1-O5
|
| [8] |
G. Schierhout, S. McGregor, A. Gessain, L. Einsiedel, M. Martinello, J. Kaldor, Association between HTLV-1 infection and adverse health outcomes: a systematic review and meta-analysis of epidemiological studies, Lancet Infect. Dis., 20 (2020), 133–143. https://doi.org/10.1016/S1473-3099(19)30402-5 doi: 10.1016/S1473-3099(19)30402-5
|
| [9] | M. A. Nowak, R. M. May, Virus dynamics, Oxford University Press, 2000. |
| [10] |
A. G. Lim, P. K. Maini, HTLV-Iinfection: a dynamic struggle between viral persistence and host immunity, J. Theor. Biol., 352 (2014), 92–108. https://doi.org/10.1016/j.jtbi.2014.02.022 doi: 10.1016/j.jtbi.2014.02.022
|
| [11] |
X. Pan, Y. Chen, H. Shu, Rich dynamics in a delayed HTLV-I infection model: Stability switch, multiple stable cycles, and torus, J. Math. Anal. Appl., 479 (2019), 2214–2235. https://doi.org/10.1016/j.jmaa.2019.07.051 doi: 10.1016/j.jmaa.2019.07.051
|
| [12] |
L. Wang, Z. Liu, Y. Li, D. Xu, Complete dynamical analysis for a nonlinear HTLV-I infection model with distributed delay, CTL response and immune impairment, Discrete Contin. Dyn. Syst., 25 (2020), 917–933. https://doi.org/10.3934/dcdsb.2019196 doi: 10.3934/dcdsb.2019196
|
| [13] |
S. Bera, S. Khajanchi, T. K. Roy, Dynamics of an HTLV-I infection model with delayed CTLs immune response, Appl. Math. Comput., 430 (2022), 127206. https://doi.org/10.1016/j.amc.2022.127206 doi: 10.1016/j.amc.2022.127206
|
| [14] |
Y. Wang, J. Liu, J. M. Heffernan, Viral dynamics of an HTLV-I infection model with intracellular delay and CTL immune response delay, J. Math. Anal. Appl., 459 (2018), 506–527. https://doi.org/10.1016/j.jmaa.2017.10.027 doi: 10.1016/j.jmaa.2017.10.027
|
| [15] |
F. Li, W. Ma, Dynamics analysis of an HTLV-1 infection model with mitotic division of actively infected cells and delayed CTL immune response, Math. Methods Appl. Sci., 41 (2018), 3000–3017. https://doi.org/10.1002/mma.4797 doi: 10.1002/mma.4797
|
| [16] |
S. Li, Y. Zhou, Backward bifurcation of an HTLV-I model with immune response, Discrete Contin. Dyn. Syst. B, 21 (2016), 863–881. https://doi.org/10.3934/dcdsb.2016.21.863 doi: 10.3934/dcdsb.2016.21.863
|
| [17] |
S. Khajanchi, S. Bera, T. K. Roy, Mathematical analysis of the global dynamics of a HTLV-I infection model, considering the role of cytotoxic T-lymphocytes, Math. Comput. Simul., 180 (2021), 354–378. https://doi.org/10.1016/j.matcom.2020.09.009 doi: 10.1016/j.matcom.2020.09.009
|
| [18] |
S. Chen, Z. Liu, L. Wang, X. Zhang, Global dynamics analysis for a nonlinear HTLV-I model with logistic proliferation and CTL response, Int. J. Biomath., 17 (2024), 2350023. https://doi.org/10.1142/S1793524523500237 doi: 10.1142/S1793524523500237
|
| [19] |
S. Chen, Z. Liu, L. Wang, X. Zhang, Stability and Hopf bifurcation analysis of a HTLV-I infection model with time-delay CTL immune response, Discrete Contin. Dyn. Syst. B, 29 (2024), 812–832. https://doi.org/10.3934/dcdsb.2023115 doi: 10.3934/dcdsb.2023115
|
| [20] |
S. Chen, Z. Liu, X. Zhang, L. Wang, Dynamics and optimal therapy of a stochastic HTLV-1 model incorporating Ornstein-Uhlenbeck process, Math. Methods Appl. Sci., 47 (2024), 9874–9896. https://doi.org/10.1002/mma.10099 doi: 10.1002/mma.10099
|
| [21] |
W. Wang, W. Ma, Global dynamics of a reaction and diffusion model for an HTLV-I infection with mitotic division of actively infected cells, J. Appl. Anal. Comput., 7 (2017), 899–930. https://doi.org/10.11948/2017057 doi: 10.11948/2017057
|
| [22] |
A. M. Elaiw, N. H. AlShamrani, Analysis of a within-host HIV/HTLV-I co-infection model with immunity, Virus Res., 295 (2021), 198204. https://doi.org/10.1016/j.virusres.2020.198204 doi: 10.1016/j.virusres.2020.198204
|
| [23] |
A. M. Elaiw, N. H. AlShamrani, A. D. Hobiny, Mathematical modeling of HIV/HTLV co-infection with CTL-mediated immunity, AIMS Math., 6 (2021), 1634–1676. https://doi.org/10.3934/math.2021098 doi: 10.3934/math.2021098
|
| [24] |
S. Chowdhury, J. K. Ghosh, U. Ghosh, Co-infection dynamics between HIV-HTLV-I disease with the effects of cytotoxic T-lymphocytes, saturated incidence rate and study of optimal control, Math. Comput. Simul., 223 (2024), 195–218. https://doi.org/10.1016/j.matcom.2024.04.015 doi: 10.1016/j.matcom.2024.04.015
|
| [25] |
R. Shi, Y. Zhang, Dynamic analysis and optimal control of a fractional order HIV/HTLV co-infection model with HIV-specific CTL immune response, AIMS Math., 9 (2024), 9455–9493. https://doi.org/10.3934/math.2024462 doi: 10.3934/math.2024462
|
| [26] |
H. Yang, X. Li, W. Zhang, A stochastic HIV/HTLV-I co-infection model incorporating the aids-related cancer cells, Discrete Contin. Dyn. Syst. B, 29 (2024), 702–730. https://doi.org/10.3934/dcdsb.2023110 doi: 10.3934/dcdsb.2023110
|
| [27] |
A. M. Elaiw, A. S. Shflot, A. D. Hobiny, Stability analysis of SARS-CoV-2/HTLV-I coinfection dynamics model, AIMS Math., 8 (2023), 6136–6166. https://doi.org/10.3934/math.2023310 doi: 10.3934/math.2023310
|
| [28] |
A. M. Elaiw, E. A. Almohaimeed, A. D. Hobiny, Modeling the co-infection of HTLV-2 and HIV-1 in vivo, Electron. Res. Arch., 32 (2024), 6032–6071. https://doi.org/10.3934/era.2024280 doi: 10.3934/era.2024280
|
| [29] |
A. S. Perelson, D. E. Kirschner, R. D. Boer, Dynamics of HIV infection of CD4$^{+}$ T cells, Math. Biosci., 114 (1993), 81–125. https://doi.org/10.1016/0025-5564(93)90043-a doi: 10.1016/0025-5564(93)90043-a
|
| [30] |
H. Mohri, S. Bonhoeffer, S. Monard, A. S. Perelson, D. D. Ho, Rapid turnover of T lymphocytes in SIV-infected rhesus macaques, Science, 279 (1998), 1223–1227. https://doi.org/10.1126/science.279.5354.1223 doi: 10.1126/science.279.5354.1223
|
| [31] |
D. S. Callaway, A. S. Perelson, HIV-1 infection and low steady state viral loads, Bull. Math. Biol., 64 (2002), 29–64. https://doi.org/10.1006/bulm.2001.0266 doi: 10.1006/bulm.2001.0266
|
| [32] |
H. Gómez-Acevedoa, M. Y. Li, S. Jacobson, Multistability in a model for CTL response to HTLV-I infection and its implications to HAM/TSP development and prevention, Bull. Math. Biol., 72 (2010), 681–696. https://doi.org/10.1007/s11538-009-9465-z doi: 10.1007/s11538-009-9465-z
|
| [33] |
P. Ngina, R. W. Mbogo, L. S. Luboobi, HIV drug resistance: insights from mathematical modelling, Appl. Math. Model., 75 (2019), 141–161. https://doi.org/10.1016/j.apm.2019.04.040 doi: 10.1016/j.apm.2019.04.040
|
| [34] |
B. E. Boukari, N. Yousfi, A delay differential equation model of HIV infection, with therapy and CTL response, Bull. Math. Sci. Appl., 9 (2014), 53–68. https://doi.org/10.18052/www.scipress.com/BMSA.9.53 doi: 10.18052/www.scipress.com/BMSA.9.53
|
| [35] |
X. Song, Y. Li, Global stability and periodic solution of a model for HTLV-I infection and ATL progression, Appl. Math. Comput., 180 (2006) 401–410. https://doi.org/10.1016/j.amc.2005.12.022 doi: 10.1016/j.amc.2005.12.022
|
| [36] |
X. Jia, R. Xu, Global dynamics of a delayed HTLV-I infection model with Beddington-DeAngelis incidence and immune impairment, Chaos Solitons Fract., 155 (2022), 111733. https://doi.org/10.1016/j.chaos.2021.111733 doi: 10.1016/j.chaos.2021.111733
|
| [37] |
Y. Muroya, Y. Enatsu, H. Li, Global stability of a delayed HTLV-I infection model with a class of nonlinear incidence rates and CTLs immune response, Appl. Math. Comput., 219 (2013), 10559–10573. https://doi.org/10.1016/j.amc.2013.03.081 doi: 10.1016/j.amc.2013.03.081
|
| [38] |
L. Cai, X. Li, M. Ghosh, Global dynamics of a mathematical model for HTLV-I infection of CD4$^{+}$ T-cells, Appl. Math. Model., 35 (2011), 3587–3595. https://doi.org/10.1016/j.apm.2011.01.033 doi: 10.1016/j.apm.2011.01.033
|
| [39] |
K. Qi, D. Jiang, Threshold behavior in a stochastic HTLV-I infection model with CTL immune response and regime switching, Math. Methods Appl. Sci., 41 (2018), 6866–6882. https://doi.org/10.1002/mma.5198 doi: 10.1002/mma.5198
|
| [40] | H. Gomez-Acevedo, M. Li, Global dynamics of a mathematical model for HTLV-I infection of T cells, Can. Appl. Math. Q., 10 (2002), 71–86. |
| [41] |
A. M. Elaiw, A. S. Shflot, A. D. Hobiny, Global stability of a general HTLV-I infection model with cytotoxic T-lymphocyte immune response and mitotic transmission, Alex. Eng. J., 67 (2023), 77–91. https://doi.org/10.1016/j.aej.2022.08.021 doi: 10.1016/j.aej.2022.08.021
|
| [42] | H. L. Smith, P. Waltman, The theory of the chemostat: dynamics of microbial competition, Cambridge University Press, 1995. https://doi.org/10.1017/cbo9780511530043.003 |
| [43] |
A. Korobeinikov, Global properties of basic virus dynamics models, Bull. Math. Biol., 66 (2004), 879–883. https://doi.org/10.1016/j.bulm.2004.02.001 doi: 10.1016/j.bulm.2004.02.001
|
| [44] | J. K. Hale, S. M. V. Lunel, Introduction to functional differential equations, Springer-Verlag, 1993. https://doi.org/10.1007/978-1-4612-4342-7 |
| [45] | H. K. Khalil, Nonlinear systems, 3 Eds., Prentice Hall, 2002. |
| [46] |
J. Danane, K. Allali, Z. Hammouch, Mathematical analysis of a fractional differential model of HBV infection with antibody immune response, Chaos Solitons Fract., 136 (2020), 109787. https://doi.org/10.1016/j.chaos.2020.109787 doi: 10.1016/j.chaos.2020.109787
|
| [47] |
M. Awadalla, J. Alahmadi, K. R. Cheneke, S. Qureshi, Fractional optimal control model and bifurcation analysis of human syncytial respiratory virus transmission dynamics, Fractal Fract., 8 (2024), 44. https://doi.org/10.3390/fractalfract8010044 doi: 10.3390/fractalfract8010044
|
| [48] |
Y. Guo, T. Li, Fractional-order modeling and optimal control of a new online game addiction model based on real data, Commun. Nonlinear Sci. Numer. Simul., 121 (2023), 107221. https://doi.org/10.1016/j.cnsns.2023.107221 doi: 10.1016/j.cnsns.2023.107221
|
| [49] |
Z. Yaagoub, M. Sadki, K. Allali, A generalized fractional hepatitis B virus infection modelwith both cell-to-cell and virus-to-cell transmissions, Nonlinear Dyn., 112 (2024), 16559–16585. https://doi.org/10.21203/rs.3.rs-3958680/v1 doi: 10.21203/rs.3.rs-3958680/v1
|
| [50] |
M. Renardy, C. Hult, S. Evans, J. J. Linderman, D. E. Kirschner, Global sensitivity analysis of biological multiscale models, Curr. Opin. Biomed. Eng., 11 (2019), 109–116. https://doi.org/10.1016/j.cobme.2019.09.012 doi: 10.1016/j.cobme.2019.09.012
|
| [51] |
Z. Zi, Sensitivity analysis approaches applied to systems biology models, IET Syst. Biol., 5 (2011), 336–346. https://doi.org/10.1049/iet-syb.2011.0015 doi: 10.1049/iet-syb.2011.0015
|
| [52] |
A. Bazarbachi, Y. Plumelle, J. C. Ramos, P. Tortevoye, Z. Otrock, G. Taylor, et al., Meta-analysis on the use of zidovudine and interferon-alfa in adult T-cell leukemia/lymphoma showing improved survival in the leukemic subtypes, J. Clin. Oncol., 28 (2010), 4177–4183. https://doi.org/10.1200/jco.2010.28.0669 doi: 10.1200/jco.2010.28.0669
|
| [53] |
A. O. Kamphorst, K. Araki, R. Ahmed, Beyond adjuvants: immunomodulation strategies to enhance T cell immunity, Vaccine, 33 (2015), B21–B28. https://doi.org/10.1016/j.vaccine.2014.12.082 doi: 10.1016/j.vaccine.2014.12.082
|
| [54] |
C. H. Koh, S. Lee, M. Kwak, B. S. Kim, Y. Chung, CD8 T-cell subsets: heterogeneity, functions, and therapeutic potential, Exp. Mol. Med., 55 (2023), 2287–2299. https://doi.org/10.1038/s12276-023-01105-x doi: 10.1038/s12276-023-01105-x
|
Figures(8) / Tables(5)

E. A. Almohaimeed, A. M. Elaiw, A. D. Hobiny. Modeling HTLV-1 and HTLV-2 co-infection dynamics[J]. AIMS Mathematics, 2025, 10(3): 5696-5730. doi: 10.3934/math.2025263


 DownLoad: