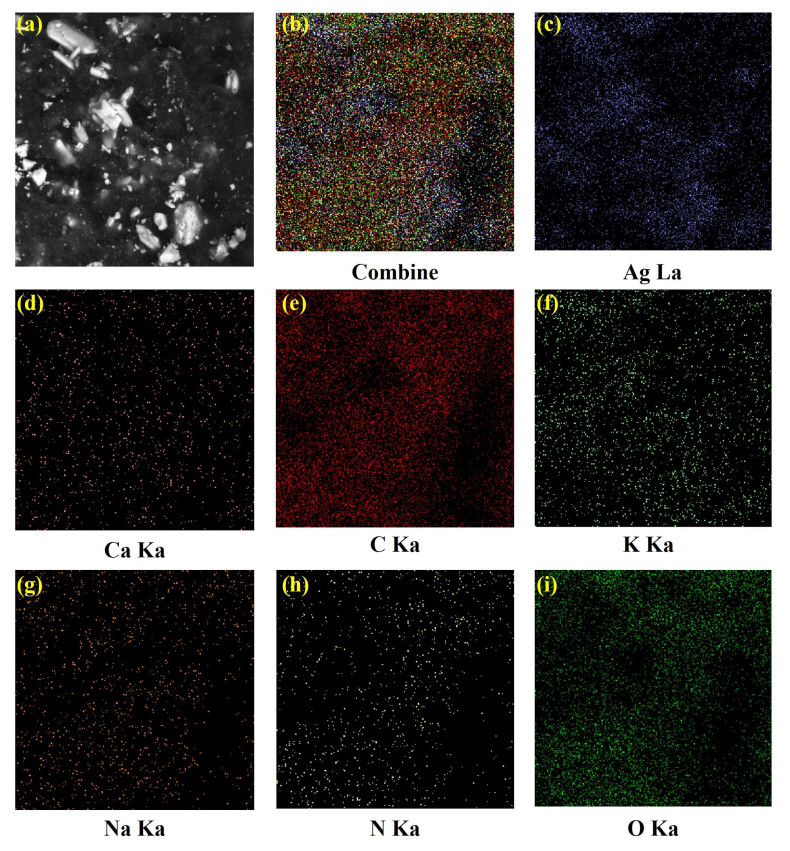
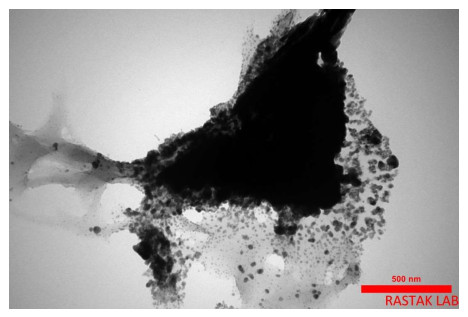
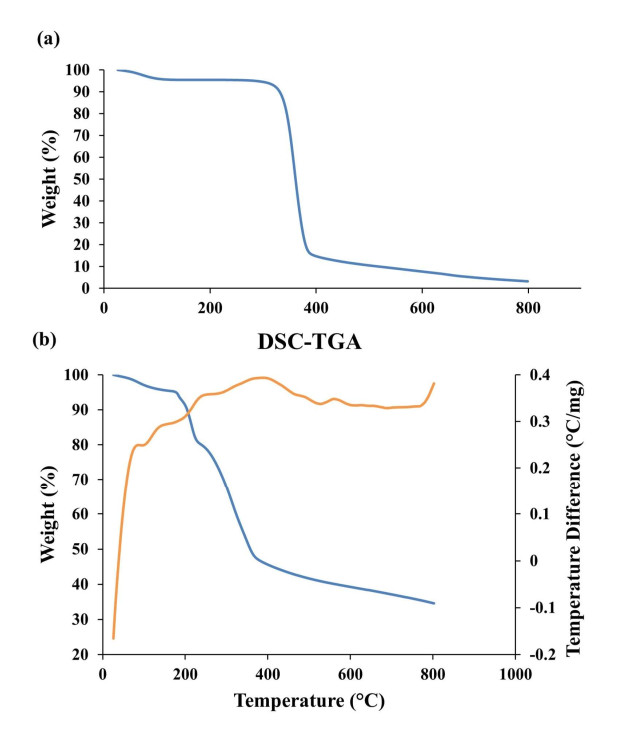
The increasing resistance of microorganisms to conventional antimicrobial compounds requires the development of innovative solutions, such as antimicrobial nanoparticles, to combat antibiotic-resistant infections. This study aimed to optimize the synthesis of a cellulose/gum Arabic/silver (cellulose/GA/Ag) bionanocomposite and evaluate its antibacterial properties against S. mutans, a key contributor to dental caries. Using the Taguchi method, we designed nine experiments with varying levels of cellulose (2, 4, and 6 mg/mL), gum Arabic (1, 2, and 3 mg/mL), and silver nanoparticles (2, 4, and 6 mg/mL). The nanocomposite synthesized under optimal conditions (2 mg/mL cellulose, 3 mg/mL gum Arabic, and 6 mg/mL silver nanoparticles) demonstrated the most potent antibacterial activity, reducing the bacterial survival rate of S. mutans to 0 Log10 CFU/mL, indicating complete inhibition. Variance analysis revealed that silver nanoparticles had the most significant impact on bacterial survival (53.22%), followed by gum Arabic (35.55%) and cellulose (8.86%). Characterization techniques confirmed the successful formation of the nanocomposite: FTIR analysis indicated hydrogen bonding between cellulose and silver nanoparticles, while XRD confirmed the crystalline structure of the nanocomposite. SEM and TEM images revealed a uniform distribution of silver nanoparticles within the cellulose–gum Arabic matrix. TGA-DSC analysis showed enhanced thermal stability, with a significant weight loss at 375 ℃, corresponding to the degradation of cellulose and gum Arabic. The results demonstrate that the cellulose/GA/Ag nanocomposite, synthesized under optimal conditions, exhibits exceptional antibacterial properties and stability, making it a promising candidate for antimicrobial applications in medical and dental fields.
Citation: Mohsen Safaei, Mohammad Salmani Mobarakeh, Bahram Azizi, Ehsan Shoohanizad, Ling Shing Wong, Nafiseh Nikkerdar. Optimization of synthesis of cellulose/gum Arabic/Ag bionanocomposite for antibacterial applications[J]. AIMS Materials Science, 2025, 12(2): 278-300. doi: 10.3934/matersci.2025015
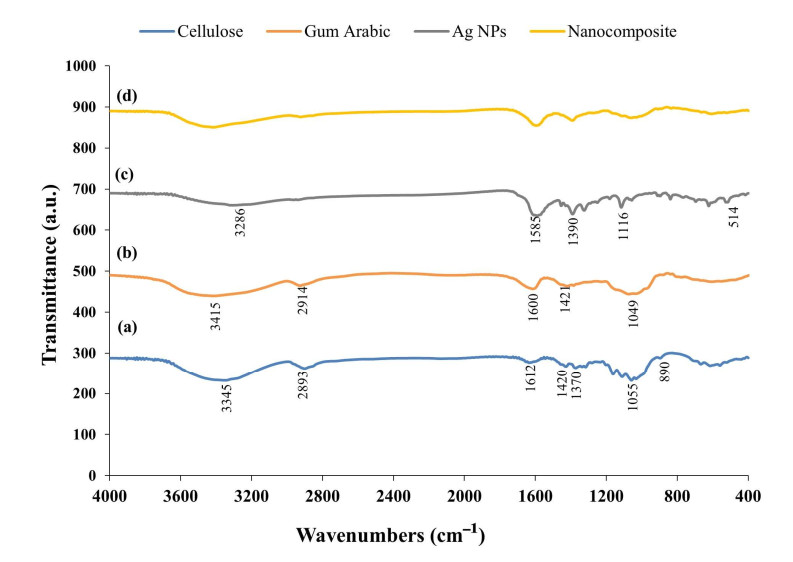
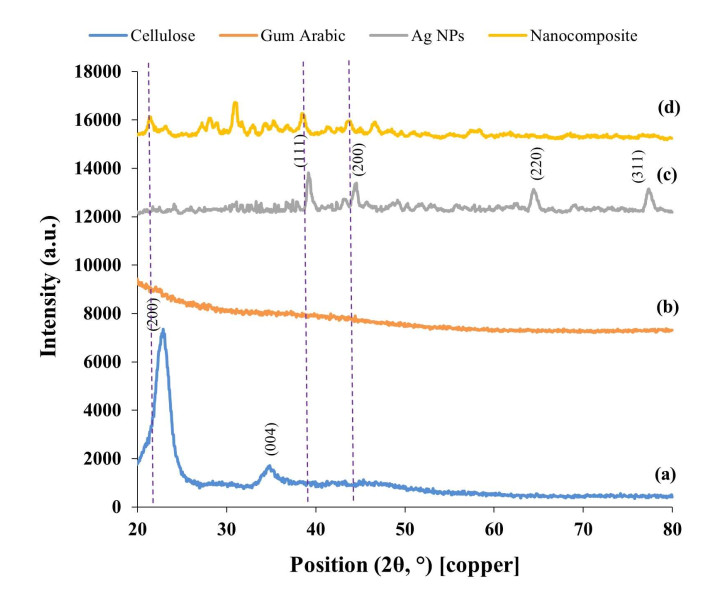
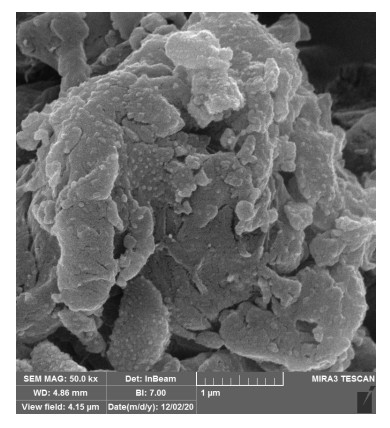
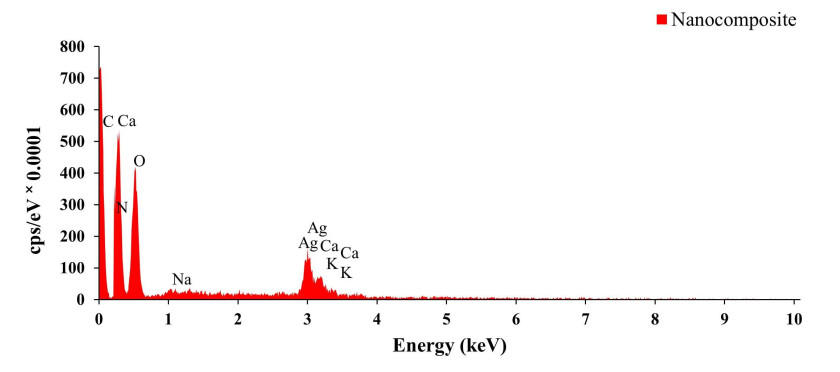
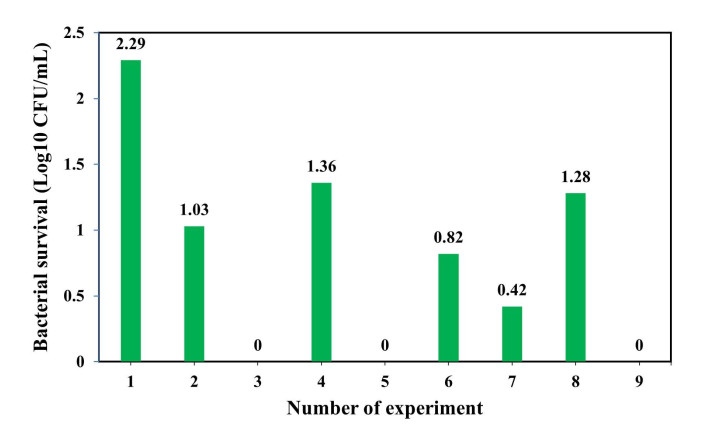
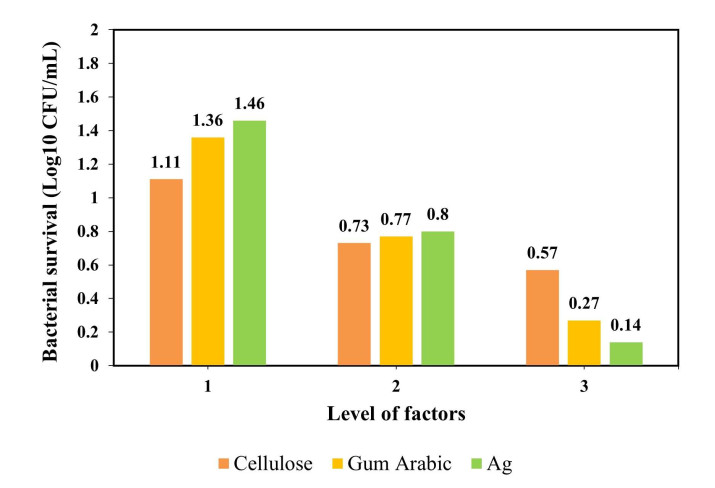
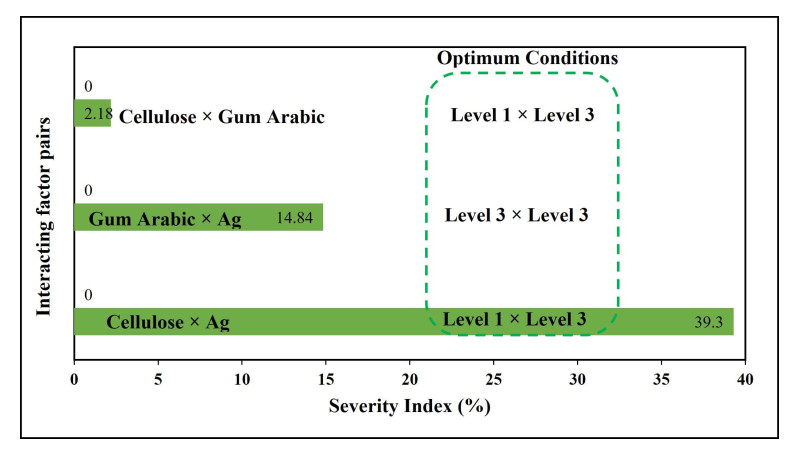
The increasing resistance of microorganisms to conventional antimicrobial compounds requires the development of innovative solutions, such as antimicrobial nanoparticles, to combat antibiotic-resistant infections. This study aimed to optimize the synthesis of a cellulose/gum Arabic/silver (cellulose/GA/Ag) bionanocomposite and evaluate its antibacterial properties against S. mutans, a key contributor to dental caries. Using the Taguchi method, we designed nine experiments with varying levels of cellulose (2, 4, and 6 mg/mL), gum Arabic (1, 2, and 3 mg/mL), and silver nanoparticles (2, 4, and 6 mg/mL). The nanocomposite synthesized under optimal conditions (2 mg/mL cellulose, 3 mg/mL gum Arabic, and 6 mg/mL silver nanoparticles) demonstrated the most potent antibacterial activity, reducing the bacterial survival rate of S. mutans to 0 Log10 CFU/mL, indicating complete inhibition. Variance analysis revealed that silver nanoparticles had the most significant impact on bacterial survival (53.22%), followed by gum Arabic (35.55%) and cellulose (8.86%). Characterization techniques confirmed the successful formation of the nanocomposite: FTIR analysis indicated hydrogen bonding between cellulose and silver nanoparticles, while XRD confirmed the crystalline structure of the nanocomposite. SEM and TEM images revealed a uniform distribution of silver nanoparticles within the cellulose–gum Arabic matrix. TGA-DSC analysis showed enhanced thermal stability, with a significant weight loss at 375 ℃, corresponding to the degradation of cellulose and gum Arabic. The results demonstrate that the cellulose/GA/Ag nanocomposite, synthesized under optimal conditions, exhibits exceptional antibacterial properties and stability, making it a promising candidate for antimicrobial applications in medical and dental fields.

| [1] |
Pourhajibagher M, Bahador A (2021) Synergistic biocidal effects of metal oxide nanoparticles-assisted ultrasound irradiation: Antimicrobial sonodynamic therapy against Streptococcus mutans biofilms. Photodiagnosis Photodyn Ther 35: 102432. https://doi.org/10.1016/j.pdpdt.2021.102432 doi: 10.1016/j.pdpdt.2021.102432

|
| [2] |
Sharifi R, Vatani A, Sabzi A, et al. (2024) A narrative review on application of metal and metal oxide nanoparticles in endodontics. Heliyon 10: e34673. https://doi.org/10.1016/j.heliyon.2024.e34673 doi: 10.1016/j.heliyon.2024.e34673
|
| [3] |
Rostami-Vartooni A, Moradi-Saadatmand A (2019) Green synthesis of magnetically recoverable Fe3O4/HZSM-5 and its Ag nanocomposite using Juglans regia L. leaf extract and their evaluation as catalysts for reduction of organic pollutants. IET Nanobiotechnol 13: 407–415. https://doi.org/10.1049/iet-nbt.2018.5089 doi: 10.1049/iet-nbt.2018.5089
|
| [4] |
Moradpoor H, Safaei M, Golshah A, et al. (2021) Green synthesis and antifungal effect of titanium dioxide nanoparticles on oral Candida albicans pathogen. Inorg Chem Commun 130: 108748. https://doi.org/10.1016/j.inoche.2021.108748 doi: 10.1016/j.inoche.2021.108748
|
| [5] |
Khodadadi B, Bordbar M, Yeganeh-Faal A, et al. (2017) Green synthesis of Ag nanoparticles/clinoptilolite using Vaccinium macrocarpon fruit extract and its excellent catalytic activity for reduction of organic dyes. J Alloys Compd 719: 82–88. https://doi.org/10.1016/j.jallcom.2017.05.135 doi: 10.1016/j.jallcom.2017.05.135
|
| [6] |
Demirkan B, Bozkurt S, Şavk A, et al. (2019) Composites of bimetallic platinum-cobalt alloy nanoparticles and reduced graphene oxide for electrochemical determination of ascorbic acid, dopamine, and uric acid. Sci Rep 9: 12258. https://doi.org/10.1038/s41598-019-48802-0 doi: 10.1038/s41598-019-48802-0
|
| [7] |
Mohammadi H, Moradpoor H, Beddu S, et al. (2025) Current trends and research advances on the application of TiO2 nanoparticles in dentistry: How far are we from clinical translation? Heliyon 11: e42169. https://doi.org/10.1016/j.heliyon.2025.e42169 doi: 10.1016/j.heliyon.2025.e42169
|
| [8] |
Aygün A, Gülbağça F, Nas MS, et al. (2019) Biological synthesis of silver nanoparticles using Rheum ribes and evaluation of their anticarcinogenic and antimicrobial potential: A novel approach in phytonanotechnology. J Pharm Biomed Anal 179: 113012. https://doi.org/10.1016/j.jpba.2019.113012 doi: 10.1016/j.jpba.2019.113012
|
| [9] |
De Jesús Ruíz-Baltazar Á, Reyes-López SY, De Lourdes Mondragón-Sánchez M, et al. (2018) Biosynthesis of Ag nanoparticles using Cynara cardunculus leaf extract: Evaluation of their antibacterial and electrochemical activity. Results Phys 11: 1142–1149. https://doi.org/10.1016/j.rinp.2018.11.032 doi: 10.1016/j.rinp.2018.11.032
|
| [10] |
Mourdikoudis S, Kostopoulou A, LaGrow AP (2021) Magnetic nanoparticle composites: Synergistic effects and applications. Adv Sci 8: 2004951. https://doi.org/10.1002/advs.202004951 doi: 10.1002/advs.202004951
|
| [11] |
Lim JYC, Goh L, Otake KI, et al. (2023) Biomedically-relevant metal organic framework-hydrogel composites. Biomater Sci 11: 2661–2677. https://doi.org/10.1039/D2BM01906J doi: 10.1039/D2BM01906J
|
| [12] |
Safaei M, Taran M (2021) Preparation of bacterial cellulose fungicide nanocomposite incorporated with MgO nanoparticles. J Polym Environ 30: 2066–2076. https://doi.org/10.1007/s10924-021-02329-6 doi: 10.1007/s10924-021-02329-6
|
| [13] |
Zhong C (2020) Industrial-scale production and applications of bacterial cellulose. Front Bioeng Biotechnol 8: 605374. https://doi.org/10.3389/fbioe.2020.605374 doi: 10.3389/fbioe.2020.605374
|
| [14] |
Sethuraman S, Rajendran K (2018) Multicharacteristic behavior of tyrosine present in the microdomains of the macromolecule gum arabic at various pH conditions. ACS Omega 3: 17602–17609. https://doi.org/10.1021/acsomega.8b02928 doi: 10.1021/acsomega.8b02928
|
| [15] |
Dang X, Fu Y, Wang X (2024) Versatile biomass-based injectable photothermal hydrogel for integrated regenerative wound healing and skin bioelectronics. Adv Funct Mater 34: 2405745. https://doi.org/10.1002/adfm.202405745 doi: 10.1002/adfm.202405745
|
| [16] |
Dang X, Yu Z, Wang X, et al. (2023) Eco-friendly cellulose-based nonionic antimicrobial polymers with excellent biocompatibility, nonleachability, and polymer miscibility. ACS Appl Mater Interfaces 15: 50344–50359. https://doi.org/10.1021/acsami.3c10902 doi: 10.1021/acsami.3c10902
|
| [17] |
Dang X, Yu Z, Wang X, et al. (2023) Sustainable one-pot synthesis of novel soluble cellulose-based nonionic biopolymers for natural antimicrobial materials. Chem Eng J 468: 143810. https://doi.org/10.1016/j.cej.2023.143810 doi: 10.1016/j.cej.2023.143810
|
| [18] |
Yin H, Liu F, Abdiryim T, et al. (2024) Sodium carboxymethyl cellulose and MXene reinforced multifunctional conductive hydrogels for multimodal sensors and flexible supercapacitors. Carbohydr Polym 327: 121677. https://doi.org/10.1016/j.carbpol.2023.121677 doi: 10.1016/j.carbpol.2023.121677
|
| [19] |
Raiszadeh-Jahromi Y, Rezazadeh-Bari M, Almasi H, et al. (2020) Optimization of bacterial cellulose production by Komagataeibacter xylinus PTCC 1734 in a low-cost medium using optimal combined design. J Food Sci Technol 57: 2524–2533. https://doi.org/10.1007/s13197-020-04289-6 doi: 10.1007/s13197-020-04289-6
|
| [20] |
Dasaradhudu Y, Srinivasan MA (2020) Synthesis and characterization of silver nanoparticles using co-precipitation method. Mater Today Proc 33: 720–723. https://doi.org/10.1016/j.matpr.2020.06.029 doi: 10.1016/j.matpr.2020.06.029
|
| [21] |
Safaei M, Taran M (2017) Fabrication, characterization, and antifungal activity of sodium hyaluronate-TiO2 bionanocomposite against Aspergillus niger. Mater Lett 207: 113–116. https://doi.org/10.1016/j.matlet.2017.07.038 doi: 10.1016/j.matlet.2017.07.038
|
| [22] |
Zhang G, Lu M, Liu R, et al. (2020) Inhibition of Streptococcus mutans biofilm formation and virulence by Lactobacillus plantarum K41 isolated from traditional Sichuan pickles. Front Microbiol 11: 774. https://doi.org/10.3389/fmicb.2020.00774 doi: 10.3389/fmicb.2020.00774
|
| [23] |
Safaei M, Moghadam A (2022) Optimization of the synthesis of novel alginate-manganese oxide bionanocomposite by Taguchi design as antimicrobial dental impression material. Mater Today Commun 31: 103698. https://doi.org/10.1016/j.mtcomm.2022.103698 doi: 10.1016/j.mtcomm.2022.103698
|
| [24] |
Ottah VE, Ezugwu AL, Ezike TC, et al. (2022) Comparative analysis of alkaline-extracted hemicelluloses from Beech, African rose and Agba woods using FTIR and HPLC. Heliyon 8: e09714. https://doi.org/10.1016/j.heliyon.2022.e09714 doi: 10.1016/j.heliyon.2022.e09714
|
| [25] |
Soni B, Hassan EB, Mahmoud B (2015) Chemical isolation and characterization of different cellulose nanofibers from cotton stalks. Carbohydr Polym 134: 581–589. https://doi.org/10.1016/j.carbpol.2015.08.031 doi: 10.1016/j.carbpol.2015.08.031
|
| [26] |
Safaei M, Mobarakeh MS, Azizi B, et al. (2024) Chitosan/Arabic gum/ZnO bionanocomposite as a novel antibacterial agent. Polimery 69: 362–370. https://doi.org/10.14314/polimery.2024.6.4 doi: 10.14314/polimery.2024.6.4
|
| [27] |
Venkatesan J, Hur W, Gupta PK, et al. (2023) Gum Arabic-mediated liquid exfoliation of transition metal dichalcogenides as photothermic anti-breast cancer candidates. Int J Biol Macromol 244: 124982. https://doi.org/10.1016/j.ijbiomac.2023.124982 doi: 10.1016/j.ijbiomac.2023.124982
|
| [28] |
Wang J, Yang H, Luo L, et al. (2024) Persimmon leaf polyphenols as potential ingredients for modulating starch digestibility: Effect of starch-polyphenol interaction. Int J Biol Macromol 270: 132524. https://doi.org/10.1016/j.ijbiomac.2024.132524 doi: 10.1016/j.ijbiomac.2024.132524
|
| [29] |
Anandalakshmi K, Venugobal J, Ramasamy V (2015) Characterization of silver nanoparticles by green synthesis method using Pedalium murex leaf extract and their antibacterial activity. Appl Nanosci 6: 399–408. https://doi.org/10.1007/s13204-015-0449-z doi: 10.1007/s13204-015-0449-z
|
| [30] |
Hamouda RA, Alharthi MA, Alotaibi AS, et al. (2023) Biogenic nanoparticles silver and copper and their composites derived from marine alga Ulva lactuca: Insight into the characterizations, antibacterial activity, and anti-biofilm formation. Molecules 28: 6324. https://doi.org/10.3390/molecules28176324 doi: 10.3390/molecules28176324
|
| [31] |
Safaei M, Taran M, Imani MM, et al. (2019) Application of Taguchi method in the optimization of synthesis of cellulose-MgO bionanocomposite as antibacterial agent. Pol J Chem Technol 21: 116–122. https://doi.org/10.2478/pjct-2019-0047 doi: 10.2478/pjct-2019-0047
|
| [32] |
Pang J, Mehandzhiyski AY, Zozoulenko I (2023) A computational study of cellulose regeneration: Coarse-grained molecular dynamics simulations. Carbohydr Polym 313: 120853. https://doi.org/10.1016/j.carbpol.2023.120853 doi: 10.1016/j.carbpol.2023.120853
|
| [33] |
Ye D, Rongpipi S, Kiemle SN, et al. (2020) Preferred crystallographic orientation of cellulose in plant primary cell walls. Nat Commun 11: 5720. https://doi.org/10.1038/s41467-020-18449-x doi: 10.1038/s41467-020-18449-x
|
| [34] |
Padovani GC, Feitosa VP, Sauro S, et al. (2015) Advances in dental materials through nanotechnology: Facts, perspectives and toxicological aspects. Trends Biotechnol 33: 621–636. https://doi.org/10.1016/j.tibtech.2015.09.005 doi: 10.1016/j.tibtech.2015.09.005
|
| [35] |
Sathiyaseelan A, Lu Y, Ryu S, et al. (2024) Synthesis of cytocompatible gum Arabic-encapsulated silver nitroprusside nanocomposites for inhibition of bacterial pathogens and food safety applications. Environ Res 263: 120246. https://doi.org/10.1016/j.envres.2024.120246 doi: 10.1016/j.envres.2024.120246
|
| [36] |
Mariadoss AVA, Saravanakumar K, Sathiyaseelan A, et al. (2023) Cellulose-graphene oxide nanocomposites encapsulated with green synthesized silver nanoparticles as an effective antibacterial agent. Mater Today Commun 35: 105652. https://doi.org/10.1016/j.mtcomm.2023.105652 doi: 10.1016/j.mtcomm.2023.105652
|
Figures(11) / Tables(3)

Mohsen Safaei, Mohammad Salmani Mobarakeh, Bahram Azizi, Ehsan Shoohanizad, Ling Shing Wong, Nafiseh Nikkerdar. Optimization of synthesis of cellulose/gum Arabic/Ag bionanocomposite for antibacterial applications[J]. AIMS Materials Science, 2025, 12(2): 278-300. doi: 10.3934/matersci.2025015


 DownLoad: