Different compounds of rare-earth orthochromites Gd1–xYxCrO3 (where x is 0.0–0.9) powder nanoparticles, were synthesized by the auto-combustion method followed by annealing at 700 ℃. All the compounds showed single-phase and crystallized into a distorted orthorhombic structure with the space group (Pbnm). The average particle size for all the samples were in the range 53–110 nm. The detailed and systematic magnetic measurements and analysis showed that all the samples up to x = 0.9 have large magnetization and large values of the change in the magnetic entropy. The magnitude of the change in the magnetic entropy (at 4.5 K and for all the values of the change in the applied magnetic field between 1 and 9 T) is found to increase with increasing x reaching a maximum value at x = 0.3 then it decreases as we increase the yttrium concentration. The nanoparticle compounds with low yttrium concentrations showed a giant change in the magnetic entropy and a giant relative cooling power. Based on the slopes of Arrott plots curves the order parameter of the magnetic transition has been estimated and found to be second order. The giant change in the magnetic entropy and the relative cooling power were tuned in the rages (-45.6 to -8.7 J/kg·K at a change in the applied magnetic field of 9 T; and 136–746 J/kg), around the helium liquefaction temperature. The magnitude of the change in the magnetic entropy is significantly larger for large range of temperatures, up to the nitrogen liquefaction temperature. The giant change in the magnetic entropy and the giant relative cooling power at low temperatures (in the range about 4 to 20 K.) make these samples candidate materials for the low temperature magnetic refrigerant applications, based on the magnetocaloric effect.
Citation: Imaddin A. Al-Omari, Muna D. Al-Mamari, D.J. Sellmyer. Tuning the giant Magnetocaloric Effect and refrigerant capacity in Gd1–xYxCrO3 (0.0 ≤ x ≤ 0.9) perovskites nanoparticles[J]. AIMS Materials Science, 2022, 9(2): 297-310. doi: 10.3934/matersci.2022018
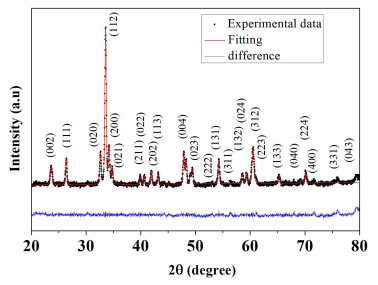
Different compounds of rare-earth orthochromites Gd1–xYxCrO3 (where x is 0.0–0.9) powder nanoparticles, were synthesized by the auto-combustion method followed by annealing at 700 ℃. All the compounds showed single-phase and crystallized into a distorted orthorhombic structure with the space group (Pbnm). The average particle size for all the samples were in the range 53–110 nm. The detailed and systematic magnetic measurements and analysis showed that all the samples up to x = 0.9 have large magnetization and large values of the change in the magnetic entropy. The magnitude of the change in the magnetic entropy (at 4.5 K and for all the values of the change in the applied magnetic field between 1 and 9 T) is found to increase with increasing x reaching a maximum value at x = 0.3 then it decreases as we increase the yttrium concentration. The nanoparticle compounds with low yttrium concentrations showed a giant change in the magnetic entropy and a giant relative cooling power. Based on the slopes of Arrott plots curves the order parameter of the magnetic transition has been estimated and found to be second order. The giant change in the magnetic entropy and the relative cooling power were tuned in the rages (-45.6 to -8.7 J/kg·K at a change in the applied magnetic field of 9 T; and 136–746 J/kg), around the helium liquefaction temperature. The magnitude of the change in the magnetic entropy is significantly larger for large range of temperatures, up to the nitrogen liquefaction temperature. The giant change in the magnetic entropy and the giant relative cooling power at low temperatures (in the range about 4 to 20 K.) make these samples candidate materials for the low temperature magnetic refrigerant applications, based on the magnetocaloric effect.

| [1] |
Smith A, Bahl CRH, Bjørk R, et al. (2012) Materials challenges for high performance magnetocaloric refrigeration devices. Adv Energy Mater 2: 1288–1318. https://doi.org/10.1002/aenm.201200167 doi: 10.1002/aenm.201200167

|
| [2] |
Dhahri K, Dhahri N, Dhahri J, et al. (2018) Critical phenomena and estimation of the spontaneous magnetization from a mean field analysis of the magnetic entropy change in La0.7Ca0.1Pb0.2Mn0.95Al0.025Sn0.025O3. RSC Adv 8: 3099–3107. https://doi.org/10.1039/C7RA12827D doi: 10.1039/C7RA12827D
|
| [3] |
Nordblad P (2013) Strained relations. Nat Mater 12: 11–12. https://doi.org/10.1038/nmat3516 doi: 10.1038/nmat3516
|
| [4] |
Zhao HJ, Íñiguez J, Chen XM, et al. (2016) Origin of the magnetization and compensation temperature in rare-earth orthoferrites and orthochromates. Phys Rev B 93: 014417. https://doi.org/10.1103/PhysRevB.93.014417 doi: 10.1103/PhysRevB.93.014417
|
| [5] |
Gupta P, Bhargava R, Poddar P (2015) Colossal increase in negative magnetization, exchange bias and coercivity in samarium chromite due to a strong coupling between Sm3+–Cr3+ spins sublattices. J Phys D 48: 025004. https://doi.org/10.1088/0022-3727/48/2/025004 doi: 10.1088/0022-3727/48/2/025004
|
| [6] |
Gupta P, Bhargava R, Das R, et al. (2013) Static and dynamic magnetic properties and effect of surface chemistry on the morphology and crystallinity of DyCrO3 nanoplatelets. RSC Adv 3: 26427–26432. https://doi.org/10.1039/c3ra43088j doi: 10.1039/c3ra43088j
|
| [7] |
Bhadram VS, Rajeswaran B, Sundaresan A, et al. (2013) Spin-phonon coupling in multiferroic RCrO3 (R-Y, Lu, Gd, Eu, Sm): a Raman study. Eur Phys Lett 101: 17008. https://doi.org/10.1209/0295-5075/101/17008 doi: 10.1209/0295-5075/101/17008
|
| [8] |
Yoshii K (2012) Magnetization reversal in TmCrO3. Mater Res Bull 47: 3243–3248. https://doi.org/10.1016/j.materresbull.2012.08.005 doi: 10.1016/j.materresbull.2012.08.005
|
| [9] |
Yoshii K, Nakamura A (2000) Reversal of magnetization in La0.5Pr0.5CrO3. J Solid State Chem 155: 447–450. https://doi.org/10.1006/jssc.2000.8943 doi: 10.1006/jssc.2000.8943
|
| [10] |
Gupta P, Poddar P (2015) Temperature and magnetic field-assisted switching of magnetization and observation of exchange bias in YbCrO3 Nanocrystals. Inorg Chem 54: 9509–9516. https://doi.org/10.1021/acs.inorgchem.5b01448 doi: 10.1021/acs.inorgchem.5b01448
|
| [11] |
Cao Y, Cao S, Ren W, et al. (2014) Magnetization switching of rare earth orthochromite CeCrO3. Appl Phys Lett 104: 232405. https://doi.org/10.1063/1.4882642 doi: 10.1063/1.4882642
|
| [12] |
Yusuf SM, Kumar A, Yakhmi JV (2009) Temperature-and magnetic-field-controlled magnetic pole reversal in a molecular magnetic compound. Appl Phys Lett 95: 182506. https://doi.org/10.1063/1.3259652 doi: 10.1063/1.3259652
|
| [13] |
Prejbeanu IL, Kerekes M, Sousa RC, et al. (2007) Thermally assisted MRAM. J Phys Condens Matter 19: 165218. https://doi.org/10.1088/0953-8984/19/16/165218 doi: 10.1088/0953-8984/19/16/165218
|
| [14] |
Mahana S, Manju U, Topwal D (2018) GdCrO3: a potential candidate for low temperature magnetic refrigeration. J Phys D 51: 305002. https://doi.org/10.1088/1361-6463/aacc98 doi: 10.1088/1361-6463/aacc98
|
| [15] |
Zhu Y, Zhou P, Li T, et al. (2020) Enhanced magnetocaloric effect and magnetic phase diagrams of single-crystal GdCrO3. Phys Rev B 102: 144425. https://doi.org/10.1103/PhysRevB.102.144425 doi: 10.1103/PhysRevB.102.144425
|
| [16] |
Oliveira GNP, Pires AL, Machado P, et al. (2019) Effect of chemical pressure on the magnetocaloric effect of perovskite-like RCrO3 (R-Yb, Er, Sm and Y). J Alloys Compd 797: 269–276. https://doi.org/10.1016/j.jallcom.2019.05.011 doi: 10.1016/j.jallcom.2019.05.011
|
| [17] |
Oliveira GNP, Machado P, Pires AL, et al. (2016) Magnetocaloric effect and refrigerant capacity in polycrystalline YCrO3. J Phys Chem Solids 91: 182–188. https://doi.org/10.1016/j.jpcs.2015.12.012 doi: 10.1016/j.jpcs.2015.12.012
|
| [18] |
Arrott A (1957) Criterion for ferromagnetism from observations of magnetic isotherms. Phys Rev 108: 1394. https://doi.org/10.1103/PhysRev.108.1394 doi: 10.1103/PhysRev.108.1394
|
| [19] |
Skomski R, Sellmyer DJ (2009) Anisotropy of rare-earth magnets. J Rare Earth 27: 675–679. https://doi.org/10.1016/S1002-0721(08)60314-2 doi: 10.1016/S1002-0721(08)60314-2
|
| [20] |
Gorodetsky G, Treves D (1964) Second-Order susceptibility terms in orthoferrites at room temperature. Phys Rev 135: A97. https://doi.org/10.1103/PhysRev.135.A97 doi: 10.1103/PhysRev.135.A97
|
| [21] |
Das M, Roy S, Mandal P (2017) Giant reversible magnetocaloric effect in a multiferroic GdFeO3 single crystal. Phys Rev B 96: 174405. https://doi.org/10.1103/PhysRevB.96.174405 doi: 10.1103/PhysRevB.96.174405
|
| [22] |
Dalal B, Sarkar B, Ashok VD, et al. (2018) Magnetization reversal, exchange interaction, and switching behavior studies on Ru doped GdCrO3. J Alloys Compd 739: 418–424. https://doi.org/10.1016/j.jallcom.2017.12.222 doi: 10.1016/j.jallcom.2017.12.222
|
| [23] |
Shi C, Su Y, Guo J, et al. (2021) The microstructure and magnetic properties of Ca2+ ion doped GdCrO3. Ceram Int 47: 10887–10892. https://doi.org/10.1016/j.ceramint.2020.12.208 doi: 10.1016/j.ceramint.2020.12.208
|
| [24] |
Sardar K, Lees MR, Kashtiban RJ, et al. (2011) Direct hydrothermal synthesis and physical properties of rare-earth and yttrium orthochromite perovskites. Chem Mater 23: 48–56. https://doi.org/10.1021/cm102925z doi: 10.1021/cm102925z
|
| [25] |
Yoshii K (2019) Spin rotation, glassy state, and magnetization switching in R CrO3 (R = La1–xPrx, Gd, and Tm): Reinvestigation of magnetization reversal. J Appl Phys 126: 123904. https://doi.org/10.1063/1.5116205 doi: 10.1063/1.5116205
|
| [26] |
Kumar S, Coondoo I, Vasundhara M, et al. (2017) Magnetization reversal behavior and magnetocaloric effect in SmCr0.85Mn0.15O3 chromites. J Appl Phys 121: 043907. https://doi.org/10.1063/1.4974737 doi: 10.1063/1.4974737
|
| [27] |
Shi J, Sauyet T, Dang Y, et al. (2021) Structure-property correlations and scaling in the magnetic and magnetocaloric properties of GdCrO3 particles. J Phys Condens Matter 33: 205801. https://doi.org/10.1088/1361-648X/abf19a doi: 10.1088/1361-648X/abf19a
|
| [28] |
Franco V, Conde A (2010) Scaling laws for the magnetocaloric effect in second order phase transitions: From physics to applications for the characterization of materials. Int J Refrig 33: 465–473. https://doi.org/10.1016/j.ijrefrig.2009.12.019 doi: 10.1016/j.ijrefrig.2009.12.019
|
| [29] |
Franco V, Conde A, Romero-Enrique JM, et al. (2008) A universal curve for the magnetocaloric effect: an analysis based on scaling relations. J Phys Condens Matter 20: 285207. https://doi.org/10.1088/0953-8984/20/28/285207 doi: 10.1088/0953-8984/20/28/285207
|


Figures(9)

Imaddin A. Al-Omari, Muna D. Al-Mamari, D.J. Sellmyer. Tuning the giant Magnetocaloric Effect and refrigerant capacity in Gd1–xYxCrO3 (0.0 ≤ x ≤ 0.9) perovskites nanoparticles[J]. AIMS Materials Science, 2022, 9(2): 297-310. doi: 10.3934/matersci.2022018


 DownLoad: