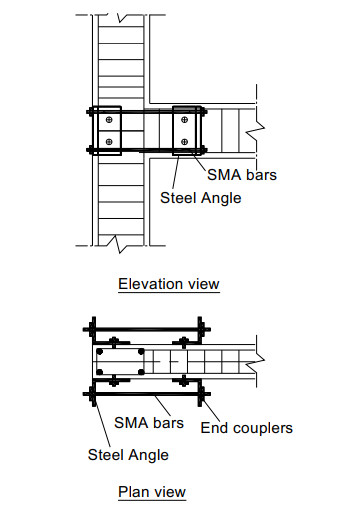
The unique properties of Shape Memory Alloys (SMAs) have motivated researchers to use them as primary reinforcement in reinforced concrete (RC) structures. In this study, the applicability of using external unbonded SMA bars to retrofit RC beam-column joints (BCJs) is investigated. A three-dimensional finite element model, which simulates the suggested retrofitting technique, is first developed, and validated using ABAQUS software. The model is then further simplified and utilized to conduct a parametric study to investigate the behaviour of SMA retrofitted RC BCJs. Results of the parametric study are used to perform multiple linear regression analysis. Simple equations, which can be used to calculate the length and amount of SMA bars required to retrofit a RC BCJ, are then developed.
Citation: Yamen Ibrahim Elbahy, Maged A. Youssef, M. Meshaly. Numerical investigation of reinforced-concrete beam-column joints retrofitted using external superelastic shape memory alloy bars[J]. AIMS Materials Science, 2021, 8(5): 716-738. doi: 10.3934/matersci.2021043
The unique properties of Shape Memory Alloys (SMAs) have motivated researchers to use them as primary reinforcement in reinforced concrete (RC) structures. In this study, the applicability of using external unbonded SMA bars to retrofit RC beam-column joints (BCJs) is investigated. A three-dimensional finite element model, which simulates the suggested retrofitting technique, is first developed, and validated using ABAQUS software. The model is then further simplified and utilized to conduct a parametric study to investigate the behaviour of SMA retrofitted RC BCJs. Results of the parametric study are used to perform multiple linear regression analysis. Simple equations, which can be used to calculate the length and amount of SMA bars required to retrofit a RC BCJ, are then developed.

| [1] |
Bindhu KR, Jaya KP, Manicka Selvam VK (2008) Seismic resistance of exterior beam-column joints with non-conventional confinement reinforcement detailing. Struct Eng Mech30: 733-761. doi: 10.12989/sem.2008.30.6.733

|
| [2] |
Yurdakul O, Avsar O (2015) Structural repairing of damaged reinforced concrete beam-column assemblies with CFRPs. Struct Eng Mech 54: 521-543. doi: 10.12989/sem.2015.54.3.521
|
| [3] |
Chalioris CE, Bantilas KE (2017) Shear strength of reinforced concrete beam-column joints with crossed inclined bars. Eng Struct 140: 241-255. doi: 10.1016/j.engstruct.2017.02.072
|
| [4] |
Golias E, Zapris AG, Kytinou VK, et al. (2021) Effectiveness of the novel rehabilitation method of seismically damaged RC joints using C-FRP ropes and comparison with widely applied method using C-FRP sheets—Experimental investigation. Sustainability 13: 6454. doi: 10.3390/su13116454
|
| [5] |
Golias E, Zapris AG, KytinouVK, et al. (2021) Application of X-shaped CFRP ropes for structural upgrading of reinforced concrete beam-column joints under cyclic loading—Experimental study. Fibers 9: 42. doi: 10.3390/fib9070042
|
| [6] | Janke L, Czaderski C, Motavalli M, et al. (2005) Applications of shape memory alloys in civil engineering structures—Overview, limits and new ideas. Mater Struct 338: 578-592. |
| [7] |
Alam MS, Youssef MA, Nehdi M (2007) Utilizing shape memory alloys to enhance the performance and safety of civil infrastructure: a review.Can J Civil Eng 34: 1075-1086. doi: 10.1139/l07-038
|
| [8] | Abaqus FEA (2021) ABAQUS Analysis user's manual. Available from: http://130.149.89.49:2080/v6.9/index.html. |
| [9] | Scott BD, Park R, Priestley MJN (1982) Stress-strain behavior of concrete confined by overlapping hoops at high and low strain rates. ACI J 79: 13-27. |
| [10] | Stevens NJ (1987) Analytical modeling of reinforced concrete subjected to monotonic and reversed loading [PhD's thesis]. University of Toronto, Toronto. |
| [11] | Youssef M, Ghobarah A (1999) Strength deterioration due to bond slip and concrete crushing in modeling of reinforced concrete members. ACI Struct J 96: 956-966. |
| [12] |
Auricchio F, Taylor RL, Lubliner J (1997) Shape memory alloys macromodeling and numerical simulations of the finite strain superelastic behaviour. Comput Method Appli M 146: 281-312. doi: 10.1016/S0045-7825(96)01232-7
|
| [13] |
Youssef MA, Alam MS, Nehdi M (2008) Experimental investigation on the seismic behaviour of beam-column joints reinforced with superelastic shape memory alloys. J Earthq Eng 12: 1205-1222. doi: 10.1080/13632460802003082
|
| [14] |
Saiidi MS, Sadrossadat-Zadeh M, Ayoub C, et al. (2007) Pilot study of behavior of concrete beams reinforced with shape memory alloys. J Mate Civil Eng 19: 454-461. doi: 10.1061/(ASCE)0899-1561(2007)19:6(454)
|
| [15] | SeismoSoft (2021) SeismoStruct—A computer program for static and dynamic nonlinear analysis of structures. Available from: http://www.seismosoft.com. |
| [16] |
Auricchio F, Sacco E (1997) Superelastic shape-memory-alloy beam model. J Intel Mat Syst Str 8: 489-501. doi: 10.1177/1045389X9700800602
|
| [17] |
Dunlop P, Simon S (2003) Estimating key characteristics of the concrete delivery and placement process using linear regression analysis. Civil Eng Environ Syst 20: 273-290. doi: 10.1080/1028660031000091599
|
| [18] | Montgomery DC, Peck EA, Vining GG (2012) Introduction to Linear Regression Analysis, 5 Eds., John Wiley & Sons. |
Figures(19) / Tables(7)

Yamen Ibrahim Elbahy, Maged A. Youssef, M. Meshaly. Numerical investigation of reinforced-concrete beam-column joints retrofitted using external superelastic shape memory alloy bars[J]. AIMS Materials Science, 2021, 8(5): 716-738. doi: 10.3934/matersci.2021043


 DownLoad: