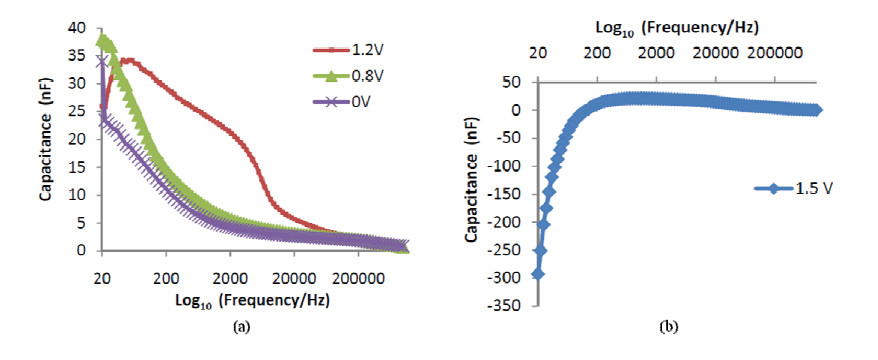
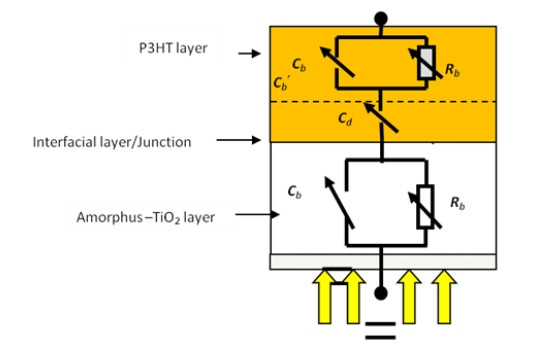
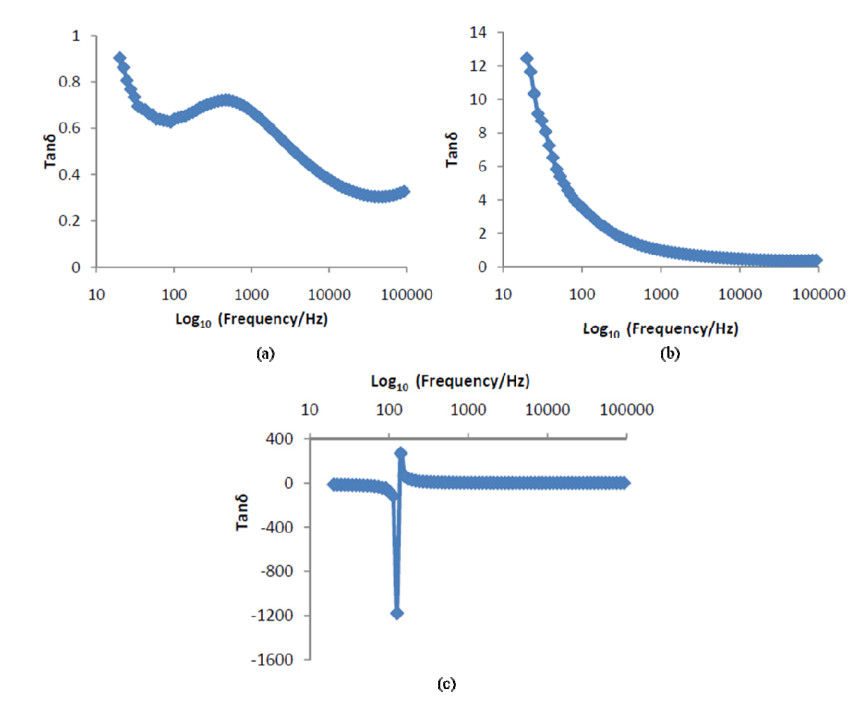
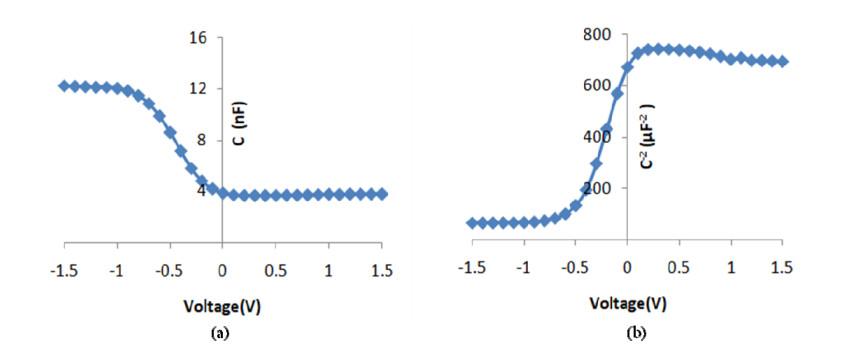
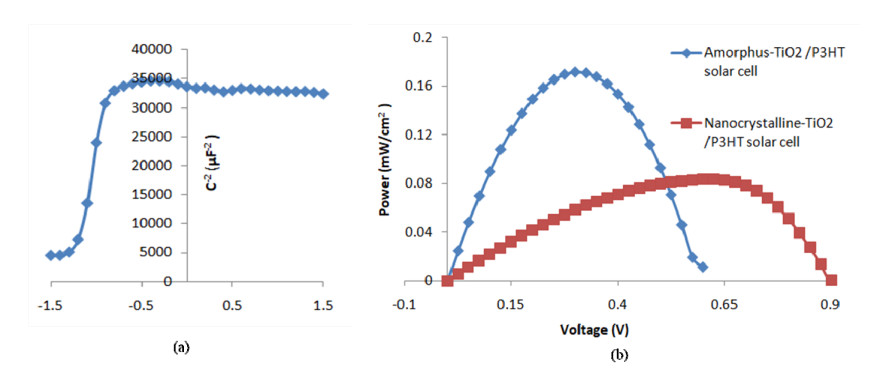
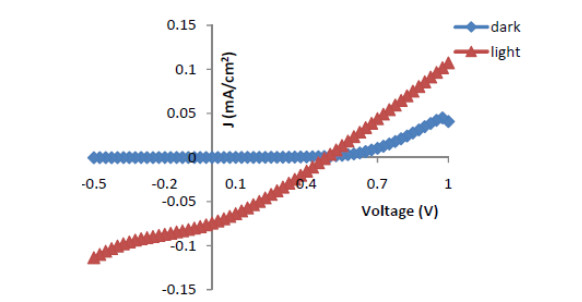
In the present study, we studied the capacitance frequency response of amorphous titanium dioxide (A-TiO2)/poly(3-hexylthiophene) (P3HT) solar cells. The capacitance was measured to provide information on interfacial layer between the two materials. At a low frequency, the capacitance increased because the frequency was lower than the relaxation time of the charge carriers, thus providing evidence of the formation of a depletion region at the P3HT/A-TiO2 interface. The loss tangent was measured for applied voltage ranging from 0 to 1.5 V and the frequencies from 20 Hz and 1 MHz. Peaks in the loss tangent appeared as a function of the applied voltage due to changes in the transport and accumulation mechanisms of charge at the interface and the presence of oxygen molecules in the TiO2. The resulting C-V curves were used to calculate dopant concentration and the barrier's potential, which was found to 1017 cm−3 and 0.6 V, respectively. This confirmed the presence of a depletion region placed in the P3HT region and the validated barrier's potential effect on the open circuit voltage value. It was also shown that the light J-V characteristics of the A-TiO2/P3HT solar cells were independent of the ambient conditions because the conductivity of P3HT and the depletion region were not affected.
Citation: Hmoud. Al-Dmour. Capacitance response of solar cells based on amorphous Titanium dioxide (A-TiO2) semiconducting heterojunctions[J]. AIMS Materials Science, 2021, 8(2): 261-270. doi: 10.3934/matersci.2021017
In the present study, we studied the capacitance frequency response of amorphous titanium dioxide (A-TiO2)/poly(3-hexylthiophene) (P3HT) solar cells. The capacitance was measured to provide information on interfacial layer between the two materials. At a low frequency, the capacitance increased because the frequency was lower than the relaxation time of the charge carriers, thus providing evidence of the formation of a depletion region at the P3HT/A-TiO2 interface. The loss tangent was measured for applied voltage ranging from 0 to 1.5 V and the frequencies from 20 Hz and 1 MHz. Peaks in the loss tangent appeared as a function of the applied voltage due to changes in the transport and accumulation mechanisms of charge at the interface and the presence of oxygen molecules in the TiO2. The resulting C-V curves were used to calculate dopant concentration and the barrier's potential, which was found to 1017 cm−3 and 0.6 V, respectively. This confirmed the presence of a depletion region placed in the P3HT region and the validated barrier's potential effect on the open circuit voltage value. It was also shown that the light J-V characteristics of the A-TiO2/P3HT solar cells were independent of the ambient conditions because the conductivity of P3HT and the depletion region were not affected.

| [1] |
Chikawa T, Shiratori S (2012) The influence of the organic/inorganic interface on the organic-Inorganic hybrid solar cells. J Nanosci Nanotechnol 12: 3725-3731. doi: 10.1166/jnn.2012.6186

|
| [2] |
Wan Z (2020) Interface passivation strategy improves the efficiency and stability of organic-inorganic hybrid metal halide perovskite solar cells. J Mater Res 35: 2166-2189. doi: 10.1557/jmr.2020.202
|
| [3] |
Pei J, Hao YZ, Lv HJ, et al. (2016) Optimizing the performance of TiO2/P3HT hybrid solar cell by effective interfacial modification. Chem Phys Lett 644: 127-131. doi: 10.1016/j.cplett.2015.11.058
|
| [4] |
Yang P, Zhou X, Cao G, et al. (2010) P3HT:PCBM polymer solar cells with TiO2 nanotube aggregates in the active layer. J Mater Chem 20: 2612-2616. doi: 10.1039/b921758d
|
| [5] |
Raïssi M, Leroy-Lhez S, Ratier B (2016) Enhanced photocurrent and stability of organic solar cells using solution-based TS-CuPc interfacial layer. Org Electron 37: 183-189. doi: 10.1016/j.orgel.2016.06.030
|
| [6] | Dong X, Fang X, Lv M, et al. (2015) Improvement of the humidity stability of organic-inorganic perovskite solar cells using ultrathin Al2O3 layers prepared by atomic layer deposition. J Mater Chem 3: 5360-5367. |
| [7] | Cho A, Park N (2017) Impact of interfacial layers in perovskite solar cells. ChemSusChem 10: 3687-3704. |
| [8] |
Jiang Y, Wang X, Pan A (2019) Properties of excitons and photogenerated charge carriers in metal halide perovskites. Adv Mater 31: 1806671. doi: 10.1002/adma.201806671
|
| [9] |
Khelifi S, Decock K, Lauwaert J, et al. (2011) Investigation of defects by admittance spectroscopy measurements in poly (3-hexylthiophene):(6, 6)-phenyl C61-butyric acid methyl ester organic solar cells degraded under air exposure. Int J Appl Phys 110: 094509. doi: 10.1063/1.3658023
|
| [10] |
Al-Dmour H, Taylor DM, Cambridge JA (2007) Effect of nanocrystalline-TiO2 morphology on the performance of polymer heterojunction solar cells. J phys D Appl Phys 40: 5034-5038. doi: 10.1088/0022-3727/40/17/004
|
| [11] | Sze M (1981) Physics of Semiconductor Devices, 2 Eds., New York: Wiley-Interscience. |
| [12] |
Juarez-Perez EJ, Sanchez RS, Badia L, et al. (2014) Photoinduced giant dielectric constant in lead halide perovskite solar cells. J Phys Chem Lett 5: 2390-2394. doi: 10.1021/jz5011169
|
| [13] |
Al-Dmour H, Taylor DM (2011) Small-signal response of nanocrystalline-titanium dioxide/poly(3-hexylthiophene) heterojunction solar cells. Thin Solid Films 519: 8135-8138. doi: 10.1016/j.tsf.2011.06.009
|
| [14] |
Wypych A, Bobowska I, Tracz M, et al. (2014) Dielectric properties and characterisation of titanium dioxide obtained by different chemistry methods. J Nanomat 2014: 124814. doi: 10.1155/2014/124814
|
| [15] |
Ghahremanirad E, Bou A, Olyaee S, et al. (2017) Inductive loop in the impedance response of perovskite solar cells explained by surface polarization model. J Phys Chem Lett 8: 1402-1406. doi: 10.1021/acs.jpclett.7b00415
|
| [16] | Stephen L (2020) Titanium dioxide versatile solid crystalline: An overview, In: Dongre RS, Peshwe DR, Assorted Dimensional Reconfigurable Materials, IntechOpen. |
| [17] | Al-Dmour H (2020) A comparative study of titanium dioxide preparation methods in solar cells based on the TiO2 semiconducting polymer heterojunction. IJAAS 7: 133-138. |
| [18] |
Torres I, Taylor DM (2005) Interface states in polymer metal-insulator-semiconductor devices. Int J Appl Phys 98: 073710. doi: 10.1063/1.2081109
|
| [19] |
Al-Dmour H, Taylor DM (2009) Revisiting the origin of open circuit voltage in nanocrystalline-TiO2/polymer heterojunction solar cells. Appl Phys Lett 94: 223309. doi: 10.1063/1.3153122
|
Figures(7)

Hmoud. Al-Dmour. Capacitance response of solar cells based on amorphous Titanium dioxide (A-TiO2) semiconducting heterojunctions[J]. AIMS Materials Science, 2021, 8(2): 261-270. doi: 10.3934/matersci.2021017


 DownLoad: